 🏗️ New Construction
3139 Savannah Rose Dr · Angleton, TX
Flood risk No data
- FEMA flood zone
- —
- Chance of flooding over 30 yrs
- —
- Est. flood insurance / yr
- —
Fire risk No data
- Est. fire insurance / yr
- —
Heat risk No data
- Hot days now (above threshold)
- —
- Hot days in 30 yrs
- —
Wind risk No data
- Chance of severe wind over 30 yrs
- —
Air-quality risk No data
- Unhealthy air days now
- —
- Unhealthy air days in 30 yrs
- —
Risk factors via First Street. Map © Google.
Why this score? — see what drove the C- grade
The composite is a weighted blend of 9 inputs, each scored 0–100. Each bar is that input's sub-score; the figure is the points it added to the 100-point composite (weight × sub-score).
- Cash flow +22.0/30.0
- ARV discount +7.5/15.0
- DSCR +7.0/10.0
- 1% rule +5.4/10.0
- Livability +3.7/5.0
- Schools +3.5/10.0
- Rent growth +2.5/5.0
- Condition / age +2.5/5.0
- Appreciation +0.0/10.0
$204,040
🖨 Deal sheet (PDF) 📄 Offer letter ✓ Due diligence
Listing remarks
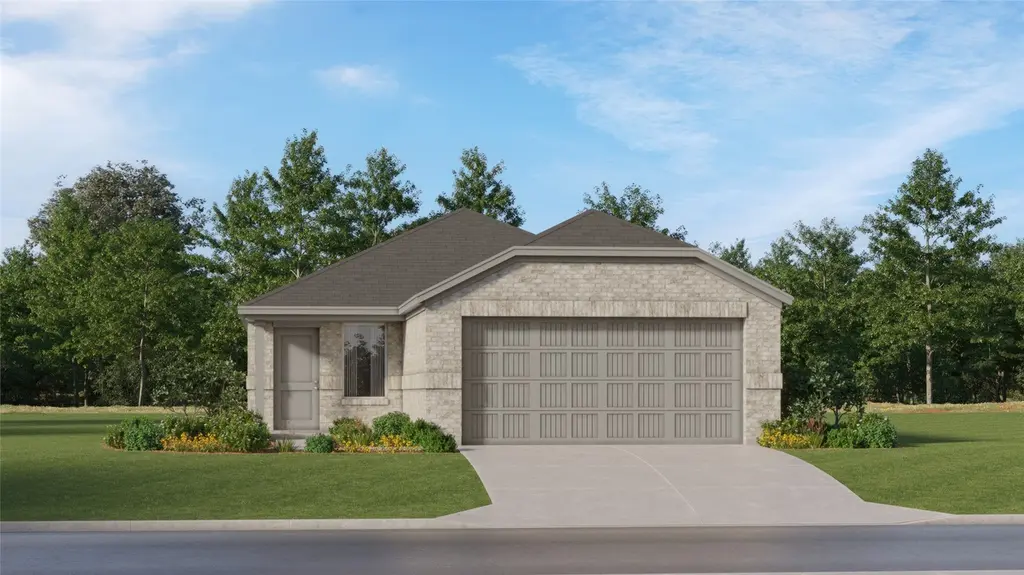
The Idlewood Floor Plan - This single-level home showcases a spacious open floorplan shared between the kitchen, dining area and family room for easy entertaining, along with access to an outdoor space. An owner’s suite enjoys a private location in a rear corner of the home, complemented by an en-suite bathroom and walk-in closet. There are two secondary bedrooms at the front of the home, ideal for household members and overnight guests. The completion date, prices and features may vary and are subject to change. Please verify with Lennar directly. Photos are for illustrative purposes only.
Key facts
- Walk-in closet
- Open floorplan
- Outdoor space
Tags
Property features AI
Finance
- HOA & community: Homeowners association managed by Preferred Management Services; Annual association fee of $825
Exterior
- Parking: Attached 2-car garage
- Utilities: Public water; Public sewer
- Home design: Residential property; New construction (under construction); Single-story (all main rooms listed on first level)
- Construction: Built in 2026; Brick construction; Composition roof; Slab foundation
- Exterior features: Back yard fence
Interior
- Kitchen: Dishwasher; Electric range and oven; Gas range and oven
- Bedrooms: Primary bedroom on first floor (approx. 14 x 14); Bedroom on first floor (approx. 10 x 12); Bedroom on first floor (approx. 10 x 12)
- Flooring: Carpet
- Bathrooms: 2 full bathrooms
- Heating & cooling: Central heating (electric and gas); Central air conditioning (electric and gas)
- Interior features: Breakfast bar; Kitchen/family room combo; Kitchen/dining combo; Separate shower; Tub/shower combo
- Laundry & utility: Washer hookup; Electric dryer hookup; Gas dryer hookup
Neighborhood map
What this means for you Summary
Snapshot
- This is a 3-bed/2.0-bath land listed at $204k.
Deal economics
- At list price, monthly cash flow is $252 ($3k/yr) — positive.
- To cash-flow at today's rent, offer at most $202k (0.8% below list).
- To meet the 1% rule (rent ≥ 1% of price), the offer needs to be $165k (19.3% below list).
- Recommended offer: $165k (19.3% below list) — sets the bar for 1% rule.
- Cap rate 8.2% vs local median 4.0% in Angleton — top-decile yield for the area; either an underpriced asset or a hidden risk that comps aren't pricing in. Stress-test before assuming the spread holds.
Location & tenants
- Location reads 74/100 on livability (#171 in TX, #4,520 nationally) — a middle-class / working-renter tenant base. Strengths: cost of living A+, housing A+, employment A-; Watch: amenities F, commute F.
- Angleton ISD (suburban): math 36% / reading 44% proficiency, ranked #375 of 826 in TX (top 45%) — families likely to look elsewhere, expect single-tenant / working-renter base with shorter leases.
- Zoned schools: Rancho Isabella El (math 42% / reading 47%, grade F, #1,155 of 4,322 statewide, top 29%, 418 students, 68% FRL); Angleton J H School (math 26% / reading 41%, grade F, #911 of 1,662 statewide, top 56%, 1,561 students, 68% FRL); Angleton H S (math 22% / reading 45%, grade F, #1,011 of 1,632 statewide, top 63%, 2,066 students, 67% FRL).
- Market conditions: 932 active listings in the ZIP; 7 comparable units currently listed for rent nearby; rentals at typical pace (median 26d on market — plan ~3-4 weeks tenant-placement turnaround); 43% of comp listings sitting > 30 days — soft ceiling on asking rent; solid renter incomes; 3,960 units permitted in Brazoria County in 2024 (593 in 5+ unit buildings).
Forward outlook
- Local home prices are declining (-3.0%/yr); year-one equity from $1k of loan paydown is wiped out by about $5k of value loss. Plan a longer hold.
- Brazoria County population projected at +44% by 2050 — long-run rental-demand tailwind backs the buy-and-hold thesis.
Negotiation context
- It's been on market 35 days — a 3% lower offer ($198k) is reasonable based on typical stale-listing flexibility.
- 2 sale attempts with the ask held roughly flat each time — persistent listings suggest the price (not the market) is what's stuck; bring a comps-based counter.
Questions for the listing agent
- It's been on market 35 days. Have you received any prior offers? Is the seller open to a 19% concession, seller financing, or rate buy-down credit?
- What does the HOA fee cover, when was the last increase, and are there any pending special assessments or reserve-fund shortfalls?
- Is there a deadline driving the sale (1031 exchange, divorce, estate, relocation)? That informs how much negotiation room exists.
- Schools are D-rated, which usually means shorter tenancies and higher turnover. Who's the typical renter profile here, and what's been the actual vacancy rate?
- What's the average days-on-market for RENTAL listings here right now (not sales)? A rising rental-DOM trend means longer vacancies and softer asking-rent achievability than the comps imply.
- What's the recent tenant-quality profile in this submarket — average credit score on applications, eviction rate, late-payment / NSF rate, and stable-employment percentage? A property-management company in the area should have these aggregated.
- How much new for-sale + rental construction is in the pipeline within 1–3 miles? Heavy new supply typically softens prices + rents 12–24 months out; constrained supply supports both.
Investment metrics
- 1% rule
- 1.04% ✓
- Cap rate
- 8.20%
- Cash-on-cash
- 6.83%
- DSCR
- 1.30
- GRM
- 8.0
CMA / ARV
- ARV (median comp)
- $157,977
- List price
- $204,040
- Delta
- 29.16%
- Verdict
- OVERPRICED
- Comps
- 2 within 1.0 mi
Projected returns pro-forma
-3.0% appreciation · 3.0% rent growth · sell at horizon
- IRR
- -5.8%
- Equity multiple
- 0.78×
- Total profit
- $-9,571
- Equity at exit
- $23,555
- IRR
- 3.8%
- Equity multiple
- 1.28×
- Total profit
- $12,302
- Equity at exit
- $13,659
Cash invested: $44,234 (down + closing). Projections, not guarantees.
Landlord ↔ Tenant lean methodology
- Overall (STATE)
- 87 Strongly Landlord-Friendly
- State Texas
- 87 Strongly Landlord-Friendly · R+5
- County
- — inherits STATE
- City
- — inherits STATE
ZIP-level market 77515
- Home prices YoY
- -5.1%
- Active inventory
- 932
- Price-to-rent
- 10.3×
Monthly cashflow live
- Estimated rent
- $1,647 high interval (Pro) →
- Mortgage (P&I)
- −$828
- Tax from tax record
- −$86 /mo · $1,034/yr
- Insurance
- −$66
- HOA
- −$69
- Vacancy / Maint / Mgmt
- −$346
- Net cashflow
- $252
Break-even live
Sensitivity live
| Price | -10% $341 | -5% $296 | +0% $252 | +5% $207 | +10% $162 |
|---|---|---|---|---|---|
| Rent | -10% $122 | -5% $187 | +0% $252 | +5% $317 | +10% $382 |
| Rate | -1.0pp $331 | -0.5pp $292 | base $252 | +0.5pp $211 | +1.0pp $169 |
UW: 25.0% down · 7.5% · 30yr · 1.5% tax · 5.0% vac · 8.0% maint · 8.0% mgmt
Financing live
Cash to close
- Down payment
- $39,494
- Closing costs
- $4,739
- Reserves months
- —
- Total cash needed
- —
Loan-product check · same deal, 3 products live
Conventional
25% down · 7.5% · 30yr
- Down + closing
- —
- Monthly P&I
- —
- Monthly cashflow
- —
- DSCR
- —
- Eligible?
- —
Personal DTI + credit; lowest rate.
DSCR
20% down · 8.5% · 30yr
- Down + closing
- —
- Monthly P&I
- —
- Monthly cashflow
- —
- DSCR
- —
- Eligible?
- —
No personal income docs; deal must DSCR.
Hard money
10% down · 12.0% · 12mo
- Down + closing
- —
- Monthly P&I
- —
- Monthly cashflow
- —
- DSCR
- —
- Eligible?
- —
Short-term bridge; refi at stabilization.
Rent comps 7 comps
| Address | Beds | Baths | Sqft | Rent | $/sqft | DOM | Units | Dist |
|---|---|---|---|---|---|---|---|---|
| 1400 E Henderson Rd Angleton, TX | 1.0–2.0 | 1.0–2.0 | 752 | $999 | $1.33 | 0d | 1 | 0.41mi |
| 1300 Buchta Rd Angleton, TX | 1.0–3.0 | 1.0–2.0 | 773 | $1,085 | $1.40 | 26d | 8 | 0.63mi |
| 1300 Buchta Rd Angleton, TX | 1.0–3.0 | 1.0–2.0 | 773 | $1,113 | $1.44 | 0d | 13 | 0.63mi |
| 1405 Northview Dr Angleton, TX | 3.0 | 2.0 | 1172 | $2,225 | $1.90 | 4d | 1 | 0.98mi |
| 3 Dallas Ct #1 Angleton, TX | 3.0 | 3.0 | 1550 | $1,450 | $0.94 | 45d | 1 | 1.11mi |
| 128 Dallas St Angleton, TX | 3.0 | 2.0 | 1390 | $1,900 | $1.37 | 45d | 1 | 1.14mi |
| 152 Bastrop St Angleton, TX | 3.0 | 2.0 | 1639 | $1,745 | $1.06 | 45d | 1 | 1.27mi |
HOA detail
- Monthly dues
- $69 · $828/yr
Listing history 17 events
-
2026-06-15days on market $204,040 Active 35 DOM
-
2026-06-13days on market $204,040 Active 33 DOM
-
2026-06-09days on market $204,040 Active 29 DOM
-
2026-06-08days on market $204,040 Active 28 DOM
-
2026-06-07days on market $204,040 Active 27 DOM
-
2026-06-04days on market $204,040 Active 24 DOM
-
2026-06-03days on market $204,040 Active 23 DOM
-
2026-06-02days on market $204,040 Active 22 DOM
-
2026-06-01days on market $204,040 Active 21 DOM
-
2026-05-31days on market $204,040 Active 20 DOM
-
2026-05-11historical
-
2026-05-11$204,040 Active 603-char remark
-
2026-05-07price $204,040
-
2026-05-04price $207,740
-
2026-04-29price $212,040
-
2026-04-23price $219,340
-
2026-04-15$222,990 Active
ⓘ Source: listings_history table (triggers on properties + properties_extension) + one-shot
backfill from property_details.listing_events for pre-trigger history.
Tax reassessment forecast TX · Resets to sale price
- Current annual tax
- $1,034 · $86/mo
- Projected year-2 tax
- $3,734 · $311/mo
- Expected delta
- +$2,700/yr (+$225/mo · 261.2%)
ⓘ Screening estimate from a state-policy table — verify with the county assessor before closing.
Nearby sold comps map
Loading sold comps map…
Walkable amenities ~0.75 mi
Loading nearby amenities…
Taxation est. · year 1
- Rental income
- $19,764
- − Mortgage interest
- −$8,849
- − Property taxes
- −$1,034
- − Insurance
- −$790
- − Repairs & maintenance
- −$1,581
- − Management
- −$1,581
- − HOA
- −$828
- − Depreciation
- −$4,596
- Taxable income
- $505
- Est. tax owed @ 24.0%
- −$121
- After-tax cash flow
- $2,899/yr
For passive investors: Depreciation is non-cash, so a rental often shows a tax loss while cash-flowing — sheltering income. Rental losses are passive: they offset passive income freely, and up to $25,000/yr can offset ordinary (W-2) income if you actively participate and your MAGI is under $100k (phasing out to $0 by $150k); unused losses carry forward. On sale, claimed depreciation is recaptured at up to 25%, and gains may owe capital-gains tax (a 1031 exchange can defer both). Figures are a year-1 estimate at your 24.0% rate — not tax advice; consult a CPA.
Schools (NCES district)
- District
- Angleton ISD
- NCES district ID
- 4808310
- Math proficiency
- 36% ▼ -8.00%
- Reading proficiency
- 44% ▲ 1.00%
- Median HH income
- $55,670
- Composite
- 35.01/100
- National rank
- #5046
- State rank
- #375 of 826 in TX
Livability — Angleton
- Score
- 74/100
- State rank
- #171
- US rank
- #4520
Category grades
Schools grade is shown separately in the Schools card above.
Census & demographics
- County
- Brazoria County · 374,982 people
- City population
- 34,088
- Metro
- Houston-The Woodlands-Sugar Land, TX
- Population (ZIP)
- 34,088
- Household income
- $88,787
- Rent vs Own
- Severe rent burden
- 785.0
Population outlook (Brazoria County) Hauer SSP2
- Today (2025)
- 420,414 people
- By 2030
- 457,585 · +8.8%
- By 2040
- 532,232 · +26.6%
- By 2050
- 605,399 · +44.0%
- By 2075
- 779,358 · +85.4%
- By 2100
- 883,759 · +110.2%
Race, ethnicity, and origin ACS 2023
- Neighborhood character
- Diverse neighborhood (Simpson 0.58)
- Race & ethnicity
- White 55% Hispanic / Latino 33% Two or more races 18% Black 8% Asian 2%
- Hispanic origin (detail)
- Mexican 28%
- Common ancestry
- Lithuanian 3% Romanian 2% Slovak 1%
- Foreign-born
- 8% · Canada, Vietnam
- Languages at home
- 78% English-only · Spanish 20% Other Asian/Pacific 1%
Political lean MEDSL · Brazoria
- 2024 margin
- R (+19.7) · D 39.5% · R 59.2% · Other 1.3%
- 2008→2024 swing
- +9.9pp toward D · 2008: -29.6pp · 2024: -19.7pp
- All cycles
- 2024: R+19.7 2020: R+18.2 2016: R+24.6 2012: R+34.2 2008: R+29.6
Not yet ingested
- Civics
- —
Market trends
- HPI YoY
- ▼ -15.59%
- Current HPI
- 288.7286
- Rent YoY
- —
- Metro
- Houston-The Woodlands-Sugar Land, TX
- State GDP YoY
- ▲ 3.95%
- F500 in state
- 110
Industry mix (Fortune 500 HQ in TX)
| Industry | F500 HQs | Revenue |
|---|---|---|
| Energy | 16 | $1,198B |
|
||
| Technology | 5 | $198B |
|
||
| Engineering / Construction | 4 | $72B |
|
||
| Energy Services | 3 | $60B |
|
||
| Utilities | 3 | $41B |
|
||
| Healthcare | 2 | $330B |
|
||
Price history
-8.5% since first listed8 events — show timeline
- 2026-05-29 Sold (MLS) — HARMLS
- 2026-05-11 Listing Removed — HARMLS
- 2026-05-11 Listed $204,040 HARMLS
- 2026-05-07 Price Changed $204,040 HARMLS
- 2026-05-04 Price Changed $207,740 HARMLS
- 2026-04-29 Price Changed $212,040 HARMLS
- 2026-04-23 Price Changed $219,340 HARMLS
- 2026-04-15 Listed $222,990 HARMLS
Property tax history
-53.2%/yrLatest (2025): $1,034 · -53.2% YoY. Source: county tax records.
Cash-flow waterfall
monthlySold comps — $/sqft
last 12 mo · ≤1 miLoading sold comps…