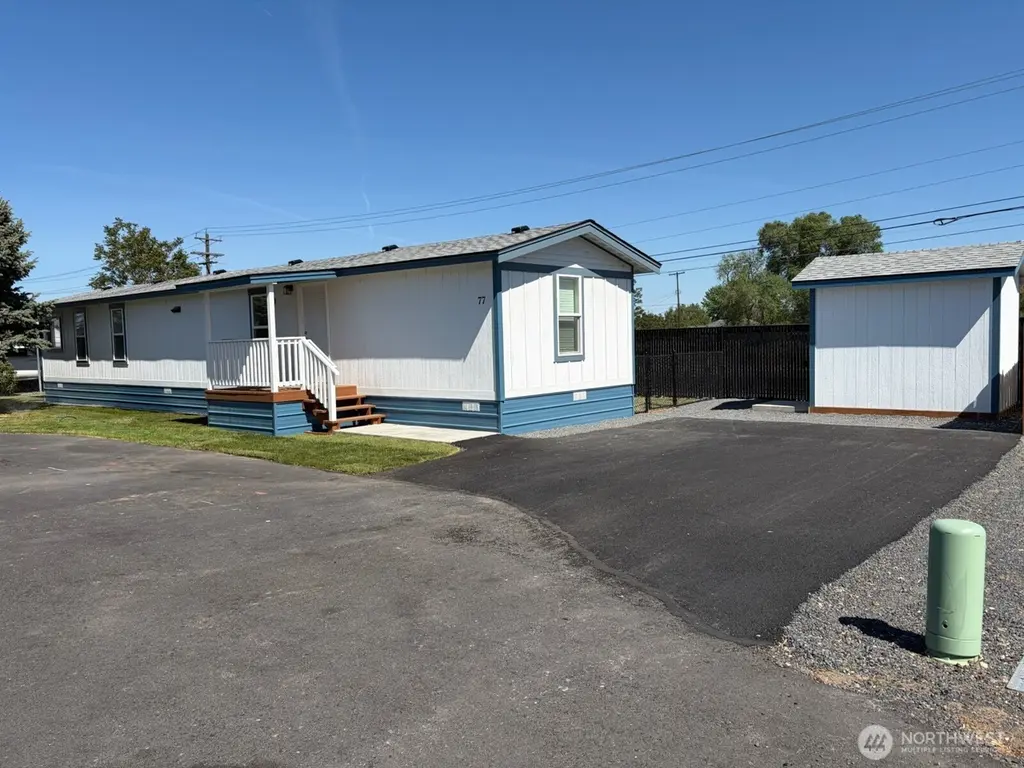
3010 W Peninsula Dr #77 · Moses Lake, WA
Flood risk 1/10 · Minimal
- FEMA flood zone
- X (unshaded)
- Chance of flooding over 30 yrs
- 0.0%
- Est. flood insurance / yr
- $507 – $1,088
Fire risk 1/10 · Minimal
- Est. fire insurance / yr
- $604 – $1,122
Heat risk 4/10 · Minor
- Hot days now (above 96°F)
- 7 days/yr
- Hot days in 30 yrs
- 16 days/yr
Wind risk 1/10 · Minimal
- Chance of severe wind over 30 yrs
- —
Air-quality risk 7/10 · Major
- Unhealthy air days now
- 12 days/yr
- Unhealthy air days in 30 yrs
- 14 days/yr
Risk factors via First Street. Map © Google.
Why this score? — see what drove the B+ grade
The composite is a weighted blend of 9 inputs, each scored 0–100. Each bar is that input's sub-score; the figure is the points it added to the 100-point composite (weight × sub-score).
- Cash flow +30.0/30.0
- ARV discount +13.3/15.0
- 1% rule +10.0/10.0
- DSCR +10.0/10.0
- Schools +3.9/10.0
- Livability +3.8/5.0
- Condition / age +2.5/5.0
- Rent growth +2.1/5.0
- Appreciation +0.0/10.0
$69,950
🖨 Deal sheet 📄 Offer letter ✓ Due diligence
Listing remarks
Just like new single wide has been totally remodeled in a great park with security gate. 12' x 8' Shed
Key facts
- Parking
- Built 1988
- Listed 41 days
Property features AI
Finance
- Other: Calculated living area approximately 980 square feet; Foundation details: see remarks
- Financial info: Listing terms: Cash or Conventional
- HOA & community: Located in Peninsula Estates (manufactured home park approved for sale); Land lease: $500
Exterior
- Parking: Uncovered parking
- Utilities: Electric energy source; Community water; Pioneer Energy Mgt water and sewer; Grant County PUD power
- Home design: Manufactured single-wide home; Single level; Updated/remodeled; North-facing
- Construction: Wood construction; Composition roof; Manufactured after 06/15/1976; Mobile home remains
- Exterior features: Wood exterior; Wood products; Located on a cul-de-sac; Paved access; Secluded lot
Interior
- Kitchen: Refrigerator
- Bedrooms: 2 bedrooms
- Bathrooms: 2 full bathrooms
- Heating & cooling: Heat pump heating; Forced air cooling; Has heating; Has cooling
- Interior features: Water heater; Bath off primary; Patio/porch/deck; Has view
- Laundry & utility: Electric water heater
Neighborhood map
What this means for you Summary
Snapshot
- This is a 3-bed/2.0-bath manufactured listed at $70k.
Deal economics
- At list price, monthly cash flow is $829 ($10k/yr) — positive.
- The deal already cash-flows at list — no discount required.
- Meets the 1% rule at list price ($2k rent vs $70k).
- Recommended offer: $68k (3.0% below list) — sets the bar for market timing.
- Cap rate 20.5% vs local median 3.3% in Moses Lake — top-decile yield for the area; either an underpriced asset or a hidden risk that comps aren't pricing in. Stress-test before assuming the spread holds.
Location & tenants
- Location reads 75/100 on livability (#170 in WA, #4,228 nationally) — a middle-class / working-renter tenant base. Strengths: housing A+, health & safety A+, amenities A-; Watch: employment C-, schools D+, crime F.
- Moses Lake School District (town): math 38% / reading 48% proficiency, ranked #198 of 291 in WA (top 68%) — families likely to look elsewhere, expect single-tenant / working-renter base with shorter leases.
- Market conditions: Rents soft (-1.7%/yr); 585 active listings in the ZIP; 7 comparable units currently listed for rent nearby; rentals lingering (median 44d on market — plan ~5-8 weeks vacancy on turnover, expect pricing pressure); 100% of comp listings sitting > 30 days — soft ceiling on asking rent; 559 units permitted in Grant County in 2024 (35 in 5+ unit buildings).
Forward outlook
- Local home prices are declining (-3.0%/yr); year-one equity from $484 of loan paydown is wiped out by about $2k of value loss. Plan a longer hold.
- Grant County population projected at +16% by 2050 — long-run rental-demand tailwind backs the buy-and-hold thesis.
- At projected returns (-3.0% appreciation + 0.0% rent growth), your $20k cash investment doubles in ~3 years — after that, you're playing with house money.
Negotiation context
- It's been on market 42 days — a 3% lower offer ($68k) is reasonable based on typical stale-listing flexibility.
- Current owner paid $16k; list at $70k implies a 330% gain — meaningful room to come down on a strong offer.
Questions for the listing agent
- It's been on market 42 days. Have you received any prior offers? Is the seller open to a 3% concession, seller financing, or rate buy-down credit?
- Is there a deadline driving the sale (1031 exchange, divorce, estate, relocation)? That informs how much negotiation room exists.
- Schools are D-rated, which usually means shorter tenancies and higher turnover. Who's the typical renter profile here, and what's been the actual vacancy rate?
- Crime grade is F in this area — have there been break-ins, vandalism, or insurance claims at this property in the last 3 years? What carrier currently insures it and at what premium?
- What's the average days-on-market for RENTAL listings here right now (not sales)? A rising rental-DOM trend means longer vacancies and softer asking-rent achievability than the comps imply.
- What's the recent tenant-quality profile in this submarket — average credit score on applications, eviction rate, late-payment / NSF rate, and stable-employment percentage? A property-management company in the area should have these aggregated.
- How much new for-sale + rental construction is in the pipeline within 1–3 miles? Heavy new supply typically softens prices + rents 12–24 months out; constrained supply supports both.
Investment metrics
- 1% rule
- 2.24% ✓
- Cap rate
- 20.51%
- Cash-on-cash
- 50.77%
- DSCR
- 3.26
- GRM
- 3.7
CMA / ARV
- ARV (median comp)
- $80,326
- List price
- $69,950
- Delta
- -12.92%
- Verdict
- UNDERPRICED
- Comps
- 9 within 1.0 mi
Show comp detail 6 sales within ~0.75 mi
| Address | Dist | Beds/Ba | Sqft | Sold | Price | $/sf | Match |
|---|---|---|---|---|---|---|---|
| 140 3010 W Peninsula Drive #140 | 0.06mi | 2/2.0 (-1) | 938 (+2%) | 1mo | $77,000 | $82 | 89 |
| 3010 W Peninsula Dr #132 | 0.00mi | 2/2.0 (-1) | 924 (0%) | 8mo | $50,000 | $54 | 89 |
| 3211 W Wapato Dr #24 | 0.27mi | 3/1.5 | 936 (+1%) | 8mo | $48,000 | $51 | 77 |
| 3010 W Peninsula Dr #104 | 0.14mi | 2/2.0 (-1) | 938 (+2%) | 17mo | $55,500 | $59 | 72 |
| 3131 W Wapato Dr #17 | 0.19mi | 3/2.0 | 1,056 (+14%) | 16mo | $114,000 | $108 | 54 |
| 3211 W Wapato Dr #66 | 0.26mi | 3/2.0 | 1,056 (+14%) | 22mo | $112,000 | $106 | 46 |
Match score weights: distance 35% · size 25% · config 20% · recency 20%. Top-matched comps best support the ARV.
Projected returns pro-forma
-3.0% appreciation · 0.0% rent growth · sell at horizon
- IRR
- 45.3%
- Equity multiple
- 2.88×
- Total profit
- $36,827
- Equity at exit
- $10,430
- IRR
- 49.9%
- Equity multiple
- 5.20×
- Total profit
- $82,186
- Equity at exit
- $6,048
Cash invested: $19,586 (down + closing). Projections, not guarantees.
Landlord ↔ Tenant lean methodology
- Overall (STATE)
- 28 Tenant-Leaning
- State Washington
- 28 Tenant-Leaning · D+8
- County
- — inherits STATE
- City
- — inherits STATE
ZIP-level market 98837
- Rents YoY
- -1.7%
- Active inventory
- 585
- Price-to-rent
- 3.7×
Monthly cashflow live
- Estimated rent
- $1,567 high interval (Pro) →
- Mortgage (P&I)
- −$367
- Tax from tax record
- −$14 /mo · $164/yr
- Insurance
- −$29
- HOA
- −$0
- Vacancy / Maint / Mgmt
- −$329
- Net cashflow
- $829
Break-even live
UW: 25.0% down · 7.5% · 30yr · 1.5% tax · 5.0% vac · 8.0% maint · 8.0% mgmt
Financing live
Cash to close
- Down payment
- $17,488
- Closing costs
- $2,098
- Reserves months
- —
- Total cash needed
- —
Loan-product check · same deal, 3 products live
Conventional
25% down · 7.5% · 30yr
- Down + closing
- —
- Monthly P&I
- —
- Monthly cashflow
- —
- DSCR
- —
- Eligible?
- —
Personal DTI + credit; lowest rate.
DSCR
20% down · 8.5% · 30yr
- Down + closing
- —
- Monthly P&I
- —
- Monthly cashflow
- —
- DSCR
- —
- Eligible?
- —
No personal income docs; deal must DSCR.
Hard money
10% down · 12.0% · 12mo
- Down + closing
- —
- Monthly P&I
- —
- Monthly cashflow
- —
- DSCR
- —
- Eligible?
- —
Short-term bridge; refi at stabilization.
Rent comps 7 comps
| Address | Beds | Baths | Sqft | Rent | $/sqft | DOM | Units | Dist |
|---|---|---|---|---|---|---|---|---|
| 511 S Interlake Rd Moses Lake, WA | 2.0–4.0 | 2.0 | 1095 | $1,170 | $1.07 | 43d | 8 | 0.27mi |
| 2722 W Peninsula Dr Moses Lake, WA | 2.0 | 1.0 | 858 | $1,350 | $1.57 | 43d | 1 | 0.29mi |
| 2900 W Marina Dr Moses Lake, WA | 2.0 | 2.0 | 1036 | $1,688 | $1.63 | 43d | 1 | 0.55mi |
| 2812 W Marina Dr Unit D Moses Lake, WA | 2.0 | 2.0 | 1078 | $1,695 | $1.57 | 43d | 1 | 0.56mi |
| 1830 W Crouse St #1 Moses Lake, WA | 2.0 | 1.0 | 946 | $1,295 | $1.37 | 43d | 1 | 1.04mi |
| 1701 W Crouse St Moses Lake, WA | 1.0–3.0 | 1.0–2.0 | 1017 | $1,650 | $1.62 | 43d | 6 | 1.16mi |
| Pheasant St Moses Lake, WA | 2.0 | 1.0 | 850 | $1,450 | $1.71 | 43d | 1 | 1.23mi |
Listing history 20 events
-
2026-06-19days on market $69,950 Active 42 DOM
-
2026-06-18days on market $69,950 Active 41 DOM
-
2026-06-17days on market $69,950 Active 40 DOM
-
2026-06-16days on market $69,950 Active 39 DOM
-
2026-06-15days on market $69,950 Active 38 DOM
-
2026-06-14days on market $69,950 Active 36 DOM
-
2026-06-13pricedays on market $69,950 Active 35 DOM
-
2026-06-10days on market $74,950 Active 33 DOM
-
2026-06-09days on market $74,950 Active 32 DOM
-
2026-06-08days on market $74,950 Active 31 DOM
-
2026-06-07days on market $74,950 Active 30 DOM
-
2026-06-05days on market $74,950 Active 27 DOM
-
2026-06-03days on market $74,950 Active 26 DOM
-
2026-06-02days on market $74,950 Active 25 DOM
-
2026-06-01days on market $74,950 Active 24 DOM
-
2026-05-31days on market $74,950 Active 23 DOM
-
2026-05-30days on market $74,950 Active 22 DOM
-
2026-05-08$74,950 Active
-
2001-05-01soldstatus $16,250
-
1993-10-14soldstatus $21,000
ⓘ Source: listings_history table (triggers on properties + properties_extension) + one-shot
backfill from property_details.listing_events for pre-trigger history.
Tax reassessment forecast WA · Resets to sale price
- Current annual tax
- $164 · $14/mo
- Projected year-2 tax
- $686 · $57/mo
- Expected delta
- +$522/yr (+$43/mo · 318.3%)
ⓘ Screening estimate from a state-policy table — verify with the county assessor before closing.
Climate risk First Street
- Flood 1/10 Low FEMA zone X (unshaded) · 0% chance over 30 yrs
- Wildfire 1/10 Low
- Heat 4/10 Moderate 7 d/yr ≥96°F today · 16 d/yr by 30 yrs out
- Wind 1/10 Low
- Air quality 7/10 Severe 12 unhealthy d/yr today · 14 by 30 yrs out
Nearby sold comps map
Loading sold comps map…
Walkable amenities ~0.75 mi
Loading nearby amenities…
Taxation est. · year 1
- Rental income
- $18,809
- − Mortgage interest
- −$3,918
- − Property taxes
- −$164
- − Insurance
- −$350
- − Repairs & maintenance
- −$1,505
- − Management
- −$1,505
- − Depreciation
- −$2,035
- Taxable income
- $9,333
- Est. tax owed @ 24.0%
- −$2,240
- After-tax cash flow
- $7,704/yr
For passive investors: Depreciation is non-cash, so a rental often shows a tax loss while cash-flowing — sheltering income. Rental losses are passive: they offset passive income freely, and up to $25,000/yr can offset ordinary (W-2) income if you actively participate and your MAGI is under $100k (phasing out to $0 by $150k); unused losses carry forward. On sale, claimed depreciation is recaptured at up to 25%, and gains may owe capital-gains tax (a 1031 exchange can defer both). Figures are a year-1 estimate at your 24.0% rate — not tax advice; consult a CPA.
Schools (NCES district)
- District
- Moses Lake School District
- NCES district ID
- 5305220
- Math proficiency
- 38% ▬ 0.00%
- Reading proficiency
- 48% ▼ -1.00%
- Median HH income
- $49,033
- Composite
- 39.17/100
- National rank
- #8232
- State rank
- #198 of 291 in WA
Livability — Moses Lake
- Score
- 75/100
- State rank
- #170
- US rank
- #4228
Category grades
Schools grade is shown separately in the Schools card above.
Census & demographics
- Census place
- Moses Lake, WA
- County
- Grant County · 61,643 people
- City population
- 49,455
- Metro
- Moses Lake, WA
- Population (ZIP)
- 49,455
- Household income
- $74,586
- Rent vs Own
- Severe rent burden
- 1064.0
Population outlook (Grant County) Hauer SSP2
- Today (2025)
- 99,356 people
- By 2030
- 102,107 · +2.8%
- By 2040
- 108,318 · +9.0%
- By 2050
- 114,712 · +15.5%
- By 2075
- 131,376 · +32.2%
- By 2100
- 146,163 · +47.1%
Race, ethnicity, and origin ACS 2023
- Neighborhood character
- Diverse neighborhood (Simpson 0.55)
- Race & ethnicity
- White 58% Hispanic / Latino 33% Two or more races 15% Black 2% Asian 1%
- Hispanic origin (detail)
- Mexican 30%
- Common ancestry
- Portuguese 3% Subsaharan African 2% Lithuanian 2%
- Foreign-born
- 10% · Canada
- Languages at home
- 76% English-only · Spanish 21% Russian/Polish/Slavic 2%
Political lean MEDSL · Grant
- 2024 margin
- Solid R (+37.5) · D 30.0% · R 67.4% · Other 2.6%
- 2008→2024 swing
- -9.9pp toward R · 2008: -27.5pp · 2024: -37.5pp
- All cycles
- 2024: R+37.5 2020: R+34.4 2016: R+37.9 2012: R+32.6 2008: R+27.5
Not yet ingested
- Civics
- —
Market trends
- HPI YoY
- ▼ -384.29%
- Current HPI
- 208.4574
- Rent YoY
- ▼ -1.72%
- Metro
- Moses Lake, WA
- State GDP YoY
- ▲ 4.65%
- F500 in state
- 22
Industry mix (Fortune 500 HQ in WA)
| Industry | F500 HQs | Revenue |
|---|---|---|
| Retail | 2 | $269B |
|
||
| Technology / Retail | 1 | $638B |
|
||
| Technology | 1 | $245B |
|
||
| Telecommunications | 1 | $38B |
|
||
| Food / Beverage | 1 | $36B |
|
||
| Automotive / Trucks | 1 | $34B |
|
||
Price history
+233.1% since first listed4 events — show timeline
- 2026-06-10 Price Changed $69,950 NWMLS as Distributed by MLS Grid
- 2026-05-08 Listed $74,950 NWMLS as Distributed by MLS Grid
- 2001-05-01 Sold (Public Records) $16,250 Public Records
- 1993-10-14 Sold (Public Records) $21,000 Public Records
Property tax history
-1.9%/yrLatest (2026): $164 · +0.0% YoY. Source: county tax records.
Cash-flow waterfall
monthlySold comps — $/sqft
last 12 mo · ≤1 miLoading sold comps…