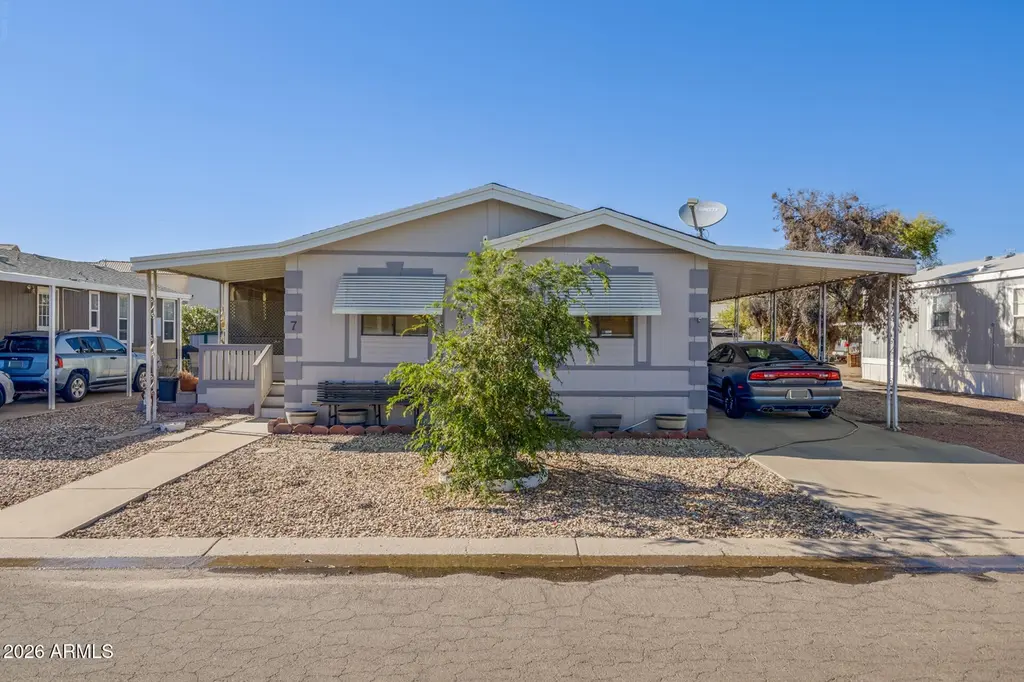
6960 W Peoria Ave #7 · Peoria, AZ
Flood risk No data
- FEMA flood zone
- —
- Chance of flooding over 30 yrs
- —
- Est. flood insurance / yr
- —
Fire risk No data
- Est. fire insurance / yr
- —
Heat risk No data
- Hot days now (above threshold)
- —
- Hot days in 30 yrs
- —
Wind risk No data
- Chance of severe wind over 30 yrs
- —
Air-quality risk No data
- Unhealthy air days now
- —
- Unhealthy air days in 30 yrs
- —
Risk factors via First Street. Map © Google.
Why this score? — see what drove the B grade
The composite is a weighted blend of 9 inputs, each scored 0–100. Each bar is that input's sub-score; the figure is the points it added to the 100-point composite (weight × sub-score).
- Cash flow +30.0/30.0
- 1% rule +10.0/10.0
- DSCR +10.0/10.0
- ARV discount +7.5/15.0
- Livability +3.8/5.0
- Condition / age +3.8/5.0
- Schools +3.5/10.0
- Rent growth +2.7/5.0
- Appreciation +0.0/10.0
$75,900
🖨 Deal sheet 📄 Offer letter ✓ Due diligence
Listing remarks MLS
Welcome to this beautifully updated 3br, 2bath double-wide home located in the desirable 55+ gated community of Casa Del Sol East! This move-in-ready property features numerous upgrades throughout, including a newer roof (2021) and stylish flooring installed in 2020. The remodeled kitchen offers modern finishes and functionality, while both bathrooms have been tastefully updated for a fresh, contemporary feel. An added laundry room enhances convenience, and the home comes complete with all 3 refrigerators, as well as a stackable washer and dryer-making your move seamless. The exterior was freshly painted in 2023, giving the home great curb appeal. Enjoy comfort, security, and low-maintenance living in this well-maintained community-prefect for full-time residents or seasonal living!
Key facts
- Gated community
- Newer roof
- Remodeled kitchen
Tags
Neighborhood map
What this means for you Summary
Snapshot
- This is a 3-bed/2.0-bath manufactured listed at $76k. Condition is rated good.
Deal economics
- At list price, monthly cash flow is $1k ($14k/yr) — positive.
- The deal already cash-flows at list — no discount required.
- Meets the 1% rule at list price ($2k rent vs $76k).
- Recommended offer: $71k (6.0% below list) — sets the bar for market timing.
- Cap rate 24.5% vs local median 3.3% in Peoria — top-decile yield for the area; either an underpriced asset or a hidden risk that comps aren't pricing in. Stress-test before assuming the spread holds.
Location & tenants
- Location reads 76/100 on livability (#14 in AZ, #3,603 nationally) — a middle-class / working-renter tenant base. Strengths: housing A+, commute A, employment A; Watch: cost of living C-, amenities D, health & safety F.
- Peoria Unified School District (4237) (suburban): math 36% / reading 42% proficiency, ranked #64 of 249 in AZ (top 26%) — families likely to look elsewhere, expect single-tenant / working-renter base with shorter leases.
- Market conditions: Rents flat; 333 active listings in the ZIP; 40 comparable units currently listed for rent nearby; rentals at typical pace (median 18d on market — plan ~3-4 weeks tenant-placement turnaround); 36,011 units permitted in Maricopa County in 2024 (12,801 in 5+ unit buildings).
- This rent runs 38% of the median local income ($67k/yr) — at the standard rent-burdened threshold; future hikes will face affordability resistance.
Forward outlook
- Local home prices are declining (-3.0%/yr); year-one equity from $525 of loan paydown is wiped out by about $2k of value loss. Plan a longer hold.
- Maricopa County population projected at +38% by 2050 — long-run rental-demand tailwind backs the buy-and-hold thesis.
- At projected returns (-3.0% appreciation + 0.6% rent growth), your $21k cash investment doubles in ~2 years — after that, you're playing with house money.
Negotiation context
- It's been on market 80 days — a 6% lower offer ($71k) is reasonable based on typical stale-listing flexibility.
- 3 sale attempts since 2y ago with the ask held roughly flat each time — persistent listings suggest the price (not the market) is what's stuck; bring a comps-based counter.
Questions for the listing agent
- It's been on market 80 days. Have you received any prior offers? Is the seller open to a 6% concession, seller financing, or rate buy-down credit?
- Why hasn't it sold? Are there any deal-killer items the seller is aware of (foundation, flood, title, zoning, code violations)?
- Is there a deadline driving the sale (1031 exchange, divorce, estate, relocation)? That informs how much negotiation room exists.
- Schools are B-rated — typically a magnet for longer-tenancy family renters. What's the average tenant stay here, and is there a school-zone premium baked into asking?
- What's the average days-on-market for RENTAL listings here right now (not sales)? A rising rental-DOM trend means longer vacancies and softer asking-rent achievability than the comps imply.
- What's the recent tenant-quality profile in this submarket — average credit score on applications, eviction rate, late-payment / NSF rate, and stable-employment percentage? A property-management company in the area should have these aggregated.
- How much new for-sale + rental construction is in the pipeline within 1–3 miles? Heavy new supply typically softens prices + rents 12–24 months out; constrained supply supports both.
Investment metrics
- 1% rule
- 2.80% ✓
- Cap rate
- 24.55%
- Cash-on-cash
- 65.20%
- DSCR
- 3.90
- GRM
- 3.0
CMA / ARV
- ARV (median comp)
- $50,558
- List price
- $75,900
- Delta
- 50.12%
- Verdict
- OVERPRICED
- Comps
- 5 within 1.0 mi
Show comp detail 12 sales within ~0.75 mi
| Address | Dist | Beds/Ba | Sqft | Sold | Price | $/sf | Match |
|---|---|---|---|---|---|---|---|
| 6960 W Peoria Ave #231 | 0.00mi | 3/2.0 | 1,536 (-2%) | 14mo | $56,700 | $37 | 85 |
| 6960 W Peoria Ave #15 | 0.00mi | 3/1.5 | 1,392 (-11%) | 0mo | $40,000 | $29 | 79 |
| 6960 W Peoria Ave #197 | 0.00mi | 2/2.0 (-1) | 1,520 (-3%) | 14mo | $72,000 | $47 | 78 |
| 6960 W Peoria Ave #125 | 0.00mi | 2/2.0 (-1) | 1,456 (-7%) | 15mo | $30,000 | $21 | 70 |
| 8601 N 71st Ave #89 | 0.26mi | 3/2.0 | 1,456 (-7%) | 11mo | $145,000 | $100 | 67 |
| 8601 N 71st Ave #17 | 0.26mi | 3/2.0 | 1,474 (-6%) | 14mo | $150,000 | $102 | 67 |
| 8601 N 71st Ave #56 | 0.26mi | 4/2.0 (+1) | 1,560 (-0%) | 20mo | $101,000 | $65 | 65 |
| 6960 W Peoria Ave Unit 103-3 | 0.00mi | 3/2.0 | 1,344 (-14%) | 16mo | $85,000 | $63 | 62 |
| 6960 W Peoria Ave #237 | 0.00mi | 2/2.0 (-1) | 1,344 (-14%) | 13mo | $80,000 | $60 | 61 |
| 8601 N 71st Ave #128 | 0.26mi | 3/2.0 | 1,440 (-8%) | 20mo | $100,000 | $69 | 58 |
| 8601 N 71st Ave #55 | 0.26mi | 4/2.0 (+1) | 1,440 (-8%) | 18mo | $97,000 | $67 | 55 |
| 8595 N 71st Ave #88 | 0.30mi | 3/2.0 | 1,344 (-14%) | 18mo | $95,000 | $71 | 47 |
Match score weights: distance 35% · size 25% · config 20% · recency 20%. Top-matched comps best support the ARV.
Projected returns pro-forma
-3.0% appreciation · 0.62% rent growth · sell at horizon
- IRR
- 61.7%
- Equity multiple
- 3.65×
- Total profit
- $56,301
- Equity at exit
- $11,317
- IRR
- 65.4%
- Equity multiple
- 6.85×
- Total profit
- $124,398
- Equity at exit
- $6,562
Cash invested: $21,252 (down + closing). Projections, not guarantees.
Landlord ↔ Tenant lean methodology
- Overall (STATE)
- 87 Strongly Landlord-Friendly
- State Arizona
- 87 Strongly Landlord-Friendly · R+3
- County
- — inherits STATE
- City
- — inherits STATE
ZIP-level market 85345
- Home prices YoY
- -19.8%
- Rents YoY
- 0.6%
- Active inventory
- 333
- Price-to-rent
- 3.0×
Monthly cashflow live
- Estimated rent
- $2,126 high interval (Pro) →
- Mortgage (P&I)
- −$398
- Tax est. 1.5%
- −$95 /mo · $1,138/yr
- Insurance
- −$32
- HOA
- −$0
- Vacancy / Maint / Mgmt
- −$446
- Net cashflow
- $1,155
Break-even live
UW: 25.0% down · 7.5% · 30yr · 1.5% tax · 5.0% vac · 8.0% maint · 8.0% mgmt
Financing live
Cash to close
- Down payment
- $18,975
- Closing costs
- $2,277
- Reserves months
- —
- Total cash needed
- —
Loan-product check · same deal, 3 products live
Conventional
25% down · 7.5% · 30yr
- Down + closing
- —
- Monthly P&I
- —
- Monthly cashflow
- —
- DSCR
- —
- Eligible?
- —
Personal DTI + credit; lowest rate.
DSCR
20% down · 8.5% · 30yr
- Down + closing
- —
- Monthly P&I
- —
- Monthly cashflow
- —
- DSCR
- —
- Eligible?
- —
No personal income docs; deal must DSCR.
Hard money
10% down · 12.0% · 12mo
- Down + closing
- —
- Monthly P&I
- —
- Monthly cashflow
- —
- DSCR
- —
- Eligible?
- —
Short-term bridge; refi at stabilization.
Rent comps 40 comps
| Address | Beds | Baths | Sqft | Rent | $/sqft | DOM | Units | Dist |
|---|---|---|---|---|---|---|---|---|
| 7217 W Golden Ln Peoria, AZ | 3.0 | 3.0 | 1986 | $2,235 | $1.13 | 5d | 1 | 0.22mi |
| 7217 W Golden Ln Peoria, AZ | 3.0 | 3.0 | 1986 | $2,275 | $1.15 | 17d | 1 | 0.22mi |
| 8772 N 67th Ave Glendale, AZ | 1.0–3.0 | 1.0–2.0 | 937 | $2,009 | $2.14 | 1d | 24 | 0.63mi |
| 7102 W Carol Ave Peoria, AZ | 3.0 | 2.0 | 1288 | $1,970 | $1.53 | 5d | 1 | 0.70mi |
| 9121 N 68th Ave Peoria, AZ | 2.0 | 2.0 | 1126 | $1,699 | $1.51 | 43d | 1 | 0.77mi |
| 7102 W Palo Verde Ave Peoria, AZ | 3.0 | 2.0 | 1360 | $2,000 | $1.47 | 43d | 1 | 0.79mi |
| 7027 W Palo Verde Ave Peoria, AZ | 3.0 | 2.0 | 1500 | $1,999 | $1.33 | 43d | 1 | 0.81mi |
| 6619 W Golden Ln Glendale, AZ | 4.0 | 2.0 | 1768 | $2,029 | $1.15 | 1d | 1 | 0.86mi |
| 6619 W Golden Ln Glendale, AZ | 4.0 | 2.0 | 1768 | $1,979 | $1.12 | 10d | 1 | 0.86mi |
| 9160 N 67th Ave Peoria, AZ | 2.0 | 2.0 | 1100 | $2,065 | $1.88 | 43d | 6 | 0.88mi |
| 9914 N 73rd Ave Peoria, AZ | 3.0 | 1.5 | 1312 | $1,716 | $1.31 | 43d | 1 | 0.94mi |
| 8014 W Eva St Peoria, AZ | 4.0 | 2.0 | 1659 | $2,085 | $1.26 | 43d | 1 | 0.97mi |
| 8938 N 64th Ln Glendale, AZ | 3.0 | 2.0 | 1256 | $2,095 | $1.67 | 1d | 1 | 1.02mi |
| 7542 W Cinnabar Ave Peoria, AZ | 3.0 | 2.5 | 1947 | $1,895 | $0.97 | 43d | 1 | 1.04mi |
| 9903 N 77th Ave Peoria, AZ | 3.0 | 2.0 | 1446 | $1,895 | $1.31 | 4d | 1 | 1.05mi |
| 7009 W Brown St Peoria, AZ | 4.0 | 2.0 | 1790 | $2,195 | $1.23 | 12d | 1 | 1.10mi |
| 7951 W Whitney Dr Peoria, AZ | 2.0–4.0 | 2.0–2.5 | 1411 | $2,540 | $1.80 | 1d | 30 | 1.13mi |
| 9819 N 67th Dr Peoria, AZ | 3.0 | 2.0 | 1648 | $2,500 | $1.52 | 24d | 1 | 1.15mi |
| 7861 N 80th Ave Glendale, AZ | 4.0 | 2.0 | 1614 | $2,250 | $1.39 | 7d | 1 | 1.17mi |
| 7812 N 79th Dr Glendale, AZ | 4.0 | 2.0 | 1682 | $2,250 | $1.34 | 1d | 1 | 1.18mi |
| 9519 N 81st Dr Peoria, AZ | 3.0 | 2.5 | 1752 | $1,940 | $1.11 | 24d | 1 | 1.20mi |
| 6353 W Mission Ln Glendale, AZ | 3.0 | 2.0 | 1780 | $2,200 | $1.24 | 43d | 1 | 1.22mi |
| 8183 W Carol Ave Peoria, AZ | 3.0 | 2.5 | 1684 | $1,975 | $1.17 | 44d | 1 | 1.24mi |
| 6421 W Carol Ave Glendale, AZ | 3.0 | 2.0 | 1243 | $1,799 | $1.45 | 18d | 1 | 1.25mi |
| 9022 N 63rd Dr Glendale, AZ | 3.0 | 2.0 | 1401 | $2,195 | $1.57 | 12d | 1 | 1.25mi |
| 7552 W State Ave Glendale, AZ | 3.0 | 2.0 | 1875 | $2,061 | $1.10 | 23d | 1 | 1.27mi |
| 9459 N 64th Dr Glendale, AZ | 3.0 | 2.0 | 1531 | $2,600 | $1.70 | 14d | 1 | 1.28mi |
| 8145 W Palo Verde Ave Peoria, AZ | 4.0 | 2.0 | 2132 | $1,895 | $0.89 | 14d | 1 | 1.28mi |
| 10013 N 66th Ln Glendale, AZ | 3.0 | 2.0 | 1063 | $1,999 | $1.88 | 24d | 1 | 1.29mi |
| 6513 W Turquoise Ave Glendale, AZ | 3.0 | 2.5 | 1961 | $2,160 | $1.10 | 43d | 1 | 1.29mi |
| 9201 N 83rd Ave Peoria, AZ | 1.0–3.0 | 1.0–2.0 | 981 | $1,975 | $2.01 | 1d | 29 | 1.30mi |
| 9592 N 82nd Ave Peoria, AZ | 3.0 | 2.5 | 1401 | $1,775 | $1.27 | 14d | 1 | 1.31mi |
| 7332 N 70th Dr Glendale, AZ | 3.0 | 2.0 | 1262 | $1,700 | $1.35 | 1d | 1 | 1.32mi |
| 6204 W Evergreen Rd Glendale, AZ | 3.0 | 2.0 | 1895 | $2,066 | $1.09 | 23d | 1 | 1.34mi |
| 7321 N 69th Ave Glendale, AZ | 4.0 | 2.5 | 1645 | $1,999 | $1.22 | 1d | 1 | 1.41mi |
| 8165 W Whitney Dr Peoria, AZ | 1.0–2.0 | 1.0–2.0 | 911 | $2,223 | $2.44 | 1d | 229 | 1.43mi |
| 7022 W Cesar St Peoria, AZ | 3.0 | 2.5 | 1514 | $1,895 | $1.25 | 43d | 1 | 1.43mi |
| 6337 W Turquoise Ave Glendale, AZ | 3.0 | 3.0 | 1938 | $2,095 | $1.08 | 21d | 1 | 1.44mi |
| 7034 W McMahon Way Peoria, AZ | 3.0 | 2.5 | 1606 | $1,895 | $1.18 | 20d | 1 | 1.47mi |
| 7255 W Palmaire Ave Glendale, AZ | 3.0 | 2.5 | 2034 | $1,895 | $0.93 | 10d | 1 | 1.50mi |
Listing history 21 events
-
2026-06-18days on market $75,900 Active 80 DOM
-
2026-06-17days on market $75,900 Active 79 DOM
-
2026-06-16days on market $75,900 Active 78 DOM
-
2026-06-15days on market $75,900 Active 77 DOM
-
2026-06-13days on market $75,900 Active 75 DOM
-
2026-06-13days on market $75,900 Active 74 DOM
-
2026-06-09days on market $75,900 Active 71 DOM
-
2026-06-08days on market $75,900 Active 70 DOM
-
2026-06-07days on market $75,900 Active 69 DOM
-
2026-06-04days on market $75,900 Active 66 DOM
-
2026-06-03days on market $75,900 Active 65 DOM
-
2026-06-02days on market $75,900 Active 64 DOM
-
2026-06-01days on market $75,900 Active 63 DOM
-
2026-05-31days on market $75,900 Active 62 DOM
-
2026-03-29$78,500 Active 798-char remark
Show marketing remark (798 chars)
Welcome to this beautifully updated 3br, 2bath double-wide home located in the desirable 55+ gated community of Casa Del Sol East! This move-in-ready property features numerous upgrades throughout, including a newer roof (2021) and stylish flooring installed in 2020. The remodeled kitchen offers modern finishes and functionality, while both bathrooms have been tastefully updated for a fresh, contemporary feel. An added laundry room enhances convenience, and the home comes complete with all 3 refrigerators, as well as a stackable washer and dryer-making your move seamless. The exterior was freshly painted in 2023, giving the home great curb appeal. Enjoy comfort, security, and low-maintenance living in this well-maintained community-prefect for full-time residents or seasonal living!
-
2025-12-01historical
-
2025-08-28price $78,000
-
2025-07-15$80,000 Active
-
2025-03-05historical
-
2024-05-03price $140,000
-
2024-03-13$145,000 Active
ⓘ Source: listings_history table (triggers on properties + properties_extension) + one-shot
backfill from property_details.listing_events for pre-trigger history.
Nearby sold comps map
Loading sold comps map…
Walkable amenities ~0.75 mi
Loading nearby amenities…
Taxation est. · year 1
- Rental income
- $25,506
- − Mortgage interest
- −$4,252
- − Property taxes
- −$1,138
- − Insurance
- −$380
- − Repairs & maintenance
- −$2,041
- − Management
- −$2,041
- − Depreciation
- −$2,208
- Taxable income
- $13,448
- Est. tax owed @ 24.0%
- −$3,227
- After-tax cash flow
- $10,628/yr
For passive investors: Depreciation is non-cash, so a rental often shows a tax loss while cash-flowing — sheltering income. Rental losses are passive: they offset passive income freely, and up to $25,000/yr can offset ordinary (W-2) income if you actively participate and your MAGI is under $100k (phasing out to $0 by $150k); unused losses carry forward. On sale, claimed depreciation is recaptured at up to 25%, and gains may owe capital-gains tax (a 1031 exchange can defer both). Figures are a year-1 estimate at your 24.0% rate — not tax advice; consult a CPA.
Condition & rehab AI · 13 photos
This move-in-ready manufactured home in Casa Del Sol East features updated interiors, a new roof, and fresh paint, making it an attractive option for both resale and rental.
Value-add opportunities
- Both Paint exterior — Enhances curb appeal and value
- Both Organize interior — Creates a more inviting and functional living space
Renovation cost estimate screening
Value-add ROI direction
- Both Paint exterior — Enhances curb appeal and value ↑
- Both Organize interior — Creates a more inviting and functional living space ↑
ⓘ Cost ranges are severity-bucket heuristics (US national rule-of-thumb). Get contractor quotes + a written scope before underwriting a rehab budget.
Schools (NCES district)
- District
- Peoria Unified School District (4237)
- NCES district ID
- 0406250
- Math proficiency
- 36% ▼ -14.00%
- Reading proficiency
- 42% ▼ -8.00%
- Median HH income
- $60,171
- Composite
- 34.62/100
- National rank
- #5152
- State rank
- #64 of 249 in AZ
Livability — Peoria
- Score
- 76/100
- State rank
- #14
- US rank
- #3603
Category grades
Schools grade is shown separately in the Schools card above.
Census & demographics
- Census place
- Peoria, AZ
- County
- Maricopa County · 4,537,380 people
- City population
- 206,687
- Metro
- Phoenix-Mesa-Chandler, AZ
- Population (ZIP)
- 60,918
- Household income
- $67,380
- Rent vs Own
- Severe rent burden
- 1879.0
Population outlook (Maricopa County) Hauer SSP2
- Today (2025)
- 4,979,203 people
- By 2030
- 5,378,229 · +8.0%
- By 2040
- 6,156,598 · +23.6%
- By 2050
- 6,872,376 · +38.0%
- By 2075
- 8,401,270 · +68.7%
- By 2100
- 9,247,439 · +85.7%
Race, ethnicity, and origin ACS 2023
- Neighborhood character
- Diverse neighborhood (Simpson 0.62)
- Race & ethnicity
- White 51% Hispanic / Latino 34% Two or more races 14% Black 5% Asian 4% Native American 2%
- Hispanic origin (detail)
- Mexican 29%
- Common ancestry
- Romanian 2% Italian 2% Slovak 1%
- Foreign-born
- 13% · Canada, Vietnam
- Languages at home
- 76% English-only · Spanish 18% Other Indo-European 1% Vietnamese 1%
Political lean MEDSL · Maricopa
- 2024 margin
- Toss-up / Even · D 47.7% · R 51.2% · Other 1.1%
- 2008→2024 swing
- +7.1pp toward D · 2008: -10.6pp · 2024: -3.5pp
- All cycles
- 2024: R+3.5 2020: D+2.2 2016: R+3.5 2012: R+12.0 2008: R+10.6
Not yet ingested
- Civics
- —
Market trends
- HPI YoY
- ▼ -80.77%
- Current HPI
- 328.1069
- Rent YoY
- ▲ 0.62%
- Metro
- Phoenix-Mesa-Chandler, AZ
- State GDP YoY
- ▲ 4.54%
- F500 in state
- 20
Industry mix (Fortune 500 HQ in AZ)
| Industry | F500 HQs | Revenue |
|---|---|---|
| Technology | 2 | $13B |
|
||
| Mining / Metals | 1 | $23B |
|
||
| Environmental Services | 1 | $16B |
|
||
| Metals / Steel | 1 | $14B |
|
||
| Technology Distribution | 1 | $9B |
|
||
| Homebuilding | 1 | $8B |
|
||
Price history
-45.9% since first listed7 events — show timeline
- 2026-03-29 Listed $78,500 ARMLS
- 2025-12-01 Listing Removed — ARMLS
- 2025-08-28 Price Changed $78,000 ARMLS
- 2025-07-15 Listed $80,000 ARMLS
- 2025-03-05 Listing Removed — ARMLS
- 2024-05-03 Price Changed $140,000 ARMLS
- 2024-03-13 Listed $145,000 ARMLS
Cash-flow waterfall
monthlySold comps — $/sqft
last 12 mo · ≤1 miLoading sold comps…