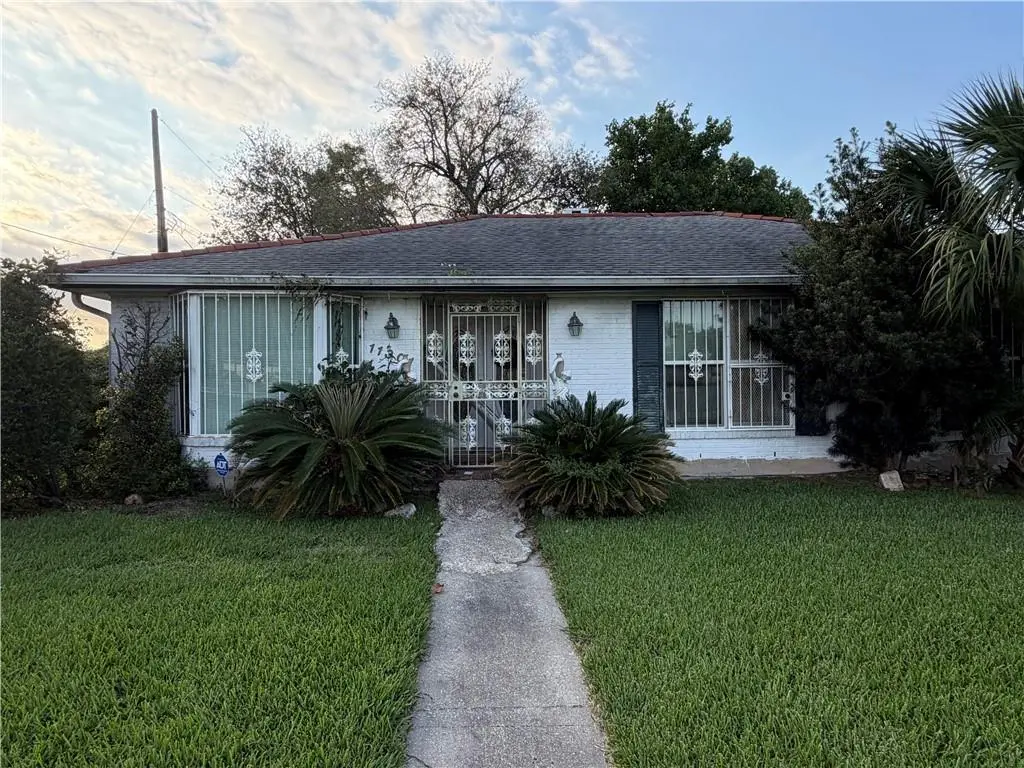
11301 Morrison Rd · New Orleans, LA
Flood risk 9/10 · Severe
- FEMA flood zone
- X (shaded)
- Chance of flooding over 30 yrs
- 0.6%
- Est. flood insurance / yr
- $507 – $1,088
Fire risk 1/10 · Minimal
- Est. fire insurance / yr
- $1,269 – $2,357
Heat risk 10/10 · Severe
- Hot days now (above 107°F)
- 7 days/yr
- Hot days in 30 yrs
- 21 days/yr
Wind risk 10/10 · Severe
- Chance of severe wind over 30 yrs
- 99.0%
Air-quality risk 3/10 · Minor
- Unhealthy air days now
- 3 days/yr
- Unhealthy air days in 30 yrs
- 3 days/yr
Risk factors via First Street. Map © Google.
Why this score? — see what drove the C+ grade
The composite is a weighted blend of 9 inputs, each scored 0–100. Each bar is that input's sub-score; the figure is the points it added to the 100-point composite (weight × sub-score).
- Cash flow +23.7/30.0
- ARV discount +15.0/15.0
- DSCR +7.6/10.0
- 1% rule +6.0/10.0
- Livability +4.0/5.0
- Rent growth +2.5/5.0
- Condition / age +2.5/5.0
- Schools +1.6/10.0
- Appreciation +0.0/10.0
$160,000
🖨 Deal sheet 📄 Offer letter ✓ Due diligence
Listing remarks MLS
Investor opportunity on a large corner lot! This spacious 4-bedroom home offers approximately 2,420 sq. ft. of living area on a generous 64 x 145 lot, approximately 9,344 sq. ft. The property needs work and is being sold strictly as-is, but offers strong potential for renovation, resale, rental, or owner-occupant improvement. One of the four bedrooms is unfinished and currently down to studs with an opening/hole in part of the wall. There is also a hallway ceiling repair needed. Utilities are currently not on, and seller will make no repairs. Sale is subject to bankruptcy court approval. With its size, layout, and large corner lot, this property is priced with condition in mind and could be a great opportunity for investors, contractors, or buyers looking for a project with upside potential.
Key facts
- Large corner lot
- Unfinished bedroom
- 9,038 sq ft lot
Tags
Property features AI
Exterior
- Parking: Garage; Off-street parking
- Utilities: Public water; Public sewer; Water heater (energy-efficient feature)
- Home design: Single-story; Brick construction; Shingle roof; Slab foundation; Corner city lot (approx. 64 x 146)
- Construction: Brick exterior; Shingle roof; Slab foundation; Year built not specified
- Exterior features: Fenced yard; Porch
Interior
- Kitchen: Cooktop
- Bathrooms: 2 full bathrooms; 1 half bathroom
- Heating & cooling: Has heating; Has cooling
- Interior features: Wood-burning fireplace; Total of 7 rooms; Average condition
Neighborhood map
What this means for you Summary
Snapshot
- This is a 4-bed/2.5-bath single-family listed at $160k.
Deal economics
- At list price, monthly cash flow is $238 ($3k/yr) — positive.
- The deal already cash-flows at list — no discount required.
- Meets the 1% rule at list price ($2k rent vs $160k).
- Recommended offer: $155k (3.0% below list) — sets the bar for market timing.
- Cap rate 8.6% vs local median 4.4% in New Orleans — top-decile yield for the area; either an underpriced asset or a hidden risk that comps aren't pricing in. Stress-test before assuming the spread holds.
Location & tenants
- Location reads 81/100 on livability (#3 in LA, #1,383 nationally) — a professional / high-income tenant draw. Strengths: amenities A+, commute A+, health & safety A+; Watch: crime C-, employment D.
- Orleans Parish (urban): math 11% / reading 27% proficiency, ranked #69 of 98 in LA (top 70%) — low school quality limits family demand, transient renter base, plan for 1-2y turnover; 68% free/reduced lunch — lower-income household profile, screen leases tightly.
- Market conditions: 105 active listings in the ZIP; 16 comparable units currently listed for rent nearby; rentals at typical pace (median 24d on market — plan ~3-4 weeks tenant-placement turnaround); 710 units permitted in Orleans Parish in 2024 (244 in 5+ unit buildings).
Forward outlook
- Local home prices are declining (-3.0%/yr); year-one equity from $1k of loan paydown is wiped out by about $5k of value loss. Plan a longer hold.
- Orleans County population projected at +61% by 2050 — long-run rental-demand tailwind backs the buy-and-hold thesis.
Negotiation context
- It's been on market 31 days — a 3% lower offer ($155k) is reasonable based on typical stale-listing flexibility.
- 2 sale attempts with the ask held roughly flat each time — persistent listings suggest the price (not the market) is what's stuck; bring a comps-based counter.
Risks & watch-outs
- Watch-outs: flood insurance adds $66/mo.
- Climate carrying-cost: severe flood risk; severe wind risk, 99% chance of damaging wind over 30y; extreme-heat days projected 7→21/yr by 2055 (HVAC capex compounding) — expect insurance premiums to compound above CPI over the hold.
Questions for the listing agent
- It's been on market 31 days. Have you received any prior offers? Is the seller open to a 3% concession, seller financing, or rate buy-down credit?
- Built in 1970 — when were the roof, HVAC, electrical panel, plumbing, and water heater last replaced?
- What's the actual annual flood-insurance premium (NFIP or private), and is the property in a SFHA with mandatory coverage?
- Is there a deadline driving the sale (1031 exchange, divorce, estate, relocation)? That informs how much negotiation room exists.
- What's the average days-on-market for RENTAL listings here right now (not sales)? A rising rental-DOM trend means longer vacancies and softer asking-rent achievability than the comps imply.
- What's the recent tenant-quality profile in this submarket — average credit score on applications, eviction rate, late-payment / NSF rate, and stable-employment percentage? A property-management company in the area should have these aggregated.
- How much new for-sale + rental construction is in the pipeline within 1–3 miles? Heavy new supply typically softens prices + rents 12–24 months out; constrained supply supports both.
Investment metrics
- 1% rule
- 1.10% ✓
- Cap rate
- 8.57%
- Cash-on-cash
- 8.14%
- DSCR
- 1.36
- GRM
- 7.6
CMA / ARV
- ARV (on-the-fly)
- $225,673
- Comps found
- 12
Show comp detail 12 sales within ~0.75 mi
| Address | Dist | Beds/Ba | Sqft | Sold | Price | $/sf | Match |
|---|---|---|---|---|---|---|---|
| 7140 Camberley Dr | 0.30mi | 3/2.0 (-1) | 2,200 (+0%) | 2mo | $315,000 | $143 | 76 |
| 10800 Guildford Rd | 0.36mi | 4/2.5 | 2,281 (+4%) | 4mo | $270,000 | $118 | 73 |
| 11100 Whiteside Rd | 0.14mi | 3/2.0 (-1) | 2,400 (+10%) | 2mo | $77,000 | $32 | 69 |
| 7230 Bullard Ave | 0.44mi | 4/2.5 | 2,100 (-4%) | 8mo | $297,000 | $141 | 66 |
| 6916 Camberley St | 0.40mi | 3/2.0 (-1) | 2,181 (-0%) | 13mo | $175,000 | $80 | 63 |
| 7300 Briarheath Dr | 0.48mi | 4/2.5 | 2,353 (+7%) | 3mo | $247,500 | $105 | 63 |
| 7646 Lafourche St | 0.33mi | 3/2.0 (-1) | 2,088 (-5%) | 10mo | $215,000 | $103 | 61 |
| 10331 Brookfield Dr | 0.50mi | 3/2.5 (-1) | 2,100 (-4%) | 6mo | $215,000 | $102 | 60 |
| 11206 Curran Blvd | 0.21mi | 4/2.5 | 2,500 (+14%) | 12mo | $200,000 | $80 | 57 |
| 10140 Chevy Chase Dr | 0.59mi | 4/3.0 | 2,250 (+3%) | 14mo | $285,000 | $127 | 55 |
| 7645 Lady Gray St | 0.35mi | 3/2.0 (-1) | 1,957 (-11%) | 11mo | $131,200 | $67 | 50 |
| 7470 Briarheath Dr | 0.60mi | 4/2.0 | 2,376 (+8%) | 11mo | $245,000 | $103 | 47 |
Match score weights: distance 35% · size 25% · config 20% · recency 20%. Top-matched comps best support the ARV.
Projected returns pro-forma
-3.0% appreciation · 3.0% rent growth · sell at horizon
- IRR
- -6.5%
- Equity multiple
- 0.76×
- Total profit
- $-10,741
- Equity at exit
- $23,857
- IRR
- 3.2%
- Equity multiple
- 1.23×
- Total profit
- $10,347
- Equity at exit
- $13,834
Cash invested: $44,800 (down + closing). Projections, not guarantees.
Landlord ↔ Tenant lean methodology
- Overall (STATE)
- 90 Strongly Landlord-Friendly
- State Louisiana
- 90 Strongly Landlord-Friendly · R+12
- County
- — inherits STATE
- City
- — inherits STATE
ZIP-level market 70128
- Home prices YoY
- -5.9%
- Active inventory
- 105
- Price-to-rent
- 7.6×
Monthly cashflow live
- Estimated rent
- $1,755 high interval (Pro) →
- Mortgage (P&I)
- −$839
- Tax from tax record
- −$177 /mo · $2,119/yr
- Insurance
- −$67
- Flood insurance flood zone
- −$66 /mo · $798/yr
- HOA
- −$0
- Vacancy / Maint / Mgmt
- −$369
- Net cashflow
- $238
Break-even live
UW: 25.0% down · 7.5% · 30yr · 1.5% tax · 5.0% vac · 8.0% maint · 8.0% mgmt
Financing live
Cash to close
- Down payment
- $40,000
- Closing costs
- $4,800
- Reserves months
- —
- Total cash needed
- —
Loan-product check · same deal, 3 products live
Conventional
25% down · 7.5% · 30yr
- Down + closing
- —
- Monthly P&I
- —
- Monthly cashflow
- —
- DSCR
- —
- Eligible?
- —
Personal DTI + credit; lowest rate.
DSCR
20% down · 8.5% · 30yr
- Down + closing
- —
- Monthly P&I
- —
- Monthly cashflow
- —
- DSCR
- —
- Eligible?
- —
No personal income docs; deal must DSCR.
Hard money
10% down · 12.0% · 12mo
- Down + closing
- —
- Monthly P&I
- —
- Monthly cashflow
- —
- DSCR
- —
- Eligible?
- —
Short-term bridge; refi at stabilization.
Rent comps 16 comps
| Address | Beds | Baths | Sqft | Rent | $/sqft | DOM | Units | Dist |
|---|---|---|---|---|---|---|---|---|
| 10951 Roger Dr Unit B New Orleans, LA | 3.0 | 2.5 | 2048 | $1,850 | $0.90 | 23d | 1 | 0.38mi |
| 7500 Symmes Ave New Orleans, LA | 4.0 | 2.0 | 1400 | $2,100 | $1.50 | 23d | 1 | 0.77mi |
| 5754 Louis Prima Dr E New Orleans, LA | 3.0 | 2.5 | 2069 | $2,195 | $1.06 | 23d | 1 | 0.99mi |
| 7201 Salem Dr New Orleans, LA | 3.0 | 2.5 | 1764 | $1,650 | $0.94 | 23d | 1 | 1.28mi |
| 6972 Bundy Rd New Orleans, LA | 3.0 | 2.5 | 2048 | $1,500 | $0.73 | 23d | 1 | 1.30mi |
| 7202 Salem Dr New Orleans, LA | 3.0 | 2.5 | 1995 | $1,750 | $0.88 | 23d | 1 | 1.31mi |
| 8936 Curran Blvd New Orleans, LA | 3.0 | 2.0 | 2050 | $1,575 | $0.77 | 21d | 1 | 1.32mi |
| 6951 Salem Dr New Orleans, LA | 3.0 | 2.5 | 1900 | $1,875 | $0.99 | 23d | 1 | 1.33mi |
| 7063 Boston Dr New Orleans, LA | 4.0 | 2.5 | 1750 | $1,900 | $1.09 | 16d | 1 | 1.36mi |
| 9042 Bunker Hill Rd New Orleans, LA | 3.0 | 1.5 | 1400 | $1,450 | $1.04 | 16d | 1 | 1.37mi |
| 9040 Bunker Hill Rd New Orleans, LA | 3.0 | 1.5 | 1400 | $1,450 | $1.04 | 16d | 1 | 1.37mi |
| 9022 Bunker Hill Rd New Orleans, LA | 3.0 | 1.5 | 1400 | $1,400 | $1.00 | 23d | 1 | 1.39mi |
| 9020 Bunker Hill Rd New Orleans, LA | 3.0 | 1.5 | 1400 | $1,400 | $1.00 | 23d | 1 | 1.39mi |
| 7230 Yorktown Dr New Orleans, LA | 3.0 | 2.0 | 1550 | $1,600 | $1.03 | 23d | 1 | 1.41mi |
| 7230 Yorktown Dr New Orleans, LA | 3.0 | 2.0 | 1550 | $1,600 | $1.03 | 16d | 1 | 1.41mi |
| 7501 Briarwood Dr New Orleans, LA | 3.0 | 2.0 | 1500 | $1,850 | $1.23 | 23d | 1 | 1.49mi |
Listing history 16 events
-
2026-06-18days on market $160,000 Active 31 DOM
-
2026-06-17days on market $160,000 Active 30 DOM
-
2026-06-16days on market $160,000 Active 29 DOM
-
2026-06-15days on market $160,000 Active 28 DOM
-
2026-06-13days on market $160,000 Active 26 DOM
-
2026-06-10days on market $160,000 Active 23 DOM
-
2026-06-09days on market $160,000 Active 22 DOM
-
2026-06-08days on market $160,000 Active 21 DOM
-
2026-06-07days on market $160,000 Active 20 DOM
-
2026-06-05days on market $160,000 Active 17 DOM
-
2026-06-03days on market $160,000 Active 16 DOM
-
2026-06-02days on market $160,000 Active 15 DOM
-
2026-06-01days on market $160,000 Active 14 DOM
-
2026-05-31days on market $160,000 Active 13 DOM
-
2026-05-18$160,000 Active
Show marketing remark (802 chars)
Investor opportunity on a large corner lot! This spacious 4-bedroom home offers approximately 2,420 sq. ft. of living area on a generous 64 x 145 lot, approximately 9,344 sq. ft. The property needs work and is being sold strictly as-is, but offers strong potential for renovation, resale, rental, or owner-occupant improvement. One of the four bedrooms is unfinished and currently down to studs with an opening/hole in part of the wall. There is also a hallway ceiling repair needed. Utilities are currently not on, and seller will make no repairs. Sale is subject to bankruptcy court approval. With its size, layout, and large corner lot, this property is priced with condition in mind and could be a great opportunity for investors, contractors, or buyers looking for a project with upside potential.
-
2026-05-18$160,000 Active 802-char remark
Show marketing remark (802 chars)
Investor opportunity on a large corner lot! This spacious 4-bedroom home offers approximately 2,420 sq. ft. of living area on a generous 64 x 145 lot, approximately 9,344 sq. ft. The property needs work and is being sold strictly as-is, but offers strong potential for renovation, resale, rental, or owner-occupant improvement. One of the four bedrooms is unfinished and currently down to studs with an opening/hole in part of the wall. There is also a hallway ceiling repair needed. Utilities are currently not on, and seller will make no repairs. Sale is subject to bankruptcy court approval. With its size, layout, and large corner lot, this property is priced with condition in mind and could be a great opportunity for investors, contractors, or buyers looking for a project with upside potential.
ⓘ Source: listings_history table (triggers on properties + properties_extension) + one-shot
backfill from property_details.listing_events for pre-trigger history.
Tax reassessment forecast LA · Resets to sale price
- Current annual tax
- $2,119 · $177/mo
- Projected year-2 tax
- $2,119 · $177/mo
- Expected delta
- $0/yr ($0/mo · 0.0%)
ⓘ Screening estimate from a state-policy table — verify with the county assessor before closing.
Climate risk First Street
- Flood 9/10 Extreme FEMA zone X (shaded) · 60% chance over 30 yrs
- Wildfire 1/10 Low
- Heat 10/10 Extreme 7 d/yr ≥107°F today · 21 d/yr by 30 yrs out
- Wind 10/10 Extreme 99% chance of damaging wind over 30 yrs
- Air quality 3/10 Moderate 3 unhealthy d/yr today · 3 by 30 yrs out
Nearby sold comps map
Loading sold comps map…
Walkable amenities ~0.75 mi
Loading nearby amenities…
Taxation est. · year 1
- Rental income
- $21,059
- − Mortgage interest
- −$8,962
- − Property taxes
- −$2,119
- − Insurance
- −$1,598
- − Repairs & maintenance
- −$1,685
- − Management
- −$1,685
- − Depreciation
- −$4,655
- Taxable income
- $356
- Est. tax owed @ 24.0%
- −$85
- After-tax cash flow
- $2,766/yr
For passive investors: Depreciation is non-cash, so a rental often shows a tax loss while cash-flowing — sheltering income. Rental losses are passive: they offset passive income freely, and up to $25,000/yr can offset ordinary (W-2) income if you actively participate and your MAGI is under $100k (phasing out to $0 by $150k); unused losses carry forward. On sale, claimed depreciation is recaptured at up to 25%, and gains may owe capital-gains tax (a 1031 exchange can defer both). Figures are a year-1 estimate at your 24.0% rate — not tax advice; consult a CPA.
Schools (NCES district)
- District
- Orleans Parish
- NCES district ID
- 2201170
- Math proficiency
- 11% ▼ -52.00%
- Reading proficiency
- 27% ▼ -46.00%
- Median HH income
- $37,011
- Composite
- 15.78/100
- National rank
- #9271
- State rank
- #69 of 98 in LA
Livability — New Orleans
- Score
- 81/100
- State rank
- #3
- US rank
- #1383
Category grades
Schools grade is shown separately in the Schools card above.
Census & demographics
- Census place
- New Orleans, LA
- City population
- 338,817
- Population (ZIP)
- 22,973
Population outlook (Orleans County) Hauer SSP2
- Today (2025)
- 513,025 people
- By 2030
- 575,781 · +12.2%
- By 2040
- 700,174 · +36.5%
- By 2050
- 826,541 · +61.1%
- By 2075
- 1,123,374 · +119.0%
- By 2100
- 1,355,609 · +164.2%
Race, ethnicity, and origin ACS 2023
- Neighborhood character
- Predominantly Black (86%)
- Race & ethnicity
- Black 86% Asian 5% White 4% Two or more races 3%
- Foreign-born
- 4% · Vietnam, Canada
- Languages at home
- 95% English-only · Vietnamese 4% Spanish 1%
Political lean MEDSL · Orleans
- 2024 margin
- Solid D (+67.0) · D 82.2% · R 15.2% · Other 2.7%
- 2008→2024 swing
- +6.7pp toward D · 2008: 60.3pp · 2024: 67.0pp
- All cycles
- 2024: D+67.0 2020: D+68.2 2016: D+66.2 2012: D+62.5 2008: D+60.3
Not yet ingested
- Civics
- —
Market trends
- HPI YoY
- ▼ -15.51%
- Current HPI
- 247.7131
- Rent YoY
- —
- Metro
- —
- State GDP YoY
- ▲ 3.29%
- F500 in state
- 10
Industry mix (Fortune 500 HQ in LA)
| Industry | F500 HQs | Revenue |
|---|---|---|
| Telecommunications | 2 | $23B |
|
||
| Utilities | 1 | $12B |
|
||
| Wholesale / Distribution | 1 | $5B |
|
||
| Advertising | 1 | $2B |
|
||
Price history
+0.0% since first listed2 events — show timeline
- 2026-05-18 Listed $160,000 AcadianaMLS
- 2026-05-18 Listed $160,000 GSREIN
Property tax history
+15.5%/yrLatest (2026): $2,119 · +505.0% YoY. Source: county tax records.
Cash-flow waterfall
monthlySold comps — $/sqft
last 12 mo · ≤1 miLoading sold comps…