545 Pennsylvania St · Gary, IN
Flood risk 1/10 · Minimal
- FEMA flood zone
- X (unshaded)
- Chance of flooding over 30 yrs
- 0.0%
- Est. flood insurance / yr
- $473 – $860
Fire risk 8/10 · Major
- Est. fire insurance / yr
- $717 – $1,331
Heat risk 3/10 · Minor
- Hot days now (above 102°F)
- 7 days/yr
- Hot days in 30 yrs
- 15 days/yr
Wind risk 2/10 · Minimal
- Chance of severe wind over 30 yrs
- 0.0%
Air-quality risk 4/10 · Minor
- Unhealthy air days now
- 6 days/yr
- Unhealthy air days in 30 yrs
- 7 days/yr
Risk factors via First Street. Map © Google.
Why this score? — see what drove the C+ grade
The composite is a weighted blend of 9 inputs, each scored 0–100. Each bar is that input's sub-score; the figure is the points it added to the 100-point composite (weight × sub-score).
- Cash flow +30.0/30.0
- 1% rule +10.0/10.0
- DSCR +10.0/10.0
- Livability +3.7/5.0
- Rent growth +2.5/5.0
- Condition / age +2.5/5.0
- Appreciation +1.4/10.0
- Schools +0.5/10.0
- ARV discount +0.0/15.0
$69,900
🖨 Deal sheet 📄 Offer letter ✓ Due diligence
Listing remarks MLS
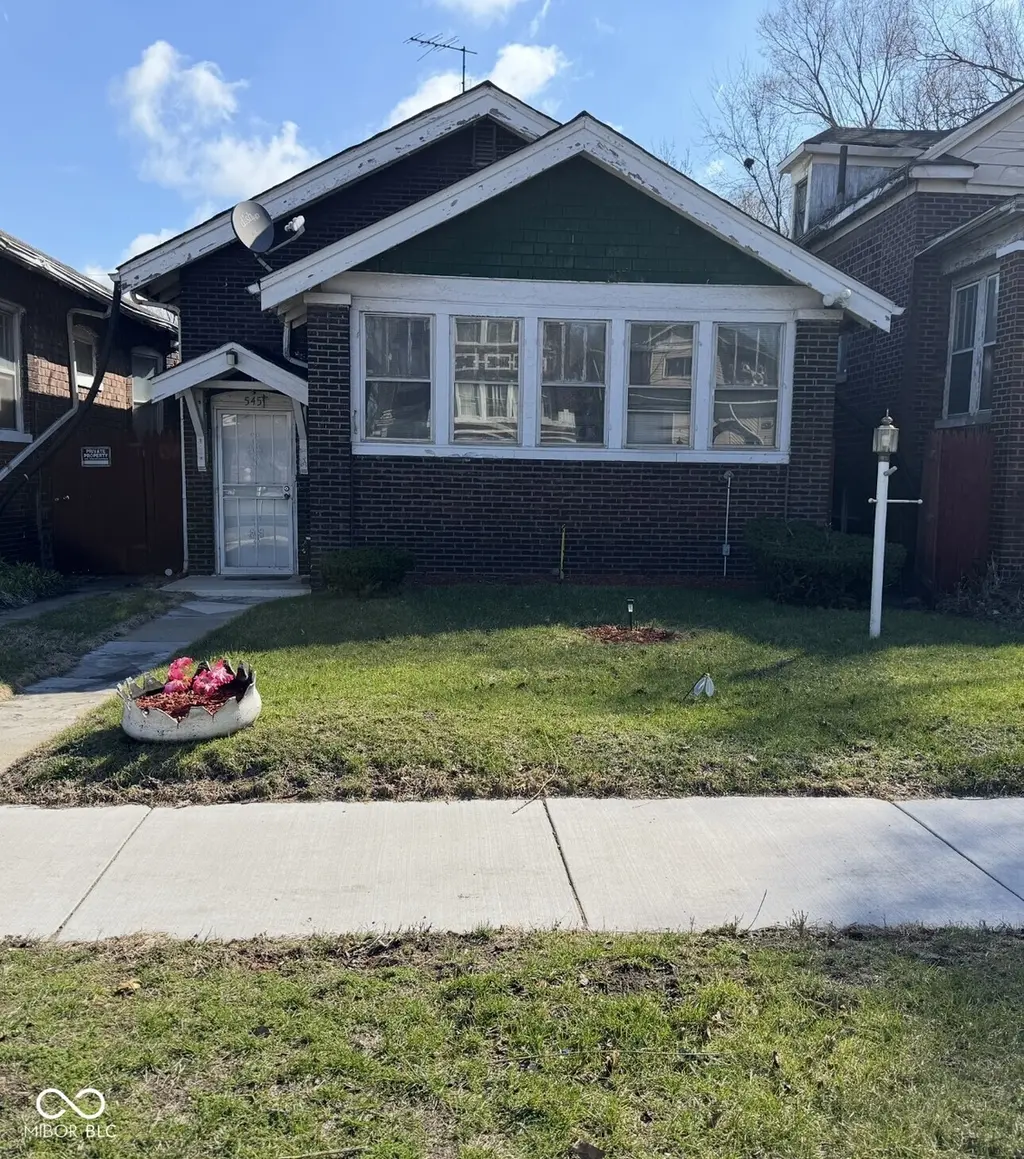
Great opportunity in a convenient urban location! This bungalow-style home features classic brick siding and a welcoming front yard, offering both charm and functionality. Inside, you'll find 3 bedrooms along with a walkout basement that adds additional space and potential. Ideally located close to downtown and major expressways, this property provides easy access to shopping, dining, and commuting routes. The home is currently tenant-occupied on a month-to-month lease, offering flexibility for both investors and future homeowners. Don't miss this opportunity to own a property with character, convenience, and potential!
Key facts
- Brick siding
- Walkout basement
- Front yard
Tags
Neighborhood map
What this means for you Summary
Snapshot
- This is a 3-bed/1.0-bath single-family listed at $70k.
Deal economics
- At list price, monthly cash flow is $497 ($6k/yr) — positive.
- The deal already cash-flows at list — no discount required.
- Meets the 1% rule at list price ($1k rent vs $70k).
- Recommended offer: $66k (6.0% below list) — sets the bar for market timing.
- Cap rate 14.8% vs local median 9.1% in Gary — top-decile yield for the area; either an underpriced asset or a hidden risk that comps aren't pricing in. Stress-test before assuming the spread holds.
Location & tenants
- Location reads 73/100 on livability (#105 in IN) — a middle-class / working-renter tenant base. Strengths: commute A+, cost of living A+, housing A+; Watch: schools F, crime F, employment F.
- Gary Community School Corporation (urban): math 3% / reading 11% proficiency, ranked #299 of 301 in IN (top 99%) — low school quality limits family demand, transient renter base, plan for 1-2y turnover; 80% free/reduced lunch — lower-income household profile, screen leases tightly.
- Market conditions: 46 active listings in the ZIP; 15 comparable units currently listed for rent nearby; rentals at typical pace (median 17d on market — plan ~3-4 weeks tenant-placement turnaround); lower-income renter base — watch delinquency; 1,642 units permitted in Lake County in 2024 (14 in 5+ unit buildings).
- This rent runs 45% of the median local income ($34k/yr) — at the standard rent-burdened threshold; future hikes will face affordability resistance.
Forward outlook
- Local home prices are declining (-3.0%/yr); year-one equity from $483 of loan paydown is wiped out by about $2k of value loss. Plan a longer hold.
- Lake County population projected to shrink 7% by 2050 — rents likely to lag national; underwrite the cash flow, not the appreciation.
- At projected returns (-3.0% appreciation + 3.0% rent growth), your $20k cash investment doubles in ~4 years — after that, you're playing with house money.
Negotiation context
- It's been on market 79 days — a 6% lower offer ($66k) is reasonable based on typical stale-listing flexibility.
- 2 sale attempts since 18y ago with the ask held roughly flat each time — persistent listings suggest the price (not the market) is what's stuck; bring a comps-based counter.
Risks & watch-outs
- Watch-outs: built in 1920 — expect roof / HVAC / electrical / plumbing capex.
- Climate carrying-cost: severe wildfire risk — expect insurance premiums to compound above CPI over the hold.
Questions for the listing agent
- It's been on market 79 days. Have you received any prior offers? Is the seller open to a 6% concession, seller financing, or rate buy-down credit?
- Built in 1920 — when were the roof, HVAC, electrical panel, plumbing, and water heater last replaced?
- Why hasn't it sold? Are there any deal-killer items the seller is aware of (foundation, flood, title, zoning, code violations)?
- Is there a deadline driving the sale (1031 exchange, divorce, estate, relocation)? That informs how much negotiation room exists.
- Schools are F-rated, which usually means shorter tenancies and higher turnover. Who's the typical renter profile here, and what's been the actual vacancy rate?
- Crime grade is F in this area — have there been break-ins, vandalism, or insurance claims at this property in the last 3 years? What carrier currently insures it and at what premium?
- What's the average days-on-market for RENTAL listings here right now (not sales)? A rising rental-DOM trend means longer vacancies and softer asking-rent achievability than the comps imply.
- What's the recent tenant-quality profile in this submarket — average credit score on applications, eviction rate, late-payment / NSF rate, and stable-employment percentage? A property-management company in the area should have these aggregated.
- How much new for-sale + rental construction is in the pipeline within 1–3 miles? Heavy new supply typically softens prices + rents 12–24 months out; constrained supply supports both.
Investment metrics
- 1% rule
- 1.78% ✓
- Cap rate
- 14.83%
- Cash-on-cash
- 30.48%
- DSCR
- 2.36
- GRM
- 4.7
CMA / ARV
- ARV (median comp)
- $53,449
- List price
- $69,900
- Delta
- 30.78%
- Verdict
- OVERPRICED
- Comps
- 20 within 1.0 mi
Show comp detail 5 sales within ~0.75 mi
| Address | Dist | Beds/Ba | Sqft | Sold | Price | $/sf | Match |
|---|---|---|---|---|---|---|---|
| 655 Vermont St | 0.47mi | 3/1.0 | 1,080 (+5%) | 13mo | $36,500 | $34 | 58 |
| 1151 Delaware St | 0.73mi | 3/1.0 | 1,057 (+3%) | 9mo | $34,500 | $33 | 53 |
| 607 Jefferson St | 0.39mi | 2/1.5 (-1) | 966 (-6%) | 16mo | $73,750 | $76 | 52 |
| 647 Vermont St | 0.47mi | 2/1.0 (-1) | 1,100 (+7%) | 13mo | $36,500 | $33 | 50 |
| 271 Van Buren St | 0.74mi | 3/2.0 | 925 (-10%) | 15mo | $108,000 | $117 | 33 |
Match score weights: distance 35% · size 25% · config 20% · recency 20%. Top-matched comps best support the ARV.
Projected returns pro-forma
-3.0% appreciation · 3.0% rent growth · sell at horizon
- IRR
- 25.2%
- Equity multiple
- 2.04×
- Total profit
- $20,357
- Equity at exit
- $10,422
- IRR
- 32.9%
- Equity multiple
- 3.99×
- Total profit
- $58,581
- Equity at exit
- $6,044
Cash invested: $19,572 (down + closing). Projections, not guarantees.
Landlord ↔ Tenant lean methodology
- Overall (STATE)
- 90 Strongly Landlord-Friendly
- State Indiana
- 90 Strongly Landlord-Friendly · R+11
- County
- — inherits STATE
- City
- — inherits STATE
ZIP-level market 46402
- Home prices YoY
- -2.8%
- Active inventory
- 46
- Price-to-rent
- 4.7×
Monthly cashflow live
- Estimated rent
- $1,244 high interval (Pro) →
- Mortgage (P&I)
- −$367
- Tax from tax record
- −$90 /mo · $1,079/yr
- Insurance
- −$29
- HOA
- −$0
- Vacancy / Maint / Mgmt
- −$261
- Net cashflow
- $497
Break-even live
UW: 25.0% down · 7.5% · 30yr · 1.5% tax · 5.0% vac · 8.0% maint · 8.0% mgmt
Financing live
Cash to close
- Down payment
- $17,475
- Closing costs
- $2,097
- Reserves months
- —
- Total cash needed
- —
Loan-product check · same deal, 3 products live
Conventional
25% down · 7.5% · 30yr
- Down + closing
- —
- Monthly P&I
- —
- Monthly cashflow
- —
- DSCR
- —
- Eligible?
- —
Personal DTI + credit; lowest rate.
DSCR
20% down · 8.5% · 30yr
- Down + closing
- —
- Monthly P&I
- —
- Monthly cashflow
- —
- DSCR
- —
- Eligible?
- —
No personal income docs; deal must DSCR.
Hard money
10% down · 12.0% · 12mo
- Down + closing
- —
- Monthly P&I
- —
- Monthly cashflow
- —
- DSCR
- —
- Eligible?
- —
Short-term bridge; refi at stabilization.
Rent comps 15 comps
| Address | Beds | Baths | Sqft | Rent | $/sqft | DOM | Units | Dist |
|---|---|---|---|---|---|---|---|---|
| 672 Connecticut St Apt 1S Gary, IN | 3.0 | 1.0 | 1247 | $875 | $0.70 | 15d | 1 | 0.19mi |
| 501 Madison St Gary, IN | 1.0–4.0 | 1.0 | 883 | $1,362 | $1.54 | 1d | 11 | 0.46mi |
| 1030 E 6th Ave Gary, IN | 3.0 | 1.5 | 1400 | $1,600 | $1.14 | 1d | 1 | 0.49mi |
| 844 Tennessee St Gary, IN | 3.0 | 1.5 | 1000 | $1,500 | $1.50 | 43d | 1 | 0.66mi |
| 1316 Delaware St Unit 2 Gary, IN | 2.0 | 1.0 | 700 | $950 | $1.36 | 20d | 1 | 0.79mi |
| 1329 Delaware St Gary, IN | 2.0 | 1.0 | 1100 | $1,100 | $1.00 | 43d | 1 | 0.81mi |
| 411 Pierce St Gary, IN | 3.0 | 1.0 | 874 | $1,395 | $1.60 | 22d | 1 | 0.99mi |
| 1572 Polk St Gary, IN | 3.0 | 1.0 | 1500 | $1,250 | $0.83 | 1d | 1 | 1.31mi |
| 1521 Pierce St Unit 1 Gary, IN | 2.0 | 1.0 | 800 | $850 | $1.06 | 1d | 1 | 1.34mi |
| 2022 Massachusetts St Gary, IN | 2.0 | 1.0 | 965 | $1,000 | $1.04 | 1d | 1 | 1.34mi |
| 317 Garfield St Gary, IN | 3.0 | 1.0 | 936 | $1,495 | $1.60 | 43d | 1 | 1.38mi |
| 840 W 19th Ave Gary, IN | 2.0 | 1.0 | 1035 | $1,150 | $1.11 | 19d | 1 | 1.38mi |
| 2061 Maryland St Gary, IN | 2.0 | 1.0 | 975 | $950 | $0.97 | 43d | 1 | 1.39mi |
| 1843 Illinois St Gary, IN | 2.0 | 1.0 | 725 | $1,200 | $1.66 | 16d | 1 | 1.45mi |
| 358 Arthur St Unit 2 Gary, IN | 2.0 | 1.0 | 800 | $1,250 | $1.56 | 1d | 1 | 1.46mi |
Listing history 17 events
-
2026-06-18days on market $69,900 Active 79 DOM
-
2026-06-17days on market $69,900 Active 78 DOM
-
2026-06-16days on market $69,900 Active 77 DOM
-
2026-06-15days on market $69,900 Active 76 DOM
-
2026-06-13days on market $69,900 Active 74 DOM
-
2026-06-13days on market $69,900 Active 73 DOM
-
2026-06-09days on market $69,900 Active 70 DOM
-
2026-06-08days on market $69,900 Active 69 DOM
-
2026-06-07days on market $69,900 Active 68 DOM
-
2026-06-04days on market $69,900 Active 65 DOM
-
2026-06-03days on market $69,900 Active 64 DOM
-
2026-06-02days on market $69,900 Active 63 DOM
-
2026-06-01days on market $69,900 Active 62 DOM
-
2026-05-31days on market $69,900 Active 61 DOM
-
2026-03-31$69,900 Active 629-char remark
Show marketing remark (629 chars)
Great opportunity in a convenient urban location! This bungalow-style home features classic brick siding and a welcoming front yard, offering both charm and functionality. Inside, you'll find 3 bedrooms along with a walkout basement that adds additional space and potential. Ideally located close to downtown and major expressways, this property provides easy access to shopping, dining, and commuting routes. The home is currently tenant-occupied on a month-to-month lease, offering flexibility for both investors and future homeowners. Don't miss this opportunity to own a property with character, convenience, and potential!
-
2008-08-31historical
-
2008-04-17$55,000
ⓘ Source: listings_history table (triggers on properties + properties_extension) + one-shot
backfill from property_details.listing_events for pre-trigger history.
Tax reassessment forecast IN · Partial reset (capped growth)
- Current annual tax
- $1,079 · $90/mo
- Projected year-2 tax
- $1,079 · $90/mo
- Expected delta
- $0/yr ($0/mo · 0.0%)
ⓘ Screening estimate from a state-policy table — verify with the county assessor before closing.
Climate risk First Street
- Flood 1/10 Low FEMA zone X (unshaded) · 0% chance over 30 yrs
- Wildfire 8/10 Severe
- Heat 3/10 Moderate 7 d/yr ≥102°F today · 15 d/yr by 30 yrs out
- Wind 2/10 Low 0% chance of damaging wind over 30 yrs
- Air quality 4/10 Moderate 6 unhealthy d/yr today · 7 by 30 yrs out
Nearby sold comps map
Loading sold comps map…
Walkable amenities ~0.75 mi
Loading nearby amenities…
Taxation est. · year 1
- Rental income
- $14,927
- − Mortgage interest
- −$3,915
- − Property taxes
- −$1,079
- − Insurance
- −$350
- − Repairs & maintenance
- −$1,194
- − Management
- −$1,194
- − Depreciation
- −$2,033
- Taxable income
- $5,162
- Est. tax owed @ 24.0%
- −$1,239
- After-tax cash flow
- $4,727/yr
For passive investors: Depreciation is non-cash, so a rental often shows a tax loss while cash-flowing — sheltering income. Rental losses are passive: they offset passive income freely, and up to $25,000/yr can offset ordinary (W-2) income if you actively participate and your MAGI is under $100k (phasing out to $0 by $150k); unused losses carry forward. On sale, claimed depreciation is recaptured at up to 25%, and gains may owe capital-gains tax (a 1031 exchange can defer both). Figures are a year-1 estimate at your 24.0% rate — not tax advice; consult a CPA.
Schools (NCES district)
- District
- Gary Community School Corporation
- NCES district ID
- 1803870
- Math proficiency
- 3% ▼ -10.00%
- Reading proficiency
- 11% ▼ -6.00%
- Median HH income
- $27,739
- Composite
- 4.98/100
- National rank
- #10039
- State rank
- #299 of 301 in IN
Livability — Gary
- Score
- 73/100
- State rank
- #105
- US rank
- #5592
Category grades
Schools grade is shown separately in the Schools card above.
Census & demographics
- Census place
- Gary, IN
- County
- Lake County · 422,878 people
- City population
- 63,701
- Metro
- Chicago-Naperville-Elgin, IL-IN-WI
- Population (ZIP)
- 5,836
- Household income
- $33,529
- Rent vs Own
- Severe rent burden
- 336.0
Population outlook (Lake County) Hauer SSP2
- Today (2025)
- 484,026 people
- By 2030
- 478,091 · -1.2%
- By 2040
- 462,974 · -4.3%
- By 2050
- 449,894 · -7.1%
- By 2075
- 436,169 · -9.9%
- By 2100
- 426,607 · -11.9%
Race, ethnicity, and origin ACS 2023
- Neighborhood character
- Predominantly Black (87%)
- Race & ethnicity
- Black 87% Two or more races 5% White 5% Hispanic / Latino 4%
- Common ancestry
- Romanian 1% Ukrainian 1%
- Foreign-born
- 1% · Canada
- Languages at home
- 98% English-only · Spanish 1% Arabic 1%
Political lean MEDSL · Lake
- 2024 margin
- Lean D (+5.6) · D 52.1% · R 46.5% · Other 1.5%
- 2008→2024 swing
- -28.6pp toward R · 2008: 34.3pp · 2024: 5.6pp
- All cycles
- 2024: D+5.6 2020: D+15.1 2016: D+20.6 2012: D+31.0 2008: D+34.3
Not yet ingested
- Civics
- —
Market trends
- HPI YoY
- ▼ -7.21%
- Current HPI
- 250.2464
- Rent YoY
- —
- Metro
- Chicago-Naperville-Elgin, IL-IN-WI
- State GDP YoY
- ▲ 2.90%
- F500 in state
- 18
Industry mix (Fortune 500 HQ in IN)
| Industry | F500 HQs | Revenue |
|---|---|---|
| Industrial Machinery | 2 | $37B |
|
||
| Healthcare | 1 | $177B |
|
||
| Pharmaceuticals | 1 | $45B |
|
||
| Metals / Steel | 1 | $18B |
|
||
| Agriculture | 1 | $17B |
|
||
| Packaging | 1 | $12B |
|
||
Price history
+27.1% since first listed3 events — show timeline
- 2026-03-31 Listed $69,900 MIBOR as Distributed by MLS Grid
- 2008-08-31 Listing Removed — NIRA MLS as Distributed by MLS Grid
- 2008-04-17 Listed $55,000 NIRA MLS as Distributed by MLS Grid
Property tax history
-10.3%/yrLatest (2024): $1,079 · +4.3% YoY. Source: county tax records.
Cash-flow waterfall
monthlySold comps — $/sqft
last 12 mo · ≤1 miLoading sold comps…