760 Sextant Dr #1083 · Sanibel, FL
Flood risk 9/10 · Severe
- FEMA flood zone
- AE
- Chance of flooding over 30 yrs
- 0.99%
- Est. flood insurance / yr
- $1,737 – $8,500
Fire risk 1/10 · Minimal
- Est. fire insurance / yr
- $947 – $1,759
Heat risk 10/10 · Severe
- Hot days now (above 113°F)
- 7 days/yr
- Hot days in 30 yrs
- 25 days/yr
Wind risk 10/10 · Severe
- Chance of severe wind over 30 yrs
- 99.0%
Air-quality risk 2/10 · Minimal
- Unhealthy air days now
- 1 days/yr
- Unhealthy air days in 30 yrs
- 1 days/yr
Risk factors via First Street. Map © Google.
Why this score? — see what drove the B- grade
The composite is a weighted blend of 9 inputs, each scored 0–100. Each bar is that input's sub-score; the figure is the points it added to the 100-point composite (weight × sub-score).
- Cash flow +30.0/30.0
- 1% rule +10.0/10.0
- DSCR +10.0/10.0
- ARV discount +7.5/15.0
- Schools +4.1/10.0
- Livability +3.4/5.0
- Rent growth +2.5/5.0
- Condition / age +2.5/5.0
- Appreciation +0.0/10.0
$549,000
🖨 Deal sheet (PDF) 📄 Offer letter ✓ Due diligence
Listing remarks
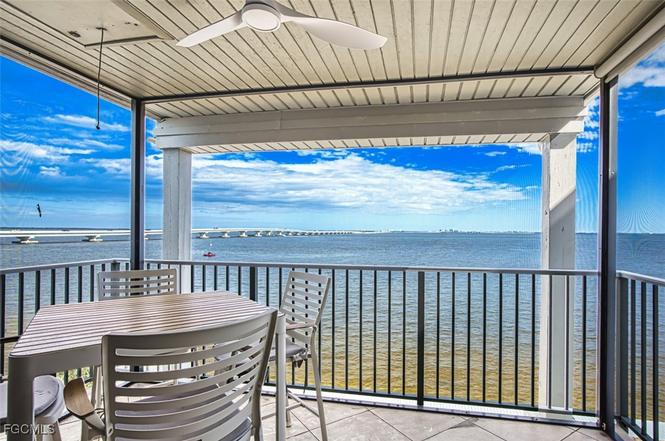
Nature’s stage is set for Dolphins jumping, Manatees floating and Pelicans diving headfirst into the water - just a few of the daily events you will witness from this bay front condo. The views offer an ever-changing, stunning backdrop from the screened lanai, living / dining area, kitchen, and primary in-suite. Located on the 3rd floor, this condo offers you vaulted ceilings – so no one is directly above and you experience the additional volume increasing the overall sense of space. Renovations with neutral, coastal updates have taken place over the past few years, making everything fresh and current. Upgrades include all wood kitchen cabinets, quartz counter tops, a breakfast
Key facts
- Bay front condo
- Screened lanai
- Vaulted ceilings
Tags
Property features AI
Finance
- Other: Pets allowed conditionally (call); maximum 2 pets, max weight 25 lbs
- Financial info: Community of approximately 100 units
- HOA & community: Homeowners association with quarterly fee; Association covers management, insurance, irrigation water, legal/accounting, grounds maintenance, pest control, recreation facilities, reserve fund, road maintenance, sewer, street lights, security, trash and water; Association amenities include pool, tennis, pickleball, shuffleboard, clubhouse, beach access/rights, boat dock/slip and boat facilities
Exterior
- Parking: Assigned parking; Driveway; Guest parking; Paved surfaces; One assigned space
- Security: Security guard; Community security features
- Utilities: Public water; Public sewer; Cable available; High speed internet available; Underground utilities
- Home design: Three-story building; Entry on level 3; Resale property; South-facing; North exposure noted; Waterfront (bay front, across-the-road frontage); Has a view
- Construction: Built with block, concrete and stucco; Built-up and flat roof
- Exterior features: Security/high-impact doors; Automatic sprinklers / irrigation; Community tennis courts; Community pool; Boat facilities and boat dock/boat slip; Beach access and beach rights; Street lights; Picnic and barbecue areas; Clubhouse; Shuffleboard and pickleball courts; Bike storage; Management on-site
Interior
- Kitchen: Dishwasher; Disposal; Microwave; Range; Refrigerator; Freezer
- Bedrooms: Split bedroom layout
- Flooring: Laminate flooring
- Bathrooms: Two full bathrooms
- Heating & cooling: Central heating (electric); Central air conditioning (electric); Ceiling fans
- Interior features: Cathedral and vaulted ceilings; Dual sinks; Living/dining room; Custom mirrors; Separate shower (shower only); Cable TV available; High speed internet available; Window coverings / treatments; Split bedrooms; Furnished
- Laundry & utility: Washer and dryer included; Laundry tub; Inside laundry
Neighborhood map
What this means for you Summary
Snapshot
- This is a 2-bed/2.0-bath condo listed at $549k.
Deal economics
- At list price, monthly cash flow is $3k ($32k/yr) — positive.
- The deal already cash-flows at list — no discount required.
- Meets the 1% rule at list price ($10k rent vs $549k).
- Recommended offer: $483k (12.0% below list) — sets the bar for market timing.
- Cap rate 13.1% vs local median 3.8% in Sanibel — top-decile yield for the area; either an underpriced asset or a hidden risk that comps aren't pricing in. Stress-test before assuming the spread holds.
Location & tenants
- Location reads 67/100 on livability (#541 in FL) — a middle-class / working-renter tenant base. Strengths: crime A+, employment A+; Watch: housing D+, amenities F, commute F.
- Lee (suburban): math 47% / reading 50% proficiency, ranked #42 of 73 in FL (top 58%) — families likely to look elsewhere, expect single-tenant / working-renter base with shorter leases.
- Zoned schools: The Sanibel School (math 92% / reading 92%, grade A+, #5 of 2,144 statewide, top 0%, 289 students, 12% FRL); South Fort Myers High School (math 23% / reading 30%, grade F, #489 of 667 statewide, top 74%, 1,917 students, 50% FRL) — zoned schools average 31% FRL vs 57% district-wide (26 pts lower); this property's tenant base skews higher-income than the district average.
- Market conditions: 526 active listings in the ZIP; 1 comparable units currently listed for rent nearby; 15,411 units permitted in Lee County in 2024 (4,686 in 5+ unit buildings).
Forward outlook
- Local home prices are declining (-3.0%/yr); year-one equity from $4k of loan paydown is wiped out by about $16k of value loss. Plan a longer hold.
- Lee County population projected at +44% by 2050 — long-run rental-demand tailwind backs the buy-and-hold thesis.
- At projected returns (-3.0% appreciation + 3.0% rent growth), your $154k cash investment doubles in ~6 years — after that, you're playing with house money.
Negotiation context
- It's been on market 218 days — a 12% lower offer ($483k) is reasonable based on typical stale-listing flexibility.
- 6 sale attempts since 17y ago with the ask held roughly flat each time — persistent listings suggest the price (not the market) is what's stuck; bring a comps-based counter.
- Current owner paid $465k; 18% above their basis — modest negotiation headroom, anchor on the comps not their cost.
Risks & watch-outs
- Watch-outs: flood insurance adds $427/mo.
- Climate carrying-cost: in FEMA flood zone AE (mandatory federal flood insurance); severe wind risk, 99% chance of damaging wind over 30y; extreme-heat days projected 7→25/yr by 2055 (HVAC capex compounding) — expect insurance premiums to compound above CPI over the hold.
Questions for the listing agent
- It's been on market 218 days. Have you received any prior offers? Is the seller open to a 12% concession, seller financing, or rate buy-down credit?
- Built in 1977 — when were the roof, HVAC, electrical panel, plumbing, and water heater last replaced?
- What's the actual annual flood-insurance premium (NFIP or private), and is the property in a SFHA with mandatory coverage?
- What does the HOA fee cover, when was the last increase, and are there any pending special assessments or reserve-fund shortfalls?
- Any open or pending special assessments — roof, HVAC, plumbing, elevator, façade? What's the per-unit balance and payoff schedule, and is the seller paying it off at close or rolling it to the buyer?
- Why hasn't it sold? Are there any deal-killer items the seller is aware of (foundation, flood, title, zoning, code violations)?
- Is there a deadline driving the sale (1031 exchange, divorce, estate, relocation)? That informs how much negotiation room exists.
- Schools are A-rated — typically a magnet for longer-tenancy family renters. What's the average tenant stay here, and is there a school-zone premium baked into asking?
- What's the average days-on-market for RENTAL listings here right now (not sales)? A rising rental-DOM trend means longer vacancies and softer asking-rent achievability than the comps imply.
- What's the recent tenant-quality profile in this submarket — average credit score on applications, eviction rate, late-payment / NSF rate, and stable-employment percentage? A property-management company in the area should have these aggregated.
- How much new apartment / multifamily construction is in the pipeline within 1–3 miles? Heavy new supply (>2% of stock underway) typically softens rents 12–24 months out; light construction supports rent growth.
Investment metrics
- 1% rule
- 1.91% ✓
- Cap rate
- 13.08%
- Cash-on-cash
- 24.23%
- DSCR
- 2.08
- GRM
- 4.4
CMA / ARV
No comps found within radius.
Projected returns pro-forma
-3.0% appreciation · 3.0% rent growth · sell at horizon
- IRR
- 13.5%
- Equity multiple
- 1.54×
- Total profit
- $82,845
- Equity at exit
- $81,858
- IRR
- 22.4%
- Equity multiple
- 2.93×
- Total profit
- $296,918
- Equity at exit
- $47,467
Cash invested: $153,720 (down + closing). Projections, not guarantees.
Landlord ↔ Tenant lean methodology
- Overall (STATE)
- 87 Strongly Landlord-Friendly
- State Florida
- 87 Strongly Landlord-Friendly · R+3
- County
- — inherits STATE
- City
- — inherits STATE
ZIP-level market 33957
- Home prices YoY
- -15.7%
- Active inventory
- 526
- Price-to-rent
- 4.4×
Monthly cashflow live
- Estimated rent
- $10,500 medium interval (Pro) →
- Mortgage (P&I)
- −$2,879
- Tax est. 1.5%
- −$686 /mo · $8,235/yr
- Insurance
- −$229
- Flood insurance flood zone
- −$427 /mo · $5,118/yr
- HOA
- −$1,397
- Vacancy / Maint / Mgmt
- −$2,205
- Net cashflow
- $2,677
Break-even live
Sensitivity live
| Price | -10% $3,057 | -5% $2,867 | +0% $2,677 | +5% $2,488 | +10% $2,298 |
|---|---|---|---|---|---|
| Rent | -10% $1,848 | -5% $2,263 | +0% $2,677 | +5% $3,092 | +10% $3,507 |
| Rate | -1.0pp $2,954 | -0.5pp $2,817 | base $2,677 | +0.5pp $2,535 | +1.0pp $2,390 |
UW: 25.0% down · 7.5% · 30yr · 1.5% tax · 5.0% vac · 8.0% maint · 8.0% mgmt
Financing live
Cash to close
- Down payment
- $137,250
- Closing costs
- $16,470
- Reserves months
- —
- Total cash needed
- —
Loan-product check · same deal, 3 products live
Conventional
25% down · 7.5% · 30yr
- Down + closing
- —
- Monthly P&I
- —
- Monthly cashflow
- —
- DSCR
- —
- Eligible?
- —
Personal DTI + credit; lowest rate.
DSCR
20% down · 8.5% · 30yr
- Down + closing
- —
- Monthly P&I
- —
- Monthly cashflow
- —
- DSCR
- —
- Eligible?
- —
No personal income docs; deal must DSCR.
Hard money
10% down · 12.0% · 12mo
- Down + closing
- —
- Monthly P&I
- —
- Monthly cashflow
- —
- DSCR
- —
- Eligible?
- —
Short-term bridge; refi at stabilization.
Rent comps 1 comps
| Address | Beds | Baths | Sqft | Rent | $/sqft | DOM | Units | Dist |
|---|---|---|---|---|---|---|---|---|
| 827 E Gulf Dr Unit G8 Sanibel, FL | 2.0 | 2.0 | 1040 | $10,500 | $10.10 | 25d | 1 | 0.81mi |
HOA detail condo
- Monthly dues
- $1,397 · $16,764/yr
- Likely covers
- water
- Assessments
- None detected in remarks — confirm with the listing agent.
Listing history 28 events
-
2026-06-22days on market $549,000 Active 218 DOM
-
2026-06-17days on market $549,000 Active 214 DOM
-
2026-06-16days on market $549,000 Active 213 DOM
-
2026-06-16days on market $549,000 Active 212 DOM
-
2026-06-13days on market $549,000 Active 210 DOM
-
2026-06-09days on market $549,000 Active 206 DOM
-
2026-06-07days on market $549,000 Active 204 DOM
-
2026-06-02days on market $549,000 Active 199 DOM
-
2026-06-01days on market $549,000 Active 198 DOM
-
2026-06-01days on market $549,000 Active 197 DOM
-
2025-11-15$549,000 Active
-
2025-04-30historical
-
2025-02-04price $569,900
-
2024-11-01$599,000 Active
-
2024-06-03historical
-
2023-12-06$649,900 Active
-
2020-11-13soldstatus $465,000
-
2020-11-06soldstatus $465,000 Closed
-
2020-09-11status Pending
-
2020-07-08price $490,000
-
2020-06-18historical
-
2020-06-12$495,000 Active
-
2020-06-12$495,000 Active
-
2014-01-13price $375,000
-
2014-01-13soldstatus $350,000
-
2014-01-13soldstatus $350,000
-
2009-06-26$448,000
-
1992-08-31soldstatus $210,000
ⓘ Source: listings_history table (triggers on properties + properties_extension) + one-shot
backfill from property_details.listing_events for pre-trigger history.
Climate risk First Street
- Flood 9/10 Extreme FEMA zone AE · 99% chance over 30 yrs
- Wildfire 1/10 Low
- Heat 10/10 Extreme 7 d/yr ≥113°F today · 25 d/yr by 30 yrs out
- Wind 10/10 Extreme 99% chance of damaging wind over 30 yrs
- Air quality 2/10 Low 1 unhealthy d/yr today · 1 by 30 yrs out
Nearby sold comps map
Loading sold comps map…
Walkable amenities ~0.75 mi
Loading nearby amenities…
Taxation est. · year 1
- Rental income
- $126,000
- − Mortgage interest
- −$30,753
- − Property taxes
- −$8,235
- − Insurance
- −$7,864
- − Repairs & maintenance
- −$10,080
- − Management
- −$10,080
- − HOA
- −$16,764
- − Depreciation
- −$15,971
- Taxable income
- $26,254
- Est. tax owed @ 24.0%
- −$6,301
- After-tax cash flow
- $25,828/yr
For passive investors: Depreciation is non-cash, so a rental often shows a tax loss while cash-flowing — sheltering income. Rental losses are passive: they offset passive income freely, and up to $25,000/yr can offset ordinary (W-2) income if you actively participate and your MAGI is under $100k (phasing out to $0 by $150k); unused losses carry forward. On sale, claimed depreciation is recaptured at up to 25%, and gains may owe capital-gains tax (a 1031 exchange can defer both). Figures are a year-1 estimate at your 24.0% rate — not tax advice; consult a CPA.
Schools (NCES district)
- District
- Lee
- NCES district ID
- 1201080
- Math proficiency
- 47% ▼ -11.00%
- Reading proficiency
- 50% ▼ -4.00%
- Median HH income
- $49,518
- Composite
- 41.49/100
- National rank
- #3458
- State rank
- #42 of 73 in FL
Livability — Sanibel
- Score
- 67/100
- State rank
- #541
- US rank
- #10166
Category grades
Schools grade is shown separately in the Schools card above.
Census & demographics
- Census place
- Sanibel, FL
- City population
- 6,402
- Population (ZIP)
- 6,402
Population outlook (Lee County) Hauer SSP2
- Today (2025)
- 871,946 people
- By 2030
- 955,468 · +9.6%
- By 2040
- 1,113,587 · +27.7%
- By 2050
- 1,256,891 · +44.1%
- By 2075
- 1,560,270 · +78.9%
- By 2100
- 1,726,848 · +98.0%
Race, ethnicity, and origin ACS 2023
- Neighborhood character
- Predominantly White (95%)
- Race & ethnicity
- White 95% Two or more races 2% Asian 1%
- Common ancestry
- Italian 4% Romanian 4% Slovak 2%
- Foreign-born
- 5% · Canada, China
- Languages at home
- 96% English-only · German/W. Germanic 1% Spanish 1% French/Haitian/Cajun 1%
Political lean MEDSL · Lee
- 2024 margin
- Strong R (+28.4) · D 35.5% · R 63.9%
- 2008→2024 swing
- -18.0pp toward R · 2008: -10.4pp · 2024: -28.4pp
- All cycles
- 2024: R+28.4 2020: R+19.2 2016: R+20.4 2012: R+16.6 2008: R+10.4
Not yet ingested
- Civics
- —
Market trends
- HPI YoY
- ▼ -93.08%
- Current HPI
- 501.0
- Rent YoY
- —
- Metro
- —
- State GDP YoY
- ▲ 3.28%
- F500 in state
- 36
Industry mix (Fortune 500 HQ in FL)
| Industry | F500 HQs | Revenue |
|---|---|---|
| Industrial Technology | 2 | $29B |
|
||
| Insurance | 2 | $17B |
|
||
| Retail | 1 | $60B |
|
||
| Technology Distribution | 1 | $58B |
|
||
| Homebuilding | 1 | $35B |
|
||
| Technology Manufacturing | 1 | $35B |
|
||
Price history
+161.4% since first listed18 events — show timeline
- 2025-11-15 Listed $549,000 FORTMLS
- 2025-04-30 Listing Removed — FORTMLS
- 2025-02-04 Price Changed $569,900 FORTMLS
- 2024-11-01 Listed $599,000 FORTMLS
- 2024-06-03 Listing Removed — FORTMLS
- 2023-12-06 Listed $649,900 FORTMLS
- 2020-11-13 Sold (Public Records) $465,000 Public Records
- 2020-11-06 Sold (MLS) $465,000 FORTMLS
- 2020-09-11 Pending — FORTMLS
- 2020-07-08 Price Changed $490,000 FORTMLS
- 2020-06-18 Listing Removed — FORTMLS
- 2020-06-12 Listed $495,000 FORTMLS
- 2020-06-12 Listed $495,000 FORTMLS
- 2014-01-13 Sold (Public Records) $350,000 Public Records
- 2014-01-13 Sold (MLS) $350,000 FORTMLS
- 2014-01-13 Price Changed $375,000 FORTMLS
- 2009-06-26 Listed $448,000 NAPLESMLS
- 1992-08-31 Sold (Public Records) $210,000 Public Records
Property tax history
-13.5%/yrLatest (2025): $1,034 · -0.4% YoY. Source: county tax records.
Cash-flow waterfall
monthlySold comps — $/sqft
last 12 mo · ≤1 miLoading sold comps…