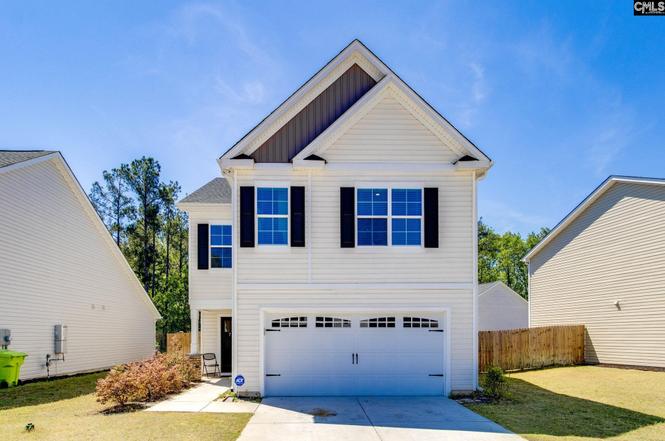
716 Wimbee Ct · Blythewood, SC
Flood risk No data
- FEMA flood zone
- —
- Chance of flooding over 30 yrs
- —
- Est. flood insurance / yr
- —
Fire risk No data
- Est. fire insurance / yr
- —
Heat risk No data
- Hot days now (above threshold)
- —
- Hot days in 30 yrs
- —
Wind risk No data
- Chance of severe wind over 30 yrs
- —
Air-quality risk No data
- Unhealthy air days now
- —
- Unhealthy air days in 30 yrs
- —
Risk factors via First Street. Map © Google.
Why this score? — see what drove the C- grade
The composite is a weighted blend of 9 inputs, each scored 0–100. Each bar is that input's sub-score; the figure is the points it added to the 100-point composite (weight × sub-score).
- Cash flow +21.7/30.0
- ARV discount +7.5/15.0
- DSCR +6.9/10.0
- 1% rule +5.8/10.0
- Schools +3.6/10.0
- Livability +3.5/5.0
- Rent growth +2.5/5.0
- Condition / age +2.5/5.0
- Appreciation +0.0/10.0
$279,900
🖨 Deal sheet 📄 Offer letter ✓ Due diligence
Listing remarks
Major Price Reduction!!! Motivated Sellers!! Welcome to this charming, energy-efficient home nestled in the desirable Willow Lake community! Step inside to discover a bright and airy open-concept main level featuring luxury vinyl plank flooring, a spacious great room filled with natural light, and a stylish kitchen with painted cabinetry, granite countertops, recessed lighting, and a large center island perfect for both cooking and gathering. A cozy eat-in area and a convenient powder room and built in drop off complete the welcoming main floor. Upstairs, retreat to the serene primary suite tucked privately at the back of the home. This relaxing space features a large walk-in closet and a
Key facts
- Spacious great room
- Stylish kitchen
- Painted cabinetry
Tags
Property features AI
Finance
- HOA & community: Community association with amenities including playground and pool; Association fee covers common area maintenance, playground, and pool
Exterior
- Parking: Attached garage with 2 spaces
- Utilities: Public water; Public sewer
- Home design: Two-story home
- Construction: Slab foundation
- Exterior features: Vinyl exterior finish; Rear wood privacy fence
Interior
- Kitchen: Eat-in layout; Pantry; Granite countertops; Painted cabinets; Recessed lighting
- Bedrooms: Master bedroom on second level; Additional bedrooms on second level with private closets and carpeted floors
- Flooring: Luxury vinyl plank flooring in main living areas; Carpet in bedrooms
- Bathrooms: Two full bathrooms; One half bathroom; Two additional full secondary bathrooms
- Heating & cooling: Central air conditioning; Gas heating on first level
- Interior features: Recessed lighting in living room and kitchen; Luxury vinyl plank flooring in living room and kitchen; Eat-in kitchen; Pantry; Painted cabinets; Granite countertops
- Laundry & utility: Electric laundry hookups; Heated laundry space; Washer/dryer located on second level
Neighborhood map
What this means for you Summary
Snapshot
- This is a 4-bed/2.5-bath single-family listed at $280k.
Deal economics
- At list price, monthly cash flow is $428 ($5k/yr) — positive.
- The deal already cash-flows at list — no discount required.
- Meets the 1% rule at list price ($3k rent vs $280k).
- Recommended offer: $255k (9.0% below list) — sets the bar for market timing.
Location & tenants
- Location reads 70/100 on livability (#58 in SC) — a middle-class / working-renter tenant base. Strengths: crime A+, employment A+, housing A+; Watch: amenities F, commute F, health & safety F.
- Richland 02 (suburban): math 35% / reading 47% proficiency, ranked #29 of 80 in SC (top 36%) — families likely to look elsewhere, expect single-tenant / working-renter base with shorter leases.
- Zoned schools: Langford Elementary (math 39% / reading 43%, grade F, #276 of 597 statewide, top 48%, 609 students, 64% FRL); Blythewood High (math 72% / reading 92%, grade A, #19 of 196 statewide, top 10%, 2,094 students, 39% FRL).
- Zoned-school proficiency averages 62% at this address vs 41% district-wide (+20 pts) — the actual schools serving this property are materially stronger than the Richland 02 average implies; a family-tenant draw the district grade alone would hide.
- Market conditions: 650 active listings in the ZIP; 3 comparable units currently listed for rent nearby; rentals leasing fast (median 3d on market — plan ~1-2 weeks tenant-placement turnaround); solid renter incomes; 3,472 units permitted in Richland County in 2024 (1,096 in 5+ unit buildings).
- This rent runs 38% of the median local income ($95k/yr) — at the standard rent-burdened threshold; future hikes will face affordability resistance.
Forward outlook
- Local home prices are declining (-3.0%/yr); year-one equity from $2k of loan paydown is wiped out by about $8k of value loss. Plan a longer hold.
- Richland County population projected at +30% by 2050 — long-run rental-demand tailwind backs the buy-and-hold thesis.
Negotiation context
- It's been on market 118 days — a 9% lower offer ($255k) is reasonable based on typical stale-listing flexibility.
- 7 sale attempts since 3y ago; this cycle's ask has dropped $35k (11%) from the opening price — seller is motivated, your offer sets the floor, not the list.
Questions for the listing agent
- It's been on market 118 days. Have you received any prior offers? Is the seller open to a 9% concession, seller financing, or rate buy-down credit?
- What does the HOA fee cover, when was the last increase, and are there any pending special assessments or reserve-fund shortfalls?
- Why hasn't it sold? Are there any deal-killer items the seller is aware of (foundation, flood, title, zoning, code violations)?
- Is there a deadline driving the sale (1031 exchange, divorce, estate, relocation)? That informs how much negotiation room exists.
- Schools are B-rated — typically a magnet for longer-tenancy family renters. What's the average tenant stay here, and is there a school-zone premium baked into asking?
- What's the average days-on-market for RENTAL listings here right now (not sales)? A rising rental-DOM trend means longer vacancies and softer asking-rent achievability than the comps imply.
- What's the recent tenant-quality profile in this submarket — average credit score on applications, eviction rate, late-payment / NSF rate, and stable-employment percentage? A property-management company in the area should have these aggregated.
- How much new for-sale + rental construction is in the pipeline within 1–3 miles? Heavy new supply typically softens prices + rents 12–24 months out; constrained supply supports both.
Investment metrics
- 1% rule
- 1.08% ✓
- Cap rate
- 8.13%
- Cash-on-cash
- 6.56%
- DSCR
- 1.29
- GRM
- 7.7
CMA / ARV
No comps found within radius.
Projected returns pro-forma
-3.0% appreciation · 3.0% rent growth · sell at horizon
- IRR
- -6.2%
- Equity multiple
- 0.77×
- Total profit
- $-18,000
- Equity at exit
- $41,734
- IRR
- 3.5%
- Equity multiple
- 1.25×
- Total profit
- $19,728
- Equity at exit
- $24,201
Cash invested: $78,372 (down + closing). Projections, not guarantees.
Landlord ↔ Tenant lean methodology
- Overall (STATE)
- 90 Strongly Landlord-Friendly
- State South Carolina
- 90 Strongly Landlord-Friendly · R+6
- County
- — inherits STATE
- City
- — inherits STATE
ZIP-level market 29016
- Home prices YoY
- -26.3%
- Active inventory
- 650
- Price-to-rent
- 7.7×
Monthly cashflow live
- Estimated rent
- $3,029 medium interval (Pro) →
- Mortgage (P&I)
- −$1,468
- Tax est. 1.5%
- −$350 /mo · $4,198/yr
- Insurance
- −$117
- HOA
- −$30
- Vacancy / Maint / Mgmt
- −$636
- Net cashflow
- $428
Break-even live
UW: 25.0% down · 7.5% · 30yr · 1.5% tax · 5.0% vac · 8.0% maint · 8.0% mgmt
Financing live
Cash to close
- Down payment
- $69,975
- Closing costs
- $8,397
- Reserves months
- —
- Total cash needed
- —
Loan-product check · same deal, 3 products live
Conventional
25% down · 7.5% · 30yr
- Down + closing
- —
- Monthly P&I
- —
- Monthly cashflow
- —
- DSCR
- —
- Eligible?
- —
Personal DTI + credit; lowest rate.
DSCR
20% down · 8.5% · 30yr
- Down + closing
- —
- Monthly P&I
- —
- Monthly cashflow
- —
- DSCR
- —
- Eligible?
- —
No personal income docs; deal must DSCR.
Hard money
10% down · 12.0% · 12mo
- Down + closing
- —
- Monthly P&I
- —
- Monthly cashflow
- —
- DSCR
- —
- Eligible?
- —
Short-term bridge; refi at stabilization.
Rent comps 3 comps
| Address | Beds | Baths | Sqft | Rent | $/sqft | DOM | Units | Dist |
|---|---|---|---|---|---|---|---|---|
| 563 Roseridge Dr Blythewood, SC | 5.0 | 3.0 | 2555 | $3,619 | $1.42 | 2d | 1 | 1.23mi |
| 620 Stono DR Blythewood, SC | 5.0 | 3.0 | 2334 | $2,350 | $1.01 | 14d | 1 | 1.27mi |
| 463 N High Duck Trl Blythewood, SC | 3.0 | 2.5 | 1604 | $2,200 | $1.37 | 3d | 1 | 1.40mi |
HOA detail
- Monthly dues
- $30 · $360/yr
Listing history 30 events
-
2026-06-18days on market $279,900 Active 118 DOM
-
2026-06-17days on market $279,900 Active 117 DOM
-
2026-06-16days on market $279,900 Active 116 DOM
-
2026-06-15days on market $279,900 Active 115 DOM
-
2026-06-14days on market $279,900 Active 113 DOM
-
2026-06-13days on market $279,900 Active 112 DOM
-
2026-06-10days on market $279,900 Active 110 DOM
-
2026-06-09days on market $279,900 Active 109 DOM
-
2026-06-08days on market $279,900 Active 108 DOM
-
2026-06-07days on market $279,900 Active 107 DOM
-
2026-06-05pricedays on market $279,900 Active 104 DOM
-
2026-06-03days on market $286,000 Active 103 DOM
-
2026-06-03days on market $286,000 Active 102 DOM
-
2026-06-01days on market $286,000 Active 101 DOM
-
2026-05-31days on market $286,000 Active 100 DOM
-
2026-04-30price $286,000
-
2026-03-12price $308,000
-
2026-02-20$315,000 Active
-
2024-03-14status Pending
-
2024-02-27price $269,900
-
2024-02-24$268,900 Active
-
2024-02-02$268,900 Active
-
2024-02-01historical
-
2024-02-01price $269,900
-
2024-01-19price $268,900
-
2024-01-10$265,100 Active
-
2024-01-08$265,100 Active
-
2024-01-02historical
-
2024-01-01$265,100 Active
-
2023-12-07$268,900 Active
ⓘ Source: listings_history table (triggers on properties + properties_extension) + one-shot
backfill from property_details.listing_events for pre-trigger history.
Nearby sold comps map
Loading sold comps map…
Walkable amenities ~0.75 mi
Loading nearby amenities…
Taxation est. · year 1
- Rental income
- $36,347
- − Mortgage interest
- −$15,679
- − Property taxes
- −$4,198
- − Insurance
- −$1,400
- − Repairs & maintenance
- −$2,908
- − Management
- −$2,908
- − HOA
- −$360
- − Depreciation
- −$8,143
- Taxable income
- $752
- Est. tax owed @ 24.0%
- −$180
- After-tax cash flow
- $4,962/yr
For passive investors: Depreciation is non-cash, so a rental often shows a tax loss while cash-flowing — sheltering income. Rental losses are passive: they offset passive income freely, and up to $25,000/yr can offset ordinary (W-2) income if you actively participate and your MAGI is under $100k (phasing out to $0 by $150k); unused losses carry forward. On sale, claimed depreciation is recaptured at up to 25%, and gains may owe capital-gains tax (a 1031 exchange can defer both). Figures are a year-1 estimate at your 24.0% rate — not tax advice; consult a CPA.
Schools (NCES district)
- District
- Richland 02
- NCES district ID
- 4503390
- Math proficiency
- 35% ▼ -15.00%
- Reading proficiency
- 47% ▼ -5.00%
- Median HH income
- $59,684
- Composite
- 36.2/100
- National rank
- #4730
- State rank
- #29 of 80 in SC
Livability — Blythewood
- Score
- 70/100
- State rank
- #58
- US rank
- #7406
Category grades
Schools grade is shown separately in the Schools card above.
Census & demographics
- County
- Richland County · 389,530 people
- City population
- 30,454
- Metro
- Columbia, SC
- Population (ZIP)
- 30,454
- Household income
- $95,082
- Rent vs Own
- Severe rent burden
- 559.0
Population outlook (Richland County) Hauer SSP2
- Today (2025)
- 459,667 people
- By 2030
- 487,524 · +6.1%
- By 2040
- 542,035 · +17.9%
- By 2050
- 595,371 · +29.5%
- By 2075
- 732,998 · +59.5%
- By 2100
- 820,415 · +78.5%
Race, ethnicity, and origin ACS 2023
- Neighborhood character
- Diverse neighborhood (Simpson 0.64)
- Race & ethnicity
- Black 43% White 42% Two or more races 7% Hispanic / Latino 7% Asian 3%
- Hispanic origin (detail)
- Mexican 1% Puerto Rican 2%
- Common ancestry
- Lithuanian 2% Romanian 2% Slovak 2%
- Foreign-born
- 5% · Canada, China
- Languages at home
- 90% English-only · Spanish 5% Other Indo-European 1% German/W. Germanic 1%
Political lean MEDSL · Richland
- 2024 margin
- Solid D (+34.6) · D 66.4% · R 31.8% · Other 1.8%
- 2008→2024 swing
- +5.7pp toward D · 2008: 28.9pp · 2024: 34.6pp
- All cycles
- 2024: D+34.6 2020: D+38.3 2016: D+32.9 2012: D+33.3 2008: D+28.9
Not yet ingested
- Civics
- —
Market trends
- HPI YoY
- ▼ -65.48%
- Current HPI
- 183.5933
- Rent YoY
- —
- Metro
- Columbia, SC
- State GDP YoY
- ▲ 4.51%
- F500 in state
- 2
Industry mix (Fortune 500 HQ in SC)
| Industry | F500 HQs | Revenue |
|---|---|---|
| Packaging | 1 | $7B |
|
||
Price history
+6.4% since first listed15 events — show timeline
- 2026-04-30 Price Changed $286,000 Consolidated MLS
- 2026-03-12 Price Changed $308,000 Consolidated MLS
- 2026-02-20 Listed $315,000 Consolidated MLS
- 2024-03-14 Pending — Consolidated MLS
- 2024-02-27 Price Changed $269,900 Consolidated MLS
- 2024-02-24 Listed $268,900 Consolidated MLS
- 2024-02-02 Listed $268,900 Consolidated MLS
- 2024-02-01 Delisted — Consolidated MLS
- 2024-02-01 Price Changed $269,900 Consolidated MLS
- 2024-01-19 Price Changed $268,900 Consolidated MLS
- 2024-01-10 Listed $265,100 SBOR
- 2024-01-08 Listed $265,100 SBOR
- 2024-01-02 Delisted — Consolidated MLS
- 2024-01-01 Listed $265,100 Consolidated MLS
- 2023-12-07 Listed $268,900 Consolidated MLS
Cash-flow waterfall
monthlySold comps — $/sqft
last 12 mo · ≤1 miLoading sold comps…