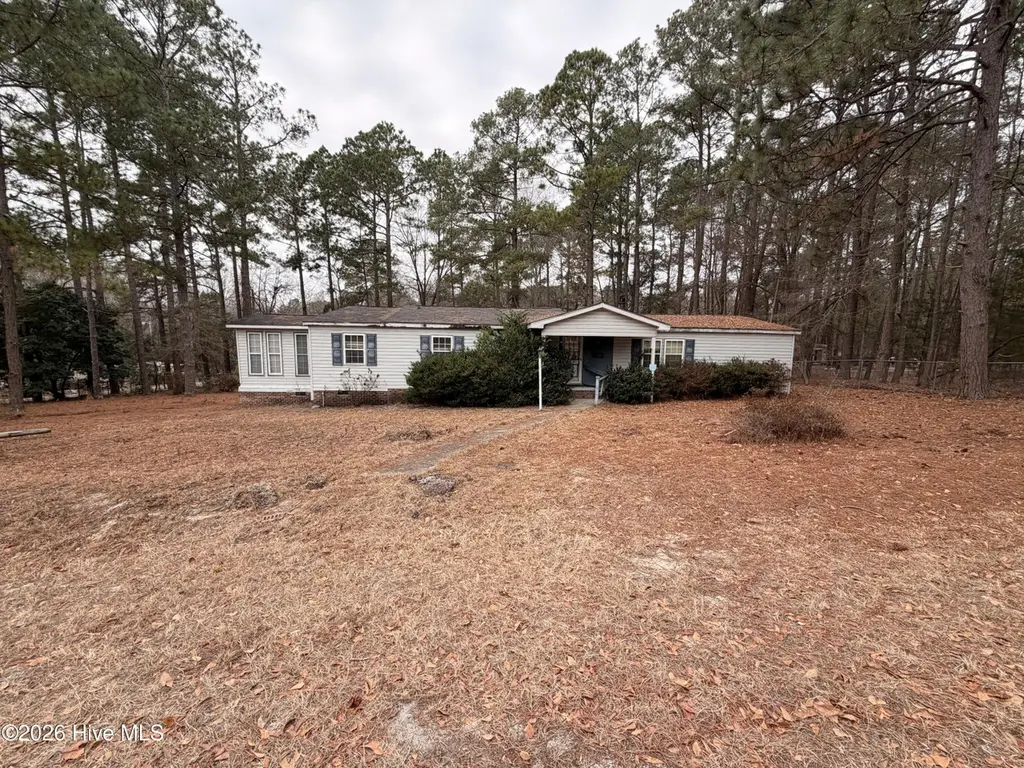
120 Dunn St · Ellerbe, NC
Flood risk 1/10 · Minimal
- FEMA flood zone
- X (unshaded)
- Chance of flooding over 30 yrs
- 0.0%
- Est. flood insurance / yr
- $507 – $1,088
Fire risk 3/10 · Minor
- Est. fire insurance / yr
- $906 – $1,684
Heat risk 6/10 · Moderate
- Hot days now (above 108°F)
- 7 days/yr
- Hot days in 30 yrs
- 16 days/yr
Wind risk 6/10 · Moderate
- Chance of severe wind over 30 yrs
- 63.0%
Air-quality risk 2/10 · Minimal
- Unhealthy air days now
- 0 days/yr
- Unhealthy air days in 30 yrs
- 1 days/yr
Risk factors via First Street. Map © Google.
Why this score? — see what drove the B grade
The composite is a weighted blend of 9 inputs, each scored 0–100. Each bar is that input's sub-score; the figure is the points it added to the 100-point composite (weight × sub-score).
- Cash flow +30.0/30.0
- 1% rule +10.0/10.0
- DSCR +10.0/10.0
- ARV discount +7.5/15.0
- Appreciation +6.2/10.0
- Livability +3.4/5.0
- Schools +2.7/10.0
- Rent growth +2.5/5.0
- Condition / age +2.5/5.0
$52,000
🖨 Deal sheet 📄 Offer letter ✓ Due diligence
Listing remarks
Almost $20,000.00 below tax value! Dont miss this great investment opportunity. This manufactured 3bd 2ba home boasts 1,887 sq ft of living space and sits on over half an acre.
Key facts
- 0.6 acre lot
- 2 parking spots
- Built 1992
Property features AI
Exterior
- Parking: Covered, unpaved parking; 2-space carport
- Utilities: Public water; Water connected; Private sewer
- Home design: Manufactured home; One level / single-story; Entry level: 1
- Construction: Vinyl siding and frame construction; Composition roof; Brick/mortar foundation; Built on a 0.6-acre lot (approximately 175 x 150 x 175 x 150)
- Exterior features: Covered patio/porch; No fencing; Has view
Interior
- Kitchen: Appliances: Electric water heater
- Bedrooms: Total rooms: 7
- Flooring: See remarks
- Bathrooms: 2 full bathrooms
- Heating & cooling: Heat pump heating; Central air conditioning
- Interior features: Unfurnished; Electric water heater; Crawl space foundation
- Laundry & utility: Washer/dryer location: See remarks
Neighborhood map
What this means for you Summary
Snapshot
- This is a 3-bed/2.0-bath manufactured listed at $52k.
Deal economics
- At list price, monthly cash flow is $633 ($8k/yr) — positive.
- The deal already cash-flows at list — no discount required.
- Meets the 1% rule at list price ($1k rent vs $52k).
- Recommended offer: $49k (6.0% below list) — sets the bar for market timing.
Location & tenants
- Location reads 67/100 on livability (#245 in NC) — a middle-class / working-renter tenant base. Strengths: cost of living A+, health & safety A+, crime A-; Watch: amenities F, commute F, employment F.
- Richmond County Schools (town): math 30% / reading 36% proficiency, ranked #139 of 178 in NC (top 78%) — families likely to look elsewhere, expect single-tenant / working-renter base with shorter leases; 70% free/reduced lunch — lower-income household profile, screen leases tightly.
- Zoned schools: Mineral Springs Elementary (math 37% / reading 42%, grade F, #694 of 1,410 statewide, top 53%, 371 students, 99% FRL); Ellerbe Middle (math 29% / reading 42%, grade F, #279 of 475 statewide, top 60%, 212 students, 99% FRL); Richmond Senior High (math 58% / reading 38%, grade D, #329 of 535 statewide, top 62%, 1,286 students, 99% FRL) — zoned schools average 99% FRL vs 70% district-wide (29 pts higher); higher-poverty schools than district average — tighter screening recommended.
- Market conditions: 17 active listings in the ZIP; 54 units permitted in Richmond County in 2024 (0 in 5+ unit buildings).
Forward outlook
- In year one you build about $2k of equity ($360 loan paydown + $1k appreciation (2.4% local appreciation)).
- Richmond County population projected at -22% by 2050 — secular population decline; favor cash flow + early exit over multi-decade hold.
- At projected returns (2.4% appreciation + 3.0% rent growth), your $15k cash investment doubles in ~2 years — after that, you're playing with house money.
Negotiation context
- It's been on market 64 days — a 6% lower offer ($49k) is reasonable based on typical stale-listing flexibility.
Risks & watch-outs
- Climate carrying-cost: major wind risk, 63% chance of damaging wind over 30y; extreme-heat days projected 7→16/yr by 2055 (HVAC capex compounding) — expect insurance premiums to compound above CPI over the hold.
Questions for the listing agent
- It's been on market 64 days. Have you received any prior offers? Is the seller open to a 6% concession, seller financing, or rate buy-down credit?
- Why hasn't it sold? Are there any deal-killer items the seller is aware of (foundation, flood, title, zoning, code violations)?
- Is there a deadline driving the sale (1031 exchange, divorce, estate, relocation)? That informs how much negotiation room exists.
- Schools are D-rated, which usually means shorter tenancies and higher turnover. Who's the typical renter profile here, and what's been the actual vacancy rate?
- What's the average days-on-market for RENTAL listings here right now (not sales)? A rising rental-DOM trend means longer vacancies and softer asking-rent achievability than the comps imply.
- What's the recent tenant-quality profile in this submarket — average credit score on applications, eviction rate, late-payment / NSF rate, and stable-employment percentage? A property-management company in the area should have these aggregated.
- How much new for-sale + rental construction is in the pipeline within 1–3 miles? Heavy new supply typically softens prices + rents 12–24 months out; constrained supply supports both.
Investment metrics
- 1% rule
- 2.37% ✓
- Cap rate
- 20.89%
- Cash-on-cash
- 52.13%
- DSCR
- 3.32
- GRM
- 3.5
CMA / ARV
No comps found within radius.
Projected returns pro-forma
2.37% appreciation · 3.0% rent growth · sell at horizon
- IRR
- 56.5%
- Equity multiple
- 4.08×
- Total profit
- $44,834
- Equity at exit
- $21,548
- IRR
- 56.6%
- Equity multiple
- 8.24×
- Total profit
- $105,366
- Equity at exit
- $31,847
Cash invested: $14,560 (down + closing). Projections, not guarantees.
Landlord ↔ Tenant lean methodology
- Overall (STATE)
- 85 Strongly Landlord-Friendly
- State North Carolina
- 85 Strongly Landlord-Friendly · R+3
- County
- — inherits STATE
- City
- — inherits STATE
ZIP-level market 28338
- Home prices YoY
- 1.6%
- Active inventory
- 17
- Price-to-rent
- 3.5×
Monthly cashflow live
- Estimated rent
- $1,234 medium interval (Pro) →
- Mortgage (P&I)
- −$273
- Tax from tax record
- −$48 /mo · $578/yr
- Insurance
- −$22
- HOA
- −$0
- Vacancy / Maint / Mgmt
- −$259
- Net cashflow
- $633
Break-even live
UW: 25.0% down · 7.5% · 30yr · 1.5% tax · 5.0% vac · 8.0% maint · 8.0% mgmt
Financing live
Cash to close
- Down payment
- $13,000
- Closing costs
- $1,560
- Reserves months
- —
- Total cash needed
- —
Loan-product check · same deal, 3 products live
Conventional
25% down · 7.5% · 30yr
- Down + closing
- —
- Monthly P&I
- —
- Monthly cashflow
- —
- DSCR
- —
- Eligible?
- —
Personal DTI + credit; lowest rate.
DSCR
20% down · 8.5% · 30yr
- Down + closing
- —
- Monthly P&I
- —
- Monthly cashflow
- —
- DSCR
- —
- Eligible?
- —
No personal income docs; deal must DSCR.
Hard money
10% down · 12.0% · 12mo
- Down + closing
- —
- Monthly P&I
- —
- Monthly cashflow
- —
- DSCR
- —
- Eligible?
- —
Short-term bridge; refi at stabilization.
Listing history 18 events
-
2026-06-19days on market $52,000 Active 64 DOM
-
2026-06-18days on market $52,000 Active 63 DOM
-
2026-06-17days on market $52,000 Active 62 DOM
-
2026-06-16days on market $52,000 Active 61 DOM
-
2026-06-15days on market $52,000 Active 60 DOM
-
2026-06-14days on market $52,000 Active 58 DOM
-
2026-06-13days on market $52,000 Active 57 DOM
-
2026-06-10days on market $52,000 Active 55 DOM
-
2026-06-09days on market $52,000 Active 54 DOM
-
2026-06-08days on market $52,000 Active 53 DOM
-
2026-06-07days on market $52,000 Active 52 DOM
-
2026-06-05days on market $52,000 Active 49 DOM
-
2026-06-03days on market $52,000 Active 48 DOM
-
2026-06-02days on market $52,000 Active 47 DOM
-
2026-06-01days on market $52,000 Active 46 DOM
-
2026-05-31days on market $52,000 Active 45 DOM
-
2026-05-30days on market $52,000 Active 44 DOM
-
2026-04-16$52,000 Active
ⓘ Source: listings_history table (triggers on properties + properties_extension) + one-shot
backfill from property_details.listing_events for pre-trigger history.
Tax reassessment forecast NC · Resets to sale price
- Current annual tax
- $578 · $48/mo
- Projected year-2 tax
- $578 · $48/mo
- Expected delta
- $0/yr ($0/mo · 0.0%)
ⓘ Screening estimate from a state-policy table — verify with the county assessor before closing.
Climate risk First Street
- Flood 1/10 Low FEMA zone X (unshaded) · 0% chance over 30 yrs
- Wildfire 3/10 Moderate
- Heat 6/10 Major 7 d/yr ≥108°F today · 16 d/yr by 30 yrs out
- Wind 6/10 Major 63% chance of damaging wind over 30 yrs
- Air quality 2/10 Low 0 unhealthy d/yr today · 1 by 30 yrs out
Nearby sold comps map
Loading sold comps map…
Walkable amenities ~0.75 mi
Loading nearby amenities…
Taxation est. · year 1
- Rental income
- $14,811
- − Mortgage interest
- −$2,913
- − Property taxes
- −$578
- − Insurance
- −$260
- − Repairs & maintenance
- −$1,185
- − Management
- −$1,185
- − Depreciation
- −$1,513
- Taxable income
- $7,177
- Est. tax owed @ 24.0%
- −$1,723
- After-tax cash flow
- $5,868/yr
For passive investors: Depreciation is non-cash, so a rental often shows a tax loss while cash-flowing — sheltering income. Rental losses are passive: they offset passive income freely, and up to $25,000/yr can offset ordinary (W-2) income if you actively participate and your MAGI is under $100k (phasing out to $0 by $150k); unused losses carry forward. On sale, claimed depreciation is recaptured at up to 25%, and gains may owe capital-gains tax (a 1031 exchange can defer both). Figures are a year-1 estimate at your 24.0% rate — not tax advice; consult a CPA.
Schools (NCES district)
- District
- Richmond County Schools
- NCES district ID
- 3703870
- Math proficiency
- 30% ▼ -12.00%
- Reading proficiency
- 36% ▼ -3.00%
- Median HH income
- $32,224
- Composite
- 26.97/100
- National rank
- #7076
- State rank
- #139 of 178 in NC
Livability — Ellerbe
- Score
- 67/100
- State rank
- #245
- US rank
- #11013
Category grades
Schools grade is shown separately in the Schools card above.
Census & demographics
- Census place
- Ellerbe, NC
- Population (ZIP)
- 3,320
Population outlook (Richmond County) Hauer SSP2
- Today (2025)
- 42,892 people
- By 2030
- 41,257 · -3.8%
- By 2040
- 37,629 · -12.3%
- By 2050
- 33,655 · -21.5%
- By 2075
- 23,992 · -44.1%
- By 2100
- 14,782 · -65.5%
Race, ethnicity, and origin ACS 2023
- Neighborhood character
- Diverse neighborhood (Simpson 0.57)
- Race & ethnicity
- White 61% Black 18% Hispanic / Latino 15% Two or more races 2%
- Hispanic origin (detail)
- Mexican 7% Puerto Rican 2%
- Common ancestry
- Serbian 2% Slovak 2% Iranian 1%
- Foreign-born
- 6% · Canada
- Languages at home
- 83% English-only · Spanish 17%
Political lean MEDSL · Richmond
- 2024 margin
- Strong R (+20.9) · D 39.2% · R 60.1%
- 2008→2024 swing
- -22.4pp toward R · 2008: 1.5pp · 2024: -20.9pp
- All cycles
- 2024: R+20.9 2020: R+14.8 2016: R+10.1 2012: D+2.7 2008: D+1.5
Not yet ingested
- Civics
- —
Market trends
- HPI YoY
- ▲ 2.37%
- Current HPI
- 153.3745
- Rent YoY
- —
- Metro
- —
- State GDP YoY
- ▲ 3.28%
- F500 in state
- 26
Industry mix (Fortune 500 HQ in NC)
| Industry | F500 HQs | Revenue |
|---|---|---|
| Financial Services | 2 | $213B |
|
||
| Retail | 2 | $95B |
|
||
| Industrial Conglomerate | 1 | $38B |
|
||
| Metals / Steel | 1 | $35B |
|
||
| Utilities | 1 | $30B |
|
||
| Industrial Machinery | 1 | $19B |
|
||
Price history
1 event — show timeline
- 2026-04-16 Listed $52,000 Hive MLS
Property tax history
+4.6%/yrLatest (2025): $578 · -2.4% YoY. Source: county tax records.
Cash-flow waterfall
monthlySold comps — $/sqft
last 12 mo · ≤1 miLoading sold comps…