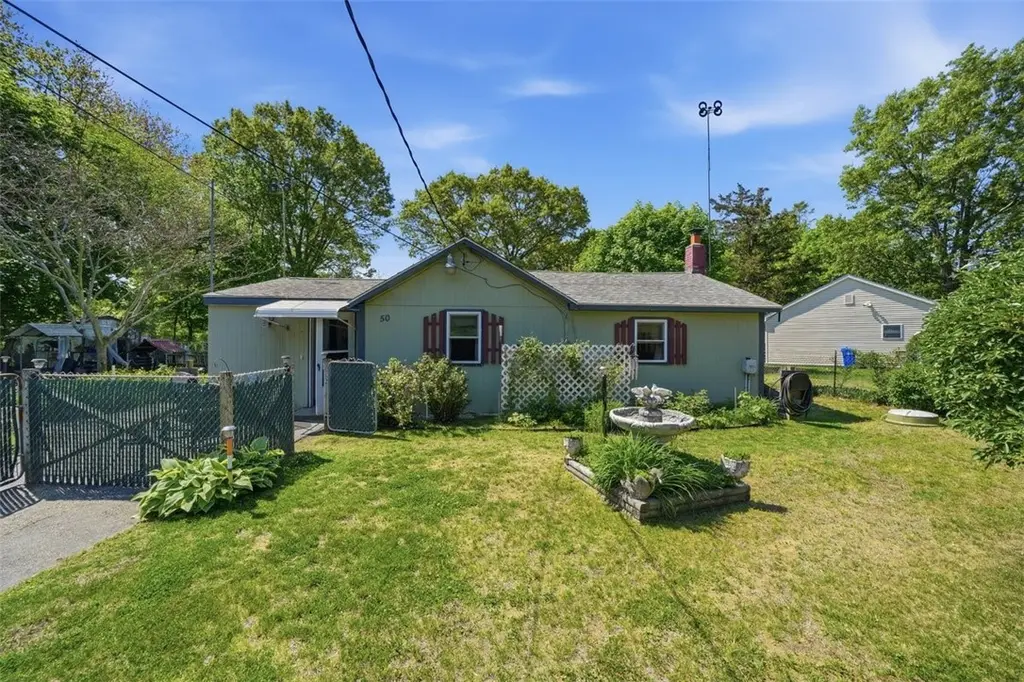
50 Lane 2 · Warwick, RI
Flood risk 1/10 · Minimal
- FEMA flood zone
- X (unshaded)
- Chance of flooding over 30 yrs
- 0.0%
- Est. flood insurance / yr
- $473 – $860
Fire risk 1/10 · Minimal
- Est. fire insurance / yr
- $835 – $1,551
Heat risk 5/10 · Moderate
- Hot days now (above 96°F)
- 7 days/yr
- Hot days in 30 yrs
- 15 days/yr
Wind risk 6/10 · Moderate
- Chance of severe wind over 30 yrs
- 74.0%
Air-quality risk 2/10 · Minimal
- Unhealthy air days now
- 2 days/yr
- Unhealthy air days in 30 yrs
- 2 days/yr
Risk factors via First Street. Map © Google.
Why this score? — see what drove the C- grade
The composite is a weighted blend of 9 inputs, each scored 0–100. Each bar is that input's sub-score; the figure is the points it added to the 100-point composite (weight × sub-score).
- ARV discount +15.0/15.0
- Cash flow +14.6/30.0
- 1% rule +6.8/10.0
- DSCR +4.5/10.0
- Livability +3.9/5.0
- Rent growth +2.5/5.0
- Condition / age +2.5/5.0
- Schools +2.2/10.0
- Appreciation +0.0/10.0
$199,000
🖨 Deal sheet (PDF) 📄 Offer letter ✓ Due diligence
Listing remarks
Salt air rising up off Narragansett Bay envelops this sun drenched yard which has been meticulously cared for by the same homeowners for the previous 48 years. Welcome to your new 1 level beach cottage located in desirable Gaspee Point. Situated just a 3 minute walk from the beach entrance, this beautifully manicured and completely fenced in oversized yard surrounds a charming home, ideal for first time homebuyers or downsizers. Property highlights include a newer roof, recent foundation work, connection to the sewers with no assessment, and 3 exterior sheds. Come experience why Gaspee Point is one of Rhode Island's best kept secrets. Deadline for offers is Wednesday, June 17th at 5:00 PM.
Key facts
- Sun drenched yard
- Newer roof
- Completely fenced
Tags
Property features AI
Finance
- Financial info: Property has a land lease
- HOA & community: Monthly association fee of $475; Community amenities include pool, recreation area, restaurants, shopping, and proximity to schools
Exterior
- Parking: No garage; 3 parking spaces
- Utilities: Public water (connected); Sewer connected; 200+ amp electric service
- Home design: Single-story; Concrete perimeter foundation
- Construction: Drywall; Wood siding; Built with concrete perimeter foundation
- Exterior features: Paved driveway; TV antenna; Fenced yard; Beach access; Water access; Walk to water
Interior
- Kitchen: Eat-in kitchen; Microwave; Oven; Range; Refrigerator
- Bedrooms: Bedroom on first floor
- Flooring: Laminate; Vinyl
- Bathrooms: 1 full bathroom
- Heating & cooling: Gas heating; Space heater; Window unit(s) for cooling
- Interior features: Attic; Storage; Stall shower
- Laundry & utility: Gas water heater; Water heater
Neighborhood map
What this means for you Summary
Snapshot
- This is a 1-bed/1.0-bath single-family listed at $199k.
Deal economics
- At list price, monthly cash flow is $49 ($587/yr) — positive.
- The deal already cash-flows at list — no discount required.
- Meets the 1% rule at list price ($2k rent vs $199k).
- Recommended offer: $196k (1.5% below list) — sets the bar for market timing.
- Cap rate 6.6% vs local median 3.3% in Warwick — top-decile yield for the area; either an underpriced asset or a hidden risk that comps aren't pricing in. Stress-test before assuming the spread holds.
Location & tenants
- Location reads 78/100 on livability (#6 in RI, #2,425 nationally) — a middle-class / working-renter tenant base. Strengths: crime A+, commute A+, housing A+; Watch: amenities F.
- Warwick (urban): math 15% / reading 32% proficiency, ranked #25 of 39 in RI (top 64%) — low school quality limits family demand, transient renter base, plan for 1-2y turnover.
- Zoned schools: Warwick Early Learning Center (172 students, 31% FRL); Pilgrim High School (math 20% / reading 48%, grade F, #29 of 58 statewide, top 49%, 1,147 students, 32% FRL).
- Market conditions: 70 active listings in the ZIP; 8 comparable units currently listed for rent nearby; rentals at typical pace (median 19d on market — plan ~3-4 weeks tenant-placement turnaround); 471 units permitted in Kent County in 2024 (240 in 5+ unit buildings).
Forward outlook
- Local home prices are declining (-3.0%/yr); year-one equity from $1k of loan paydown is wiped out by about $6k of value loss. Plan a longer hold.
- Kent County population projected at -14% by 2050 — secular population decline; favor cash flow + early exit over multi-decade hold.
Negotiation context
- It's been on market 17 days — a 2% lower offer ($196k) is reasonable based on typical stale-listing flexibility.
Risks & watch-outs
- Watch-outs: HOA is 20% of rent; built in 1925 — expect roof / HVAC / electrical / plumbing capex.
- Climate carrying-cost: major wind risk, 74% chance of damaging wind over 30y; extreme-heat days projected 7→15/yr by 2055 (HVAC capex compounding) — expect insurance premiums to compound above CPI over the hold.
Questions for the listing agent
- Built in 1925 — when were the roof, HVAC, electrical panel, plumbing, and water heater last replaced?
- What does the HOA fee cover, when was the last increase, and are there any pending special assessments or reserve-fund shortfalls?
- Is there a deadline driving the sale (1031 exchange, divorce, estate, relocation)? That informs how much negotiation room exists.
- Schools are D-rated, which usually means shorter tenancies and higher turnover. Who's the typical renter profile here, and what's been the actual vacancy rate?
- What's the average days-on-market for RENTAL listings here right now (not sales)? A rising rental-DOM trend means longer vacancies and softer asking-rent achievability than the comps imply.
- What's the recent tenant-quality profile in this submarket — average credit score on applications, eviction rate, late-payment / NSF rate, and stable-employment percentage? A property-management company in the area should have these aggregated.
- How much new for-sale + rental construction is in the pipeline within 1–3 miles? Heavy new supply typically softens prices + rents 12–24 months out; constrained supply supports both.
Investment metrics
- 1% rule
- 1.18% ✓
- Cap rate
- 6.59%
- Cash-on-cash
- 1.05%
- DSCR
- 1.05
- GRM
- 7.1
CMA / ARV
- ARV (on-the-fly)
- $302,640
- Comps found
- 6
Show comp detail 6 sales within ~0.75 mi
| Address | Dist | Beds/Ba | Sqft | Sold | Price | $/sf | Match |
|---|---|---|---|---|---|---|---|
| 375 Namquid Dr | 0.01mi | 1/1.0 | 764 (-2%) | 1mo | $275,000 | $360 | 96 |
| 68 Lane 5 | 0.19mi | 1/1.0 | 863 (+11%) | 1mo | $250,000 | $290 | 72 |
| 48 Lane 5 | 0.17mi | 2/1.0 (+1) | 742 (-4%) | 10mo | $272,000 | $367 | 72 |
| 109 Namquid Dr | 0.40mi | 1/1.0 | 792 (+2%) | 11mo | $389,000 | $491 | 68 |
| 50 Lane 1 St | 0.06mi | 2/1.5 (+1) | 680 (-12%) | 10mo | $265,000 | $390 | 61 |
| 243 Namquid Dr | 0.24mi | 2/1.0 (+1) | 880 (+13%) | 21mo | $562,000 | $639 | 44 |
Match score weights: distance 35% · size 25% · config 20% · recency 20%. Top-matched comps best support the ARV.
Projected returns pro-forma
-3.0% appreciation · 3.0% rent growth · sell at horizon
- IRR
- -14.4%
- Equity multiple
- 0.48×
- Total profit
- $-28,833
- Equity at exit
- $29,672
- IRR
- -5.4%
- Equity multiple
- 0.64×
- Total profit
- $-19,882
- Equity at exit
- $17,206
Cash invested: $55,720 (down + closing). Projections, not guarantees.
Landlord ↔ Tenant lean methodology
- Overall (STATE)
- 31 Tenant-Leaning
- State Rhode Island
- 31 Tenant-Leaning · D+8
- County
- — inherits STATE
- City
- — inherits STATE
ZIP-level market 02888
- Active inventory
- 70
- Price-to-rent
- 7.1×
Monthly cashflow live
- Estimated rent
- $2,345 high interval (Pro) →
- Mortgage (P&I)
- −$1,044
- Tax from tax record
- −$202 /mo · $2,430/yr
- Insurance
- −$83
- HOA
- −$475
- Vacancy / Maint / Mgmt
- −$493
- Net cashflow
- $49
Break-even live
Sensitivity live
| Price | -10% $162 | -5% $105 | +0% $49 | +5% $-7 | +10% $-64 |
|---|---|---|---|---|---|
| Rent | -10% $-136 | -5% $-44 | +0% $49 | +5% $142 | +10% $234 |
| Rate | -1.0pp $149 | -0.5pp $100 | base $49 | +0.5pp $-3 | +1.0pp $-55 |
UW: 25.0% down · 7.5% · 30yr · 1.5% tax · 5.0% vac · 8.0% maint · 8.0% mgmt
Financing live
Cash to close
- Down payment
- $49,750
- Closing costs
- $5,970
- Reserves months
- —
- Total cash needed
- —
Loan-product check · same deal, 3 products live
Conventional
25% down · 7.5% · 30yr
- Down + closing
- —
- Monthly P&I
- —
- Monthly cashflow
- —
- DSCR
- —
- Eligible?
- —
Personal DTI + credit; lowest rate.
DSCR
20% down · 8.5% · 30yr
- Down + closing
- —
- Monthly P&I
- —
- Monthly cashflow
- —
- DSCR
- —
- Eligible?
- —
No personal income docs; deal must DSCR.
Hard money
10% down · 12.0% · 12mo
- Down + closing
- —
- Monthly P&I
- —
- Monthly cashflow
- —
- DSCR
- —
- Eligible?
- —
Short-term bridge; refi at stabilization.
Rent comps 8 comps
| Address | Beds | Baths | Sqft | Rent | $/sqft | DOM | Units | Dist |
|---|---|---|---|---|---|---|---|---|
| 400 Narragansett Pkwy Warwick, RI | 2.0 | 1.0–1.5 | 776 | $2,348 | $3.03 | 25d | 2 | 0.74mi |
| 400 Narragansett Pkwy Unit EI2 Warwick, RI | 2.0 | 1.5 | 1002 | $2,800 | $2.79 | 3d | 1 | 0.74mi |
| 5 Shippen Ave Warwick, RI | 2.0 | 1.0 | 1111 | $2,500 | $2.25 | 25d | 1 | 1.13mi |
| 126 Washington St Unit 1 Warwick, RI | 2.0 | 1.0 | 840 | $2,000 | $2.38 | 19d | 1 | 1.24mi |
| 200 Post Rd #416 Warwick, RI | 2.0 | 1.0 | 932 | $2,500 | $2.68 | 3d | 1 | 1.36mi |
| 200 Post Rd Warwick, RI | 1.0–2.0 | 1.0–1.5 | 1016 | $1,900 | $1.87 | 13d | 2 | 1.36mi |
| 0 W Shore Rd Warwick, RI | 1.0 | 1.0 | 650 | $1,550 | $2.38 | 45d | 1 | 1.36mi |
| 126 Riverside Dr Unit 1 Riverside, RI | 2.0 | 1.0 | 1060 | $3,000 | $2.83 | 3d | 1 | 1.46mi |
HOA detail
- Monthly dues
- $475 · $5,700/yr
- Likely covers
- sewergas
Listing history 7 events
-
2026-06-18status $199,000 Pending 17 DOM
-
2026-06-17remarks 699-char remark
-
2026-06-17days on market $199,000 Active 17 DOM
-
2026-06-16days on market $199,000 Active 16 DOM
-
2026-06-15days on market $199,000 Active 15 DOM
-
2026-06-13statusdays on market $199,000 Active 13 DOM
-
2026-05-19$199,000 Active
ⓘ Source: listings_history table (triggers on properties + properties_extension) + one-shot
backfill from property_details.listing_events for pre-trigger history.
Tax reassessment forecast RI · Partial reset (capped growth)
- Current annual tax
- $2,430 · $202/mo
- Projected year-2 tax
- $2,837 · $236/mo
- Expected delta
- +$407/yr (+$34/mo · 16.7%)
ⓘ Screening estimate from a state-policy table — verify with the county assessor before closing.
Climate risk First Street
- Flood 1/10 Low FEMA zone X (unshaded) · 0% chance over 30 yrs
- Wildfire 1/10 Low
- Heat 5/10 Major 7 d/yr ≥96°F today · 15 d/yr by 30 yrs out
- Wind 6/10 Major 74% chance of damaging wind over 30 yrs
- Air quality 2/10 Low 2 unhealthy d/yr today · 2 by 30 yrs out
Nearby sold comps map
Loading sold comps map…
Walkable amenities ~0.75 mi
Loading nearby amenities…
Taxation est. · year 1
- Rental income
- $28,145
- − Mortgage interest
- −$11,147
- − Property taxes
- −$2,430
- − Insurance
- −$995
- − Repairs & maintenance
- −$2,252
- − Management
- −$2,252
- − HOA
- −$5,700
- − Depreciation
- −$5,789
- Taxable loss
- −$2,419
- Est. tax savings @ 24.0%
- +$581
- After-tax cash flow
- $1,167/yr
For passive investors: Depreciation is non-cash, so a rental often shows a tax loss while cash-flowing — sheltering income. Rental losses are passive: they offset passive income freely, and up to $25,000/yr can offset ordinary (W-2) income if you actively participate and your MAGI is under $100k (phasing out to $0 by $150k); unused losses carry forward. On sale, claimed depreciation is recaptured at up to 25%, and gains may owe capital-gains tax (a 1031 exchange can defer both). Figures are a year-1 estimate at your 24.0% rate — not tax advice; consult a CPA.
Schools (NCES district)
- District
- Warwick
- NCES district ID
- 4401110
- Math proficiency
- 15% ▼ -11.00%
- Reading proficiency
- 32% ▼ -7.00%
- Median HH income
- $63,420
- Composite
- 22.03/100
- National rank
- #8203
- State rank
- #25 of 39 in RI
Livability — Warwick
- Score
- 78/100
- State rank
- #6
- US rank
- #2425
Category grades
Schools grade is shown separately in the Schools card above.
Census & demographics
- Census place
- Warwick, RI
- City population
- 108,434
- Population (ZIP)
- 18,951
Population outlook (Kent County) Hauer SSP2
- Today (2025)
- 160,994 people
- By 2030
- 157,428 · -2.2%
- By 2040
- 148,389 · -7.8%
- By 2050
- 137,995 · -14.3%
- By 2075
- 118,536 · -26.4%
- By 2100
- 102,266 · -36.5%
Race, ethnicity, and origin ACS 2023
- Neighborhood character
- Predominantly White (81%)
- Race & ethnicity
- White 81% Two or more races 7% Black 6% Hispanic / Latino 6% Asian 1%
- Hispanic origin (detail)
- Puerto Rican 2% Dominican 2%
- Common ancestry
- Russian 10% Lithuanian 6% Romanian 3%
- Foreign-born
- 7% · Canada
- Languages at home
- 91% English-only · Spanish 3% Other Indo-European 2% French/Haitian/Cajun 2%
Political lean MEDSL · Kent
- 2024 margin
- Toss-up / Even · D 49.9% · R 48.1% · Other 2.0%
- 2008→2024 swing
- -15.6pp toward R · 2008: 17.5pp · 2024: 1.9pp
- All cycles
- 2024: D+1.9 2020: D+7.6 2016: R+0.7 2012: D+18.4 2008: D+17.5
Not yet ingested
- Civics
- —
Market trends
- HPI YoY
- ▼ -570.87%
- Current HPI
- 371.5696
- Rent YoY
- —
- Metro
- —
- State GDP YoY
- ▲ 2.25%
- F500 in state
- 10
Industry mix (Fortune 500 HQ in RI)
| Industry | F500 HQs | Revenue |
|---|---|---|
| Healthcare | 1 | $373B |
|
||
| Food Distribution | 1 | $31B |
|
||
| Aerospace / Defense | 1 | $14B |
|
||
| Financial Services | 1 | $8B |
|
||
| Consumer Goods | 1 | $4B |
|
||
Price history
1 event — show timeline
- 2026-05-19 Listed $199,000 RIS
Property tax history
+7.4%/yrLatest (2025): $2,430 · +52.0% YoY. Source: county tax records.
Cash-flow waterfall
monthlySold comps — $/sqft
last 12 mo · ≤1 miLoading sold comps…