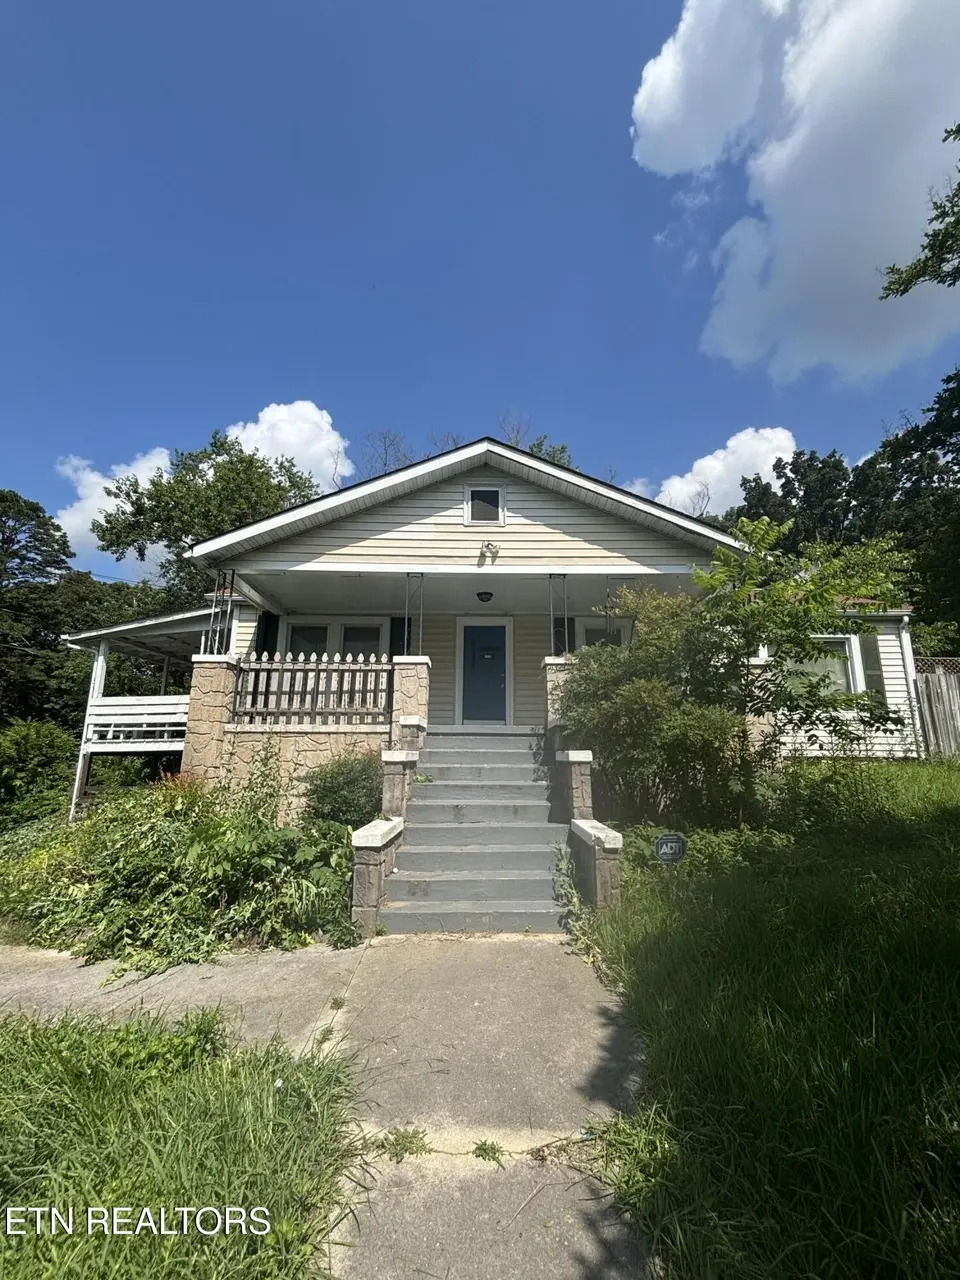
473 Church Dr · Lenoir City, TN
Flood risk 1/10 · Minimal
- FEMA flood zone
- X (unshaded)
- Chance of flooding over 30 yrs
- 0.0%
- Est. flood insurance / yr
- $473 – $860
Fire risk 3/10 · Minor
- Est. fire insurance / yr
- $949 – $1,763
Heat risk 5/10 · Moderate
- Hot days now (above 104°F)
- 7 days/yr
- Hot days in 30 yrs
- 18 days/yr
Wind risk 2/10 · Minimal
- Chance of severe wind over 30 yrs
- 1.0%
Air-quality risk 3/10 · Minor
- Unhealthy air days now
- 2 days/yr
- Unhealthy air days in 30 yrs
- 2 days/yr
Risk factors via First Street. Map © Google.
Why this score? — see what drove the C+ grade
The composite is a weighted blend of 9 inputs, each scored 0–100. Each bar is that input's sub-score; the figure is the points it added to the 100-point composite (weight × sub-score).
- Cash flow +22.9/30.0
- ARV discount +15.0/15.0
- DSCR +7.4/10.0
- 1% rule +4.9/10.0
- Livability +3.1/5.0
- Rent growth +2.5/5.0
- Condition / age +2.5/5.0
- Schools +2.0/10.0
- Appreciation +0.0/10.0
$259,000
🖨 Deal sheet 📄 Offer letter ✓ Due diligence
Listing remarks MLS
Unique charmer with an incredible outdoor experience awaits for you. Enjoy the blessings of multiple covered porches that accent this beautiful Lenoir City landmark. Main level living offers a primary bedroom with a full ensuite and wonderful clawfoot tub. A fully finished living area downstairs makes for an additional living space with a living room, bedroom, office and full bathroom. Outside offers a covered back porch and an In-Ground pool!
Key facts
- Huge lot
- 0.73 acre lot
- 2 garage spots
Tags
Property features AI
Exterior
- Parking: Detached 2-car garage; 4-car carport
- Utilities: Public sewer
- Home design: Not attached to other properties; Total building area ~2,508 (source: tax records)
- Construction: Stone, vinyl siding and frame construction
- Exterior features: Corner lot; Storage structure; Other view
Interior
- Kitchen: Dishwasher; Disposal; Microwave
- Flooring: Laminate flooring; Carpet
- Bathrooms: 3 full bathrooms
- Heating & cooling: Central heating (electric); Central cooling
- Interior features: Breakfast bar; Finished basement; Basement plumbed; Fireplace (other type)
Neighborhood map
What this means for you Summary
Snapshot
- This is a 4-bed/3.0-bath single-family listed at $259k.
Deal economics
- At list price, monthly cash flow is $455 ($5k/yr) — positive.
- The deal already cash-flows at list — no discount required.
- To meet the 1% rule (rent ≥ 1% of price), the offer needs to be $258k (0.5% below list).
- Recommended offer: $258k (0.5% below list) — sets the bar for 1% rule.
- Cap rate 8.4% vs local median 2.9% in Lenoir City — top-decile yield for the area; either an underpriced asset or a hidden risk that comps aren't pricing in. Stress-test before assuming the spread holds.
Location & tenants
- Location reads 62/100 on livability (#221 in TN) — a middle-class / working-renter tenant base. Strengths: cost of living A+, housing A+; Watch: schools D, employment D, amenities F.
- Lenoir City (suburban): math 24% / reading 24% proficiency, ranked #98 of 139 in TN (top 70%) — low school quality limits family demand, transient renter base, plan for 1-2y turnover; 65% free/reduced lunch — lower-income household profile, screen leases tightly.
- Market conditions: 148 active listings in the ZIP; 3 comparable units currently listed for rent nearby; rentals at typical pace (median 19d on market — plan ~3-4 weeks tenant-placement turnaround); 608 units permitted in Loudon County in 2024 (0 in 5+ unit buildings).
- At $2,577/mo this rent would consume 46% of the median local household income ($67k/yr) (locally 458% of renters already pay >50% of income on rent) — very limited rent-growth headroom before tenants either downsize or default.
Forward outlook
- Local home prices are declining (-3.0%/yr); year-one equity from $2k of loan paydown is wiped out by about $8k of value loss. Plan a longer hold.
- Loudon County population projected at +17% by 2050 — long-run rental-demand tailwind backs the buy-and-hold thesis.
Negotiation context
- Only 6 days on market — expect competitive offers; lowballing is unlikely to land.
- 4 sale attempts since 20y ago; this cycle's ask has dropped $16k (6%) from the opening price — seller is motivated, your offer sets the floor, not the list.
Risks & watch-outs
- Watch-outs: built in 1949 — expect roof / HVAC / electrical / plumbing capex.
- Climate carrying-cost: extreme-heat days projected 7→18/yr by 2055 (HVAC capex compounding) — expect insurance premiums to compound above CPI over the hold.
Questions for the listing agent
- Built in 1949 — when were the roof, HVAC, electrical panel, plumbing, and water heater last replaced?
- Is there a deadline driving the sale (1031 exchange, divorce, estate, relocation)? That informs how much negotiation room exists.
- Schools are D-rated, which usually means shorter tenancies and higher turnover. Who's the typical renter profile here, and what's been the actual vacancy rate?
- What's the average days-on-market for RENTAL listings here right now (not sales)? A rising rental-DOM trend means longer vacancies and softer asking-rent achievability than the comps imply.
- What's the recent tenant-quality profile in this submarket — average credit score on applications, eviction rate, late-payment / NSF rate, and stable-employment percentage? A property-management company in the area should have these aggregated.
- How much new for-sale + rental construction is in the pipeline within 1–3 miles? Heavy new supply typically softens prices + rents 12–24 months out; constrained supply supports both.
Investment metrics
- 1% rule
- 0.99% ✗
- Cap rate
- 8.40%
- Cash-on-cash
- 7.54%
- DSCR
- 1.34
- GRM
- 8.4
CMA / ARV
- ARV (on-the-fly)
- $514,140
- Comps found
- 12
Show comp detail 12 sales within ~0.75 mi
| Address | Dist | Beds/Ba | Sqft | Sold | Price | $/sf | Match |
|---|---|---|---|---|---|---|---|
| 1340 Hillside Ln | 0.23mi | 3/2.5 (-1) | 2,556 (+2%) | 1mo | $530,000 | $207 | 78 |
| 210 English Oak Ln | 0.42mi | 4/3.0 | 2,544 (+1%) | 4mo | $510,000 | $200 | 75 |
| 341 Sugar Maple Trail (lot 95) | 0.54mi | 4/3.0 | 2,344 (-6%) | 2mo | $469,900 | $200 | 62 |
| 328 Sugar Maple Trail (lot 121) | 0.54mi | 4/3.0 | 2,344 (-6%) | 3mo | $474,990 | $203 | 61 |
| 288 Sugar Maple Trail (lot 119) | 0.57mi | 4/3.0 | 2,344 (-6%) | 2mo | $474,900 | $203 | 61 |
| 161 Sugar Maple Trail (lot 110) | 0.62mi | 4/3.0 | 2,344 (-6%) | 1mo | $470,900 | $201 | 59 |
| 492 Glenshire Ln | 0.55mi | 3/2.5 (-1) | 2,400 (-4%) | 3mo | $505,000 | $210 | 58 |
| 125 Sugar Maple Trail (lot 113) | 0.62mi | 4/3.0 | 2,344 (-6%) | 3mo | $487,834 | $208 | 58 |
| 185 Sugar Maple Trail (lot 108) | 0.62mi | 4/3.5 | 2,344 (-6%) | 1mo | $469,900 | $200 | 58 |
| 245 Sugar Maple Trail (lot 103) | 0.61mi | 4/3.5 | 2,344 (-6%) | 2mo | $479,900 | $205 | 56 |
| 293 Sugar Maple Trl | 0.59mi | 5/2.5 (+1) | 2,339 (-7%) | 3mo | $510,000 | $218 | 52 |
| 159 Silver Maple St | 0.52mi | 4/3.0 | 2,847 (+14%) | 4mo | $665,000 | $234 | 50 |
Match score weights: distance 35% · size 25% · config 20% · recency 20%. Top-matched comps best support the ARV.
Projected returns pro-forma
-3.0% appreciation · 3.0% rent growth · sell at horizon
- IRR
- -4.8%
- Equity multiple
- 0.82×
- Total profit
- $-13,055
- Equity at exit
- $38,618
- IRR
- 4.8%
- Equity multiple
- 1.35×
- Total profit
- $25,613
- Equity at exit
- $22,394
Cash invested: $72,520 (down + closing). Projections, not guarantees.
Landlord ↔ Tenant lean methodology
- Overall (STATE)
- 87 Strongly Landlord-Friendly
- State Tennessee
- 87 Strongly Landlord-Friendly · R+13
- County
- — inherits STATE
- City
- — inherits STATE
ZIP-level market 37771
- Home prices YoY
- -14.6%
- Active inventory
- 148
- Price-to-rent
- 8.4×
Monthly cashflow live
- Estimated rent
- $2,577 medium interval (Pro) →
- Mortgage (P&I)
- −$1,358
- Tax from tax record
- −$114 /mo · $1,368/yr
- Insurance
- −$108
- HOA
- −$0
- Vacancy / Maint / Mgmt
- −$541
- Net cashflow
- $455
Break-even live
UW: 25.0% down · 7.5% · 30yr · 1.5% tax · 5.0% vac · 8.0% maint · 8.0% mgmt
Financing live
Cash to close
- Down payment
- $64,750
- Closing costs
- $7,770
- Reserves months
- —
- Total cash needed
- —
Loan-product check · same deal, 3 products live
Conventional
25% down · 7.5% · 30yr
- Down + closing
- —
- Monthly P&I
- —
- Monthly cashflow
- —
- DSCR
- —
- Eligible?
- —
Personal DTI + credit; lowest rate.
DSCR
20% down · 8.5% · 30yr
- Down + closing
- —
- Monthly P&I
- —
- Monthly cashflow
- —
- DSCR
- —
- Eligible?
- —
No personal income docs; deal must DSCR.
Hard money
10% down · 12.0% · 12mo
- Down + closing
- —
- Monthly P&I
- —
- Monthly cashflow
- —
- DSCR
- —
- Eligible?
- —
Short-term bridge; refi at stabilization.
Rent comps 3 comps
| Address | Beds | Baths | Sqft | Rent | $/sqft | DOM | Units | Dist |
|---|---|---|---|---|---|---|---|---|
| 251 Edinburgh Dr Lenoir City, TN | 3.0 | 2.0 | 1908 | $2,450 | $1.28 | 19d | 1 | 0.80mi |
| 116 Kaley Ln Lenoir City, TN | 4.0 | 2.5 | 2072 | $2,500 | $1.21 | 2d | 1 | 0.82mi |
| 112 Kaley Ln Lenoir City, TN | 4.0 | 2.5 | 2804 | $2,800 | $1.00 | 43d | 1 | 0.83mi |
Listing history 7 events
-
2026-06-18price $259,000 Active 6 DOM
-
2026-06-18days on market $275,000 Active 6 DOM
-
2026-06-17days on market $275,000 Active 5 DOM
-
2026-06-16days on market $275,000 Active 4 DOM
-
2026-06-15days on market $275,000 Active 3 DOM
-
2026-06-13remarks 179-char remark
-
2026-06-13$275,000 Active 1 DOM
ⓘ Source: listings_history table (triggers on properties + properties_extension) + one-shot
backfill from property_details.listing_events for pre-trigger history.
Tax reassessment forecast TN · Resets to sale price
- Current annual tax
- $1,368 · $114/mo
- Projected year-2 tax
- $1,839 · $153/mo
- Expected delta
- +$471/yr (+$39/mo · 34.4%)
ⓘ Screening estimate from a state-policy table — verify with the county assessor before closing.
Climate risk First Street
- Flood 1/10 Low FEMA zone X (unshaded) · 0% chance over 30 yrs
- Wildfire 3/10 Moderate
- Heat 5/10 Major 7 d/yr ≥104°F today · 18 d/yr by 30 yrs out
- Wind 2/10 Low 100% chance of damaging wind over 30 yrs
- Air quality 3/10 Moderate 2 unhealthy d/yr today · 2 by 30 yrs out
Nearby sold comps map
Loading sold comps map…
Walkable amenities ~0.75 mi
Loading nearby amenities…
Taxation est. · year 1
- Rental income
- $30,919
- − Mortgage interest
- −$14,508
- − Property taxes
- −$1,368
- − Insurance
- −$1,295
- − Repairs & maintenance
- −$2,474
- − Management
- −$2,474
- − Depreciation
- −$7,535
- Taxable income
- $1,267
- Est. tax owed @ 24.0%
- −$304
- After-tax cash flow
- $5,161/yr
For passive investors: Depreciation is non-cash, so a rental often shows a tax loss while cash-flowing — sheltering income. Rental losses are passive: they offset passive income freely, and up to $25,000/yr can offset ordinary (W-2) income if you actively participate and your MAGI is under $100k (phasing out to $0 by $150k); unused losses carry forward. On sale, claimed depreciation is recaptured at up to 25%, and gains may owe capital-gains tax (a 1031 exchange can defer both). Figures are a year-1 estimate at your 24.0% rate — not tax advice; consult a CPA.
Schools (NCES district)
- District
- Lenoir City
- NCES district ID
- 4702400
- Math proficiency
- 24% ▼ -16.00%
- Reading proficiency
- 24% ▼ -9.00%
- Median HH income
- $36,181
- Composite
- 19.91/100
- National rank
- #8683
- State rank
- #98 of 139 in TN
Livability — Lenoir City
- Score
- 62/100
- State rank
- #221
- US rank
- #16577
Category grades
Schools grade is shown separately in the Schools card above.
Census & demographics
- Census place
- Lenoir City, TN
- County
- Loudon County · 54,472 people
- City population
- 32,688
- Metro
- Knoxville, TN
- Population (ZIP)
- 18,042
- Household income
- $66,938
- Rent vs Own
- Severe rent burden
- 458.0
Population outlook (Loudon County) Hauer SSP2
- Today (2025)
- 55,364 people
- By 2030
- 57,414 · +3.7%
- By 2040
- 61,216 · +10.6%
- By 2050
- 64,846 · +17.1%
- By 2075
- 75,829 · +37.0%
- By 2100
- 85,693 · +54.8%
Race, ethnicity, and origin ACS 2023
- Neighborhood character
- Predominantly White (82%)
- Race & ethnicity
- White 82% Hispanic / Latino 15% Two or more races 11% Black 1%
- Hispanic origin (detail)
- Mexican 10% Puerto Rican 1%
- Common ancestry
- Serbian 2% Slovak 2% Lithuanian 1%
- Foreign-born
- 7% · Canada, Jamaica
- Languages at home
- 90% English-only · Spanish 9% Other Indo-European 1%
Political lean MEDSL · Loudon
- 2024 margin
- Solid R (+53.0) · D 23.0% · R 76.0% · Other 1.1%
- 2008→2024 swing
- -9.0pp toward R · 2008: -44.0pp · 2024: -53.0pp
- All cycles
- 2024: R+53.0 2020: R+50.3 2016: R+54.4 2012: R+52.8 2008: R+44.0
Not yet ingested
- Civics
- —
Market trends
- HPI YoY
- ▼ -59.66%
- Current HPI
- 350.3849
- Rent YoY
- —
- Metro
- Knoxville, TN
- State GDP YoY
- ▲ 2.78%
- F500 in state
- 22
Industry mix (Fortune 500 HQ in TN)
| Industry | F500 HQs | Revenue |
|---|---|---|
| Healthcare | 3 | $91B |
|
||
| Retail | 3 | $72B |
|
||
| Transportation / Logistics | 1 | $88B |
|
||
| Paper / Packaging | 1 | $19B |
|
||
| Insurance | 1 | $13B |
|
||
| Energy | 1 | $12B |
|
||
Price history
+400.9% since first listed10 events — show timeline
- 2026-06-12 Listed $275,000 Knoxville MLS
- 2022-03-04 Sold (Public Records) $302,000 Public Records
- 2022-03-02 Sold (MLS) $302,000 Knoxville MLS
- 2022-01-14 Pending — Knoxville MLS
- 2022-01-11 Price Changed $299,500 Knoxville MLS
- 2021-12-22 Listed $325,000 Knoxville MLS
- 2007-03-09 Sold (Public Records) $165,000 Public Records
- 2007-03-02 Sold (MLS) $165,000 Knoxville MLS
- 2006-09-30 Listed $173,900 Knoxville MLS
- 2006-06-29 Listed $54,900 Knoxville MLS
Property tax history
+2.3%/yrLatest (2025): $1,368 · +0.0% YoY. Source: county tax records.
Cash-flow waterfall
monthlySold comps — $/sqft
last 12 mo · ≤1 miLoading sold comps…