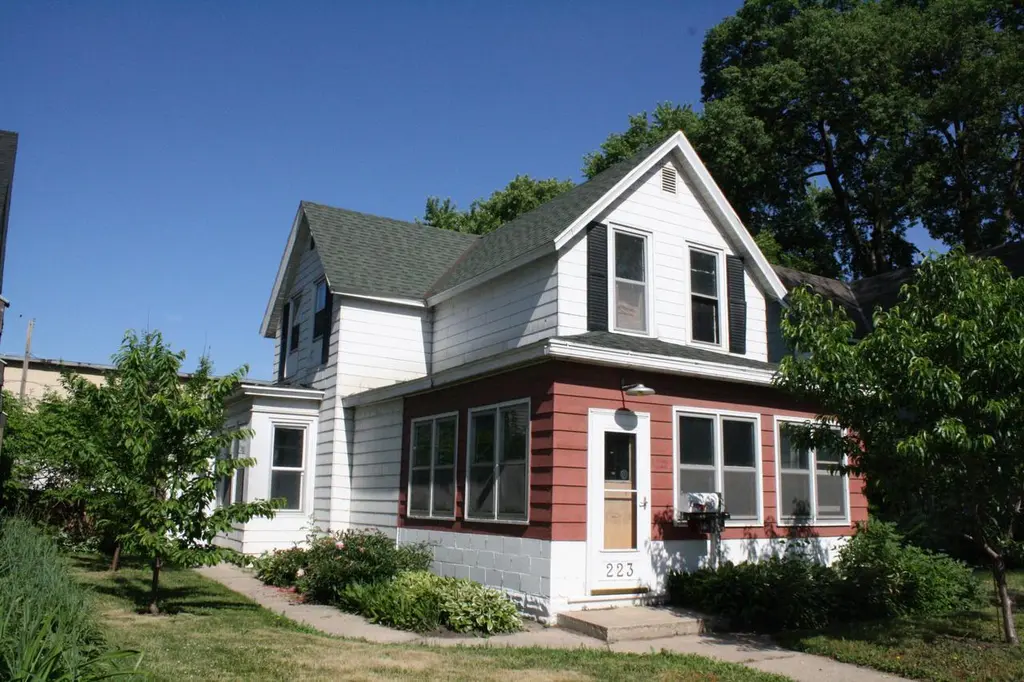
223 Copeland Ave · La Crosse, WI
Flood risk 3/10 · Minor
- FEMA flood zone
- X (shaded)
- Chance of flooding over 30 yrs
- 0.17%
- Est. flood insurance / yr
- $473 – $860
Fire risk 1/10 · Minimal
- Est. fire insurance / yr
- $636 – $1,182
Heat risk 3/10 · Minor
- Hot days now (above 100°F)
- 7 days/yr
- Hot days in 30 yrs
- 14 days/yr
Wind risk 2/10 · Minimal
- Chance of severe wind over 30 yrs
- —
Air-quality risk 1/10 · Minimal
- Unhealthy air days now
- 0 days/yr
- Unhealthy air days in 30 yrs
- 0 days/yr
Risk factors via First Street. Map © Google.
Why this score? — see what drove the C+ grade
The composite is a weighted blend of 9 inputs, each scored 0–100. Each bar is that input's sub-score; the figure is the points it added to the 100-point composite (weight × sub-score).
- Cash flow +24.4/30.0
- ARV discount +13.1/15.0
- DSCR +7.9/10.0
- 1% rule +6.5/10.0
- Livability +3.5/5.0
- Schools +2.7/10.0
- Rent growth +2.5/5.0
- Condition / age +2.5/5.0
- Appreciation +0.0/10.0
$170,000
🖨 Deal sheet 📄 Offer letter ✓ Due diligence
Listing remarks
Stately 2 story home w/ 3 card heated garage. Enjoy your morning coffee on the front sitting porch. The main floor offers spacious living room, dining room, kitchen(appliances included), office/den plus laundry room. Don't miss the 3 well proportioned bedrooms upstairs. Additional features: some newer windows, full basement with newer furnace and water heater, fenced rear yard, 3 car heated garage and more.
Key facts
- Newer furnace
- Full basement
- Newer water heater
Tags
Property features AI
Exterior
- Parking: 1 additional parking space; Detached 3-car garage with opener and heated
- Utilities: Municipal water; Municipal sewer
- Home design: Single-family home; 2-story
- Construction: Year built per assessor/public record
- Exterior features: Fenced yard; Sidewalks
Interior
- Kitchen: Oven; Range; Refrigerator; Stove (included)
- Bedrooms: Master bedroom (upper level) — 14 x 13; Bedroom 2 (upper level) — 14 x 13; Bedroom 3 (upper level) — 13 x 8
- Flooring: Wood floors
- Bathrooms: Full bath with tub and shower over tub
- Heating & cooling: Forced air heating; Natural gas
- Interior features: Cable/satellite available; High-speed internet; Wood floors; Crawl space and full basement
- Laundry & utility: Washer/dryer not specified
Neighborhood map
What this means for you Summary
Snapshot
- This is a 4-bed/1.0-bath single-family listed at $170k.
Deal economics
- At list price, monthly cash flow is $346 ($4k/yr) — positive.
- The deal already cash-flows at list — no discount required.
- Meets the 1% rule at list price ($2k rent vs $170k).
- Recommended offer: $167k (1.5% below list) — sets the bar for market timing.
- Cap rate 8.7% vs local median 3.0% in La Crosse — top-decile yield for the area; either an underpriced asset or a hidden risk that comps aren't pricing in. Stress-test before assuming the spread holds.
Location & tenants
- Location reads 69/100 on livability (#339 in WI) — a middle-class / working-renter tenant base. Strengths: cost of living A+, housing A+; Watch: employment C-, schools D+, health & safety D.
- La Crosse School District (urban): math 29% / reading 34% proficiency, ranked #267 of 342 in WI (top 78%) — families likely to look elsewhere, expect single-tenant / working-renter base with shorter leases.
- Market conditions: 59 active listings in the ZIP; 5 comparable units currently listed for rent nearby; rentals lingering (median 44d on market — plan ~5-8 weeks vacancy on turnover, expect pricing pressure); 100% of comp listings sitting > 30 days — soft ceiling on asking rent; 268 units permitted in La Crosse County in 2024 (10 in 5+ unit buildings).
- At $1,952/mo this rent would consume 45% of the median local household income ($52k/yr) (locally 526% of renters already pay >50% of income on rent) — very limited rent-growth headroom before tenants either downsize or default.
Forward outlook
- Local home prices are declining (-3.0%/yr); year-one equity from $1k of loan paydown is wiped out by about $5k of value loss. Plan a longer hold.
- La Crosse County population projected at +14% by 2050 — modest demand growth; plan on rents tracking national, not racing it.
Negotiation context
- It's been on market 15 days — a 2% lower offer ($167k) is reasonable based on typical stale-listing flexibility.
Risks & watch-outs
- Watch-outs: built in 1885 — expect roof / HVAC / electrical / plumbing capex.
Questions for the listing agent
- Built in 1885 — when were the roof, HVAC, electrical panel, plumbing, and water heater last replaced?
- Is there a deadline driving the sale (1031 exchange, divorce, estate, relocation)? That informs how much negotiation room exists.
- Schools are D-rated, which usually means shorter tenancies and higher turnover. Who's the typical renter profile here, and what's been the actual vacancy rate?
- Crime grade is F in this area — have there been break-ins, vandalism, or insurance claims at this property in the last 3 years? What carrier currently insures it and at what premium?
- What's the average days-on-market for RENTAL listings here right now (not sales)? A rising rental-DOM trend means longer vacancies and softer asking-rent achievability than the comps imply.
- What's the recent tenant-quality profile in this submarket — average credit score on applications, eviction rate, late-payment / NSF rate, and stable-employment percentage? A property-management company in the area should have these aggregated.
- How much new for-sale + rental construction is in the pipeline within 1–3 miles? Heavy new supply typically softens prices + rents 12–24 months out; constrained supply supports both.
Investment metrics
- 1% rule
- 1.15% ✓
- Cap rate
- 8.73%
- Cash-on-cash
- 8.72%
- DSCR
- 1.39
- GRM
- 7.3
CMA / ARV
- ARV (on-the-fly)
- $194,280
- Comps found
- 6
Show comp detail 6 sales within ~0.75 mi
| Address | Dist | Beds/Ba | Sqft | Sold | Price | $/sf | Match |
|---|---|---|---|---|---|---|---|
| 1113 Liberty St | 0.74mi | 4/1.0 | 1,622 (+0%) | 6mo | $219,000 | $135 | 61 |
| 407 Avon St | 0.24mi | 3/1.0 (-1) | 1,853 (+14%) | 2mo | $180,000 | $97 | 58 |
| 625 St Cloud St | 0.45mi | 4/1.5 | 1,532 (-5%) | 18mo | $183,600 | $120 | 53 |
| 802 Kane St | 0.63mi | 4/1.0 | 1,486 (-8%) | 11mo | $100,000 | $67 | 48 |
| 713 Avon St | 0.42mi | 4/2.0 | 1,730 (+7%) | 24mo | $175,500 | $101 | 45 |
| 901 Avon St | 0.55mi | 3/1.0 (-1) | 1,413 (-13%) | 12mo | $200,000 | $142 | 38 |
Match score weights: distance 35% · size 25% · config 20% · recency 20%. Top-matched comps best support the ARV.
Projected returns pro-forma
-3.0% appreciation · 3.0% rent growth · sell at horizon
- IRR
- -3.1%
- Equity multiple
- 0.88×
- Total profit
- $-5,476
- Equity at exit
- $25,348
- IRR
- 6.7%
- Equity multiple
- 1.50×
- Total profit
- $23,770
- Equity at exit
- $14,698
Cash invested: $47,600 (down + closing). Projections, not guarantees.
Landlord ↔ Tenant lean methodology
- Overall (STATE)
- 73 Landlord-Friendly
- State Wisconsin
- 73 Landlord-Friendly · R+2
- County
- — inherits STATE
- City
- — inherits STATE
ZIP-level market 54603
- Active inventory
- 59
- Price-to-rent
- 7.3×
Monthly cashflow live
- Estimated rent
- $1,952 high interval (Pro) →
- Mortgage (P&I)
- −$891
- Tax from tax record
- −$234 /mo · $2,803/yr
- Insurance
- −$71
- HOA
- −$0
- Vacancy / Maint / Mgmt
- −$410
- Net cashflow
- $346
Break-even live
UW: 25.0% down · 7.5% · 30yr · 1.5% tax · 5.0% vac · 8.0% maint · 8.0% mgmt
Financing live
Cash to close
- Down payment
- $42,500
- Closing costs
- $5,100
- Reserves months
- —
- Total cash needed
- —
Loan-product check · same deal, 3 products live
Conventional
25% down · 7.5% · 30yr
- Down + closing
- —
- Monthly P&I
- —
- Monthly cashflow
- —
- DSCR
- —
- Eligible?
- —
Personal DTI + credit; lowest rate.
DSCR
20% down · 8.5% · 30yr
- Down + closing
- —
- Monthly P&I
- —
- Monthly cashflow
- —
- DSCR
- —
- Eligible?
- —
No personal income docs; deal must DSCR.
Hard money
10% down · 12.0% · 12mo
- Down + closing
- —
- Monthly P&I
- —
- Monthly cashflow
- —
- DSCR
- —
- Eligible?
- —
Short-term bridge; refi at stabilization.
Rent comps 5 comps
| Address | Beds | Baths | Sqft | Rent | $/sqft | DOM | Units | Dist |
|---|---|---|---|---|---|---|---|---|
| 109 Copeland Ave La Crosse, WI | 4.0 | 1.0 | 1280 | $1,795 | $1.40 | 43d | 1 | 0.17mi |
| 55 River Bend Rd Apt 302 La Crosse, WI | 3.0 | 2.0 | 1246 | $2,950 | $2.37 | 43d | 1 | 0.48mi |
| 55 River Bend Rd Apt 608 La Crosse, WI | 3.0 | 2.0 | 1183 | $2,850 | $2.41 | 43d | 1 | 0.48mi |
| 625 12th St N La Crosse, WI | 5.0 | 1.0 | 1200 | $2,125 | $1.77 | 43d | 1 | 0.96mi |
| 1346 George St #1348 La Crosse, WI | 3.0 | 1.0 | 1080 | $995 | $0.92 | 43d | 1 | 1.03mi |
Listing history 14 events
-
2026-06-19days on market $170,000 Active 15 DOM
-
2026-06-18days on market $170,000 Active 14 DOM
-
2026-06-17days on market $170,000 Active 13 DOM
-
2026-06-16days on market $170,000 Active 12 DOM
-
2026-06-15price $170,000 Active 11 DOM
-
2026-06-15days on market $180,000 Active 11 DOM
-
2026-06-14days on market $180,000 Active 9 DOM
-
2026-06-13days on market $180,000 Active 8 DOM
-
2026-06-10days on market $180,000 Active 6 DOM
-
2026-06-09days on market $180,000 Active 5 DOM
-
2026-06-08days on market $180,000 Active 4 DOM
-
2026-06-07days on market $180,000 Active 3 DOM
-
2026-06-05remarks 410-char remark
-
2026-06-05$180,000 Active 1 DOM
ⓘ Source: listings_history table (triggers on properties + properties_extension) + one-shot
backfill from property_details.listing_events for pre-trigger history.
Tax reassessment forecast WI · Partial reset (capped growth)
- Current annual tax
- $2,803 · $234/mo
- Projected year-2 tax
- $2,974 · $248/mo
- Expected delta
- +$171/yr (+$14/mo · 6.1%)
ⓘ Screening estimate from a state-policy table — verify with the county assessor before closing.
Climate risk First Street
- Flood 3/10 Moderate FEMA zone X (shaded) · 17% chance over 30 yrs
- Wildfire 1/10 Low
- Heat 3/10 Moderate 7 d/yr ≥100°F today · 14 d/yr by 30 yrs out
- Wind 2/10 Low
- Air quality 1/10 Low 0 unhealthy d/yr today · 0 by 30 yrs out
Nearby sold comps map
Loading sold comps map…
Walkable amenities ~0.75 mi
Loading nearby amenities…
Taxation est. · year 1
- Rental income
- $23,419
- − Mortgage interest
- −$9,523
- − Property taxes
- −$2,803
- − Insurance
- −$850
- − Repairs & maintenance
- −$1,874
- − Management
- −$1,874
- − Depreciation
- −$4,945
- Taxable income
- $1,551
- Est. tax owed @ 24.0%
- −$372
- After-tax cash flow
- $3,778/yr
For passive investors: Depreciation is non-cash, so a rental often shows a tax loss while cash-flowing — sheltering income. Rental losses are passive: they offset passive income freely, and up to $25,000/yr can offset ordinary (W-2) income if you actively participate and your MAGI is under $100k (phasing out to $0 by $150k); unused losses carry forward. On sale, claimed depreciation is recaptured at up to 25%, and gains may owe capital-gains tax (a 1031 exchange can defer both). Figures are a year-1 estimate at your 24.0% rate — not tax advice; consult a CPA.
Schools (NCES district)
- District
- La Crosse School District
- NCES district ID
- 5507530
- Math proficiency
- 29% ▼ -8.00%
- Reading proficiency
- 34% ▼ -4.00%
- Median HH income
- $42,924
- Composite
- 26.76/100
- National rank
- #7135
- State rank
- #267 of 342 in WI
Livability — La Crosse
- Score
- 69/100
- State rank
- #339
- US rank
- #8671
Category grades
Schools grade is shown separately in the Schools card above.
Census & demographics
- Census place
- La Crosse, WI
- County
- La Crosse County · 89,439 people
- City population
- 64,135
- Metro
- La Crosse-Onalaska, WI-MN
- Population (ZIP)
- 13,738
- Household income
- $52,012
- Rent vs Own
- Severe rent burden
- 526.0
Population outlook (La Crosse County) Hauer SSP2
- Today (2025)
- 126,082 people
- By 2030
- 130,161 · +3.2%
- By 2040
- 137,231 · +8.8%
- By 2050
- 143,506 · +13.8%
- By 2075
- 160,149 · +27.0%
- By 2100
- 166,408 · +32.0%
Race, ethnicity, and origin ACS 2023
- Neighborhood character
- Predominantly White (84%)
- Race & ethnicity
- White 84% Two or more races 6% Asian 5% Hispanic / Latino 3% Black 2%
- Common ancestry
- Portuguese 14% Romanian 3% Lithuanian 2%
- Foreign-born
- 3% · China
- Languages at home
- 94% English-only · Other Asian/Pacific 5% Spanish 1%
Political lean MEDSL · La Crosse
- 2024 margin
- Lean D (+9.4) · D 54.0% · R 44.6% · Other 1.4%
- 2008→2024 swing
- -14.1pp toward R · 2008: 23.4pp · 2024: 9.4pp
- All cycles
- 2024: D+9.4 2020: D+13.5 2016: D+9.6 2012: D+17.3 2008: D+23.4
Not yet ingested
- Civics
- —
Market trends
- HPI YoY
- ▼ -166.91%
- Current HPI
- 270.8554
- Rent YoY
- —
- Metro
- La Crosse-Onalaska, WI-MN
- State GDP YoY
- ▲ 2.10%
- F500 in state
- 20
Industry mix (Fortune 500 HQ in WI)
| Industry | F500 HQs | Revenue |
|---|---|---|
| Industrial Machinery | 4 | $23B |
|
||
| Industrial Technology | 2 | $36B |
|
||
| Insurance | 1 | $36B |
|
||
| Professional Services | 1 | $19B |
|
||
| Utilities | 1 | $9B |
|
||
| Consumer Goods | 1 | $3B |
|
||
Price history
1 event — show timeline
- 2026-06-04 Listed $180,000 METROMLS
Property tax history
+1.8%/yrLatest (2025): $2,803 · +14.4% YoY. Source: county tax records.
Cash-flow waterfall
monthlySold comps — $/sqft
last 12 mo · ≤1 miLoading sold comps…