8401 S Kolb Rd #168 · Tucson, AZ
Flood risk 1/10 · Minimal
- FEMA flood zone
- X (unshaded)
- Chance of flooding over 30 yrs
- 0.0%
- Est. flood insurance / yr
- $507 – $1,088
Fire risk 6/10 · Moderate
- Est. fire insurance / yr
- $610 – $1,132
Heat risk 7/10 · Major
- Hot days now (above 104°F)
- 5 days/yr
- Hot days in 30 yrs
- 13 days/yr
Wind risk 1/10 · Minimal
- Chance of severe wind over 30 yrs
- —
Air-quality risk 1/10 · Minimal
- Unhealthy air days now
- 0 days/yr
- Unhealthy air days in 30 yrs
- 0 days/yr
Risk factors via First Street. Map © Google.
Why this score? — see what drove the B grade
The composite is a weighted blend of 9 inputs, each scored 0–100. Each bar is that input's sub-score; the figure is the points it added to the 100-point composite (weight × sub-score).
- Cash flow +30.0/30.0
- 1% rule +10.0/10.0
- DSCR +10.0/10.0
- ARV discount +7.5/15.0
- Schools +4.9/10.0
- Condition / age +3.8/5.0
- Livability +3.7/5.0
- Rent growth +2.9/5.0
- Appreciation +0.0/10.0
$50,000
🖨 Deal sheet 📄 Offer letter ✓ Due diligence
Listing remarks MLS
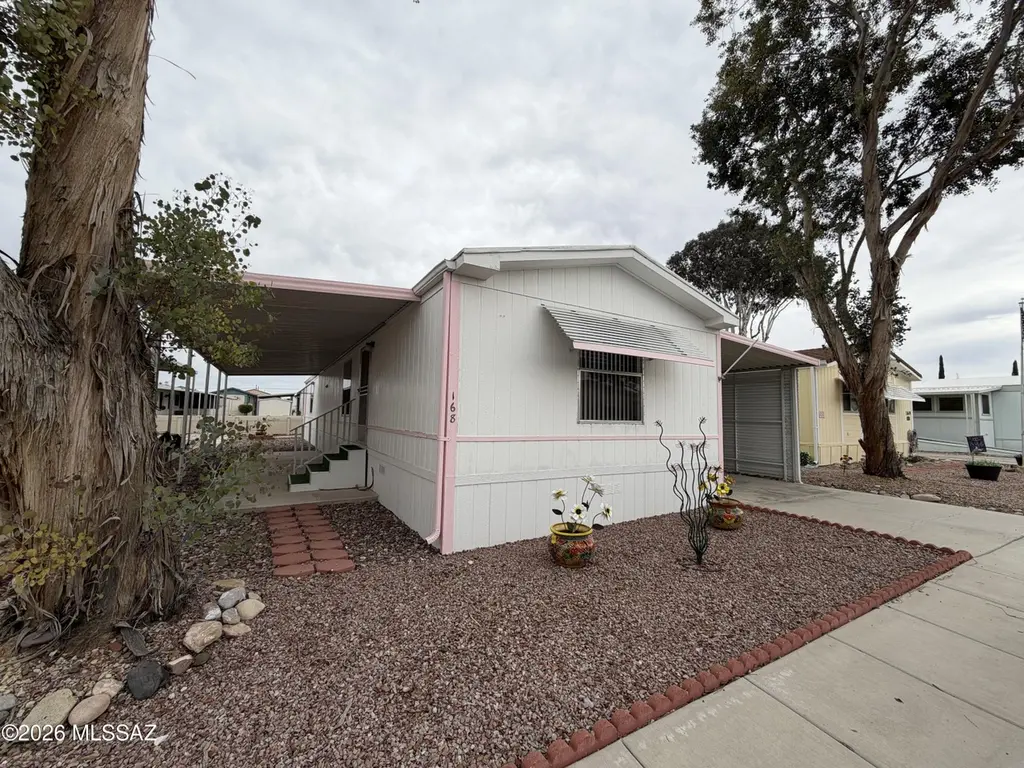
This 2 bed/ 2 bath home is in the gated community of Trails West Resort community, offering low maintenance living and access to fantastic amenities. This is a Vibrant active adult community. This 1,056 sq ft residence features a bright great room, skylights, a split bedroom layout, and a spacious kitchen with an island, pantry cabinet, electric range, and refrigerator. The primary suite includes a double vanity, walk-in shower and walk-in closet, while the second bath offers a shower/tub combo. Outside, find low-care landscaping, a covered patio, two-car carport, and a large storage shed. Community perks include a pool, spa, clubhouse, rec center, shuffleboard, exercise facilities, and secure gated entry.
Key facts
- Gated community
- Spacious kitchen
- Split bedroom layout
Tags
Neighborhood map
What this means for you Summary
Snapshot
- This is a 2-bed/2.0-bath manufactured listed at $50k. Condition is rated good.
Deal economics
- At list price, monthly cash flow is $1k ($12k/yr) — positive.
- The deal already cash-flows at list — no discount required.
- Meets the 1% rule at list price ($2k rent vs $50k).
- Recommended offer: $46k (9.0% below list) — sets the bar for market timing.
- Cap rate 30.7% vs local median 3.7% in Tucson — top-decile yield for the area; either an underpriced asset or a hidden risk that comps aren't pricing in. Stress-test before assuming the spread holds.
Location & tenants
- Location reads 74/100 on livability (#17 in AZ, #4,502 nationally) — a middle-class / working-renter tenant base. Strengths: commute A+, cost of living A+, housing A+; Watch: health & safety C-, schools D+, crime F.
- Vail Unified District (4413) (rural): math 52% / reading 57% proficiency, ranked #26 of 249 in AZ (top 10%) — acceptable for families but not a draw, mixed tenant base, ~2y average lease; only 17% free/reduced lunch — higher-income household profile.
- Market conditions: Rents rising (+1.5%/yr); 158 active listings in the ZIP; 3 comparable units currently listed for rent nearby; rentals at typical pace (median 19d on market — plan ~3-4 weeks tenant-placement turnaround); 5,268 units permitted in Pima County in 2024 (996 in 5+ unit buildings).
Forward outlook
- Local home prices are declining (-3.0%/yr); year-one equity from $346 of loan paydown is wiped out by about $2k of value loss. Plan a longer hold.
- Pima County population projected at +8% by 2050 — modest demand growth; plan on rents tracking national, not racing it.
- At projected returns (-3.0% appreciation + 1.5% rent growth), your $14k cash investment doubles in ~2 years — after that, you're playing with house money.
Negotiation context
- It's been on market 120 days — a 9% lower offer ($46k) is reasonable based on typical stale-listing flexibility.
Risks & watch-outs
- Climate carrying-cost: major wildfire risk; extreme-heat days projected 5→13/yr by 2055 (HVAC capex compounding) — expect insurance premiums to compound above CPI over the hold.
Questions for the listing agent
- It's been on market 120 days. Have you received any prior offers? Is the seller open to a 9% concession, seller financing, or rate buy-down credit?
- Why hasn't it sold? Are there any deal-killer items the seller is aware of (foundation, flood, title, zoning, code violations)?
- Is there a deadline driving the sale (1031 exchange, divorce, estate, relocation)? That informs how much negotiation room exists.
- Schools are D-rated, which usually means shorter tenancies and higher turnover. Who's the typical renter profile here, and what's been the actual vacancy rate?
- Crime grade is F in this area — have there been break-ins, vandalism, or insurance claims at this property in the last 3 years? What carrier currently insures it and at what premium?
- What's the average days-on-market for RENTAL listings here right now (not sales)? A rising rental-DOM trend means longer vacancies and softer asking-rent achievability than the comps imply.
- What's the recent tenant-quality profile in this submarket — average credit score on applications, eviction rate, late-payment / NSF rate, and stable-employment percentage? A property-management company in the area should have these aggregated.
- How much new for-sale + rental construction is in the pipeline within 1–3 miles? Heavy new supply typically softens prices + rents 12–24 months out; constrained supply supports both.
Investment metrics
- 1% rule
- 3.45% ✓
- Cap rate
- 30.71%
- Cash-on-cash
- 87.21%
- DSCR
- 4.88
- GRM
- 2.4
CMA / ARV
No comps found within radius.
Projected returns pro-forma
-3.0% appreciation · 1.52% rent growth · sell at horizon
- IRR
- 86.1%
- Equity multiple
- 4.87×
- Total profit
- $54,196
- Equity at exit
- $7,455
- IRR
- 88.9%
- Equity multiple
- 9.62×
- Total profit
- $120,658
- Equity at exit
- $4,323
Cash invested: $14,000 (down + closing). Projections, not guarantees.
Landlord ↔ Tenant lean methodology
- Overall (STATE)
- 87 Strongly Landlord-Friendly
- State Arizona
- 87 Strongly Landlord-Friendly · R+3
- County
- — inherits STATE
- City
- — inherits STATE
ZIP-level market 85756
- Home prices YoY
- -19.4%
- Rents YoY
- 1.5%
- Active inventory
- 158
- Price-to-rent
- 2.4×
Monthly cashflow live
- Estimated rent
- $1,725 medium interval (Pro) →
- Mortgage (P&I)
- −$262
- Tax est. 1.5%
- −$62 /mo · $750/yr
- Insurance
- −$21
- HOA
- −$0
- Vacancy / Maint / Mgmt
- −$362
- Net cashflow
- $1,017
Break-even live
UW: 25.0% down · 7.5% · 30yr · 1.5% tax · 5.0% vac · 8.0% maint · 8.0% mgmt
Financing live
Cash to close
- Down payment
- $12,500
- Closing costs
- $1,500
- Reserves months
- —
- Total cash needed
- —
Loan-product check · same deal, 3 products live
Conventional
25% down · 7.5% · 30yr
- Down + closing
- —
- Monthly P&I
- —
- Monthly cashflow
- —
- DSCR
- —
- Eligible?
- —
Personal DTI + credit; lowest rate.
DSCR
20% down · 8.5% · 30yr
- Down + closing
- —
- Monthly P&I
- —
- Monthly cashflow
- —
- DSCR
- —
- Eligible?
- —
No personal income docs; deal must DSCR.
Hard money
10% down · 12.0% · 12mo
- Down + closing
- —
- Monthly P&I
- —
- Monthly cashflow
- —
- DSCR
- —
- Eligible?
- —
Short-term bridge; refi at stabilization.
Rent comps 3 comps
| Address | Beds | Baths | Sqft | Rent | $/sqft | DOM | Units | Dist |
|---|---|---|---|---|---|---|---|---|
| 7500 E Voyager Rd Unit 138 Tucson, AZ | 2.0 | 2.0 | 1500 | $1,599 | $1.07 | 19d | 1 | 0.26mi |
| 8042 S Dolphin Way Tucson, AZ | 3.0 | 2.0 | 1444 | $1,800 | $1.25 | 10d | 1 | 1.33mi |
| 6794 E Sea Horse Rd Tucson, AZ | 3.0 | 2.0 | 1444 | $1,800 | $1.25 | 43d | 1 | 1.33mi |
Listing history 17 events
-
2026-06-18days on market $50,000 Active 120 DOM
-
2026-06-17days on market $50,000 Active 119 DOM
-
2026-06-16days on market $50,000 Active 118 DOM
-
2026-06-15days on market $50,000 Active 117 DOM
-
2026-06-13days on market $50,000 Active 115 DOM
-
2026-06-13days on market $50,000 Active 114 DOM
-
2026-06-10days on market $50,000 Active 112 DOM
-
2026-06-09days on market $50,000 Active 111 DOM
-
2026-06-08days on market $50,000 Active 110 DOM
-
2026-06-07pricedays on market $50,000 Active 109 DOM
-
2026-06-05days on market $60,000 Active 106 DOM
-
2026-06-03days on market $60,000 Active 105 DOM
-
2026-06-02days on market $60,000 Active 104 DOM
-
2026-06-01days on market $60,000 Active 103 DOM
-
2026-05-31days on market $60,000 Active 102 DOM
-
2026-04-07price $60,000 718-char remark
Show marketing remark (718 chars)
This 2 bed/ 2 bath home is in the gated community of Trails West Resort community, offering low maintenance living and access to fantastic amenities. This is a Vibrant active adult community. This 1,056 sq ft residence features a bright great room, skylights, a split bedroom layout, and a spacious kitchen with an island, pantry cabinet, electric range, and refrigerator. The primary suite includes a double vanity, walk-in shower and walk-in closet, while the second bath offers a shower/tub combo. Outside, find low-care landscaping, a covered patio, two-car carport, and a large storage shed. Community perks include a pool, spa, clubhouse, rec center, shuffleboard, exercise facilities, and secure gated entry.
-
2026-02-18$72,500 Active 718-char remark
Show marketing remark (718 chars)
This 2 bed/ 2 bath home is in the gated community of Trails West Resort community, offering low maintenance living and access to fantastic amenities. This is a Vibrant active adult community. This 1,056 sq ft residence features a bright great room, skylights, a split bedroom layout, and a spacious kitchen with an island, pantry cabinet, electric range, and refrigerator. The primary suite includes a double vanity, walk-in shower and walk-in closet, while the second bath offers a shower/tub combo. Outside, find low-care landscaping, a covered patio, two-car carport, and a large storage shed. Community perks include a pool, spa, clubhouse, rec center, shuffleboard, exercise facilities, and secure gated entry.
ⓘ Source: listings_history table (triggers on properties + properties_extension) + one-shot
backfill from property_details.listing_events for pre-trigger history.
Climate risk First Street
- Flood 1/10 Low FEMA zone X (unshaded) · 0% chance over 30 yrs
- Wildfire 6/10 Major
- Heat 7/10 Severe 5 d/yr ≥104°F today · 13 d/yr by 30 yrs out
- Wind 1/10 Low
- Air quality 1/10 Low 0 unhealthy d/yr today · 0 by 30 yrs out
Nearby sold comps map
Loading sold comps map…
Walkable amenities ~0.75 mi
Loading nearby amenities…
Taxation est. · year 1
- Rental income
- $20,704
- − Mortgage interest
- −$2,801
- − Property taxes
- −$750
- − Insurance
- −$250
- − Repairs & maintenance
- −$1,656
- − Management
- −$1,656
- − Depreciation
- −$1,455
- Taxable income
- $12,136
- Est. tax owed @ 24.0%
- −$2,913
- After-tax cash flow
- $9,297/yr
For passive investors: Depreciation is non-cash, so a rental often shows a tax loss while cash-flowing — sheltering income. Rental losses are passive: they offset passive income freely, and up to $25,000/yr can offset ordinary (W-2) income if you actively participate and your MAGI is under $100k (phasing out to $0 by $150k); unused losses carry forward. On sale, claimed depreciation is recaptured at up to 25%, and gains may owe capital-gains tax (a 1031 exchange can defer both). Figures are a year-1 estimate at your 24.0% rate — not tax advice; consult a CPA.
Condition & rehab AI · 12 photos
This 2-bedroom, 2-bathroom home in Trails West Resort is in good condition with minimal repairs needed. It offers a good return on investment with updates that can significantly increase its value.
Value-add opportunities
- Resale Paint exterior siding — Fresh paint can enhance curb appeal and property value.
- Both Replace carpet with hardwood flooring — Hardwood flooring is more durable and can increase both resale and rental value.
- Both Update kitchen appliances — Modern appliances can attract more buyers and renters, increasing both resale and rental value.
- Both Install smart home features — Smart home features can increase property value and attract tech-savvy buyers and renters.
- Both Upgrade lighting fixtures — Upgraded lighting can improve the home's ambiance and increase its appeal to potential buyers and renters.
Renovation cost estimate screening
Value-add ROI direction
- Resale Paint exterior siding — Fresh paint can enhance curb appeal and property value. ↑
- Both Replace carpet with hardwood flooring — Hardwood flooring is more durable and can increase both resale and rental value. ↑
- Both Update kitchen appliances — Modern appliances can attract more buyers and renters, increasing both resale and rental value. ↑
- Both Install smart home features — Smart home features can increase property value and attract tech-savvy buyers and renters. ↑
- Both Upgrade lighting fixtures — Upgraded lighting can improve the home's ambiance and increase its appeal to potential buyers and renters. ↑
ⓘ Cost ranges are severity-bucket heuristics (US national rule-of-thumb). Get contractor quotes + a written scope before underwriting a rehab budget.
Schools (NCES district)
- District
- Vail Unified District (4413)
- NCES district ID
- 0408850
- Math proficiency
- 52% ▼ -19.00%
- Reading proficiency
- 57% ▼ -11.00%
- Median HH income
- $77,126
- Composite
- 49.1/100
- National rank
- #2051
- State rank
- #26 of 249 in AZ
Livability — Tucson
- Score
- 74/100
- State rank
- #17
- US rank
- #4502
Category grades
Schools grade is shown separately in the Schools card above.
Census & demographics
- County
- Pima County · 1,012,107 people
- City population
- 839,336
- Metro
- Tucson, AZ
- Population (ZIP)
- 37,700
- Household income
- $72,490
- Rent vs Own
- Severe rent burden
- 265.0
Population outlook (Pima County) Hauer SSP2
- Today (2025)
- 1,066,056 people
- By 2030
- 1,086,684 · +1.9%
- By 2040
- 1,117,160 · +4.8%
- By 2050
- 1,149,778 · +7.9%
- By 2075
- 1,271,480 · +19.3%
- By 2100
- 1,321,160 · +23.9%
Race, ethnicity, and origin ACS 2023
- Neighborhood character
- Diverse neighborhood (Simpson 0.56)
- Race & ethnicity
- Hispanic / Latino 59% White 29% Two or more races 23% Black 7% Native American 4% Asian 2%
- Hispanic origin (detail)
- Mexican 49%
- Common ancestry
- Italian 2% Slovak 1% Portuguese 1%
- Foreign-born
- 18% · Canada, China
- Languages at home
- 57% English-only · Spanish 39% Chinese 1%
Political lean MEDSL · Pima
- 2024 margin
- D (+15.2) · D 57.0% · R 41.8% · Other 1.2%
- 2008→2024 swing
- +9.1pp toward D · 2008: 6.1pp · 2024: 15.2pp
- All cycles
- 2024: D+15.2 2020: D+18.7 2016: D+13.5 2012: D+5.8 2008: D+6.1
Not yet ingested
- Civics
- —
Market trends
- HPI YoY
- ▼ -73.28%
- Current HPI
- 304.0243
- Rent YoY
- ▲ 1.52%
- Metro
- Tucson, AZ
- State GDP YoY
- ▲ 4.54%
- F500 in state
- 20
Industry mix (Fortune 500 HQ in AZ)
| Industry | F500 HQs | Revenue |
|---|---|---|
| Technology | 2 | $13B |
|
||
| Mining / Metals | 1 | $23B |
|
||
| Environmental Services | 1 | $16B |
|
||
| Metals / Steel | 1 | $14B |
|
||
| Technology Distribution | 1 | $9B |
|
||
| Homebuilding | 1 | $8B |
|
||
Price history
-17.2% since first listed2 events — show timeline
- 2026-04-07 Price Changed $60,000 MLSSAZ
- 2026-02-18 Listed $72,500 MLSSAZ
Cash-flow waterfall
monthlySold comps — $/sqft
last 12 mo · ≤1 miLoading sold comps…