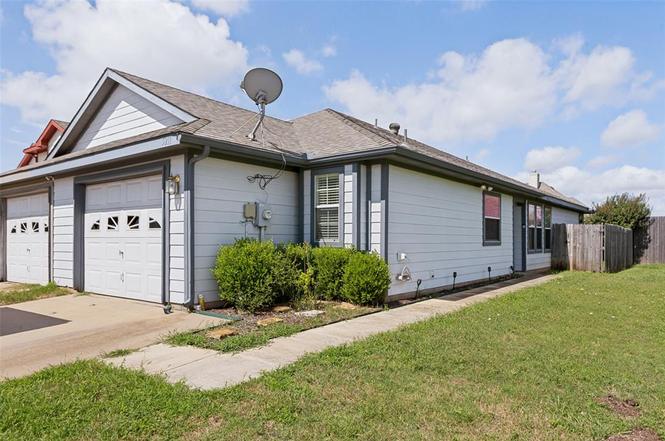
5211 Mountain Spring Trl · Fort Worth, TX
Flood risk 1/10 · Minimal
- FEMA flood zone
- X (unshaded)
- Chance of flooding over 30 yrs
- 0.0%
- Est. flood insurance / yr
- $507 – $1,088
Fire risk 4/10 · Minor
- Est. fire insurance / yr
- $1,222 – $2,270
Heat risk 7/10 · Major
- Hot days now (above 108°F)
- 7 days/yr
- Hot days in 30 yrs
- 23 days/yr
Wind risk 4/10 · Minor
- Chance of severe wind over 30 yrs
- 24.0%
Air-quality risk 3/10 · Minor
- Unhealthy air days now
- 2 days/yr
- Unhealthy air days in 30 yrs
- 3 days/yr
Risk factors via First Street. Map © Google.
Why this score? — see what drove the D+ grade
The composite is a weighted blend of 9 inputs, each scored 0–100. Each bar is that input's sub-score; the figure is the points it added to the 100-point composite (weight × sub-score).
- Cash flow +14.3/30.0
- ARV discount +14.1/15.0
- 1% rule +4.7/10.0
- DSCR +4.3/10.0
- Livability +4.0/5.0
- Rent growth +2.8/5.0
- Condition / age +2.5/5.0
- Schools +2.0/10.0
- Appreciation +0.0/10.0
$172,500
🖨 Deal sheet (PDF) 📄 Offer letter ✓ Due diligence
Listing remarks MLS
Move-in ready! Very well maintained duplex. Great open living room with vaulted ceilings. Open kitchen * Stove Never Used * with breakfast bar. Master bedroom very spacious with door to patio - backyard. Fresh paint, new storm door, and ready for a new owner!
Key facts
- Cul-de-sac lot
- Fresh paint
- Electric range
Tags
Property features AI
Finance
- Other: All furnishings included (per exclusions); Survey available
- Financial info: Listing terms include Cash, Conventional, FHA, and VA; Possession at closing/funding
- HOA & community: No homeowners association; Community features include curbs and sidewalks
Exterior
- Parking: Attached garage (1 car) with inside entrance and garage door opener; Garage faces front; 2-car single door configuration noted; Covered parking space available; Driveway parking; lighted
- Security: Burglar alarm and security system (prewired)
- Utilities: City water; City sewer; No municipal utility district
- Home design: Single-family residence; One story; Built in 2003; Not attached to another property; Subdivision: Trail Lake Estates Add
- Construction: Siding exterior; Composition roof; Slab foundation
- Exterior features: Private yard; Patio; Gutters; Exterior lighting; Wood fencing; Landscaped lot with few trees; Corner lot in a cul-de-sac and adjacent to greenbelt; Curbs and sidewalks in the community
Interior
- Kitchen: Corian/Corian-type and other solid-surface countertops; Built-in cabinets; Breakfast bar; Pantry; Dishwasher; Disposal; Electric range; Microwave
- Bedrooms: 2 bedrooms; split bedroom layout; Primary bedroom with ensuite bathroom, garden tub, dual sinks, and walk-in closet
- Flooring: Carpet; Luxury vinyl plank; Tile
- Bathrooms: 1 full bathroom with dual sinks and garden tub (ensuite); Bathroom has built-in cabinets and solid-surface/Corian-type countertops
- Heating & cooling: Central heating (electric); Central air conditioning (electric); Ceiling fan(s)
- Interior features: Built-in features and built-in cabinets; Cable TV prewired and high-speed internet available; Decorative lighting; Eat-in kitchen with breakfast bar and pantry; Natural woodwork; Walk-in closet(s); Window coverings
- Laundry & utility: Utility room / separate laundry area; Full-size washer/dryer area with washer and electric dryer hookups; Drip/dry area
Neighborhood map
What this means for you Summary
Snapshot
- This is a 2-bed/1.0-bath single-family listed at $172k.
Deal economics
- At list price, monthly cash flow is $30 ($363/yr) — positive.
- The deal already cash-flows at list — no discount required.
- To meet the 1% rule (rent ≥ 1% of price), the offer needs to be $167k (3.4% below list).
- Recommended offer: $167k (3.4% below list) — sets the bar for 1% rule.
- Cap rate 6.5% vs local median 3.9% in Fort Worth — top-decile yield for the area; either an underpriced asset or a hidden risk that comps aren't pricing in. Stress-test before assuming the spread holds.
Location & tenants
- Location reads 80/100 on livability (#49 in TX, #1,954 nationally) — a professional / high-income tenant draw. Strengths: amenities A+, cost of living A+, housing A+; Watch: crime F.
- Fort Worth ISD (urban): math 18% / reading 28% proficiency, ranked #742 of 826 in TX (top 90%) — low school quality limits family demand, transient renter base, plan for 1-2y turnover; 73% free/reduced lunch — lower-income household profile, screen leases tightly.
- Zoned schools: Hazel Harvey Peace El (math 12% / reading 27%, grade F, #3,583 of 4,322 statewide, top 86%, 410 students, 90% FRL) — zoned schools average 90% FRL vs 73% district-wide (18 pts higher); higher-poverty schools than district average — tighter screening recommended.
- Market conditions: Rents rising (+1.1%/yr); 367 active listings in the ZIP; 40 comparable units currently listed for rent nearby; rentals at typical pace (median 19d on market — plan ~3-4 weeks tenant-placement turnaround); solid renter incomes; 18,938 units permitted in Tarrant County in 2024 (8,336 in 5+ unit buildings).
Forward outlook
- Local home prices are declining (-3.0%/yr); year-one equity from $1k of loan paydown is wiped out by about $5k of value loss. Plan a longer hold.
- Tarrant County population projected at +41% by 2050 — long-run rental-demand tailwind backs the buy-and-hold thesis.
Negotiation context
- Only 10 days on market — expect competitive offers; lowballing is unlikely to land.
- 3 sale attempts since 16y ago with the ask held roughly flat each time — persistent listings suggest the price (not the market) is what's stuck; bring a comps-based counter.
Risks & watch-outs
- Climate carrying-cost: extreme-heat days projected 7→23/yr by 2055 (HVAC capex compounding) — expect insurance premiums to compound above CPI over the hold.
Questions for the listing agent
- Is there a deadline driving the sale (1031 exchange, divorce, estate, relocation)? That informs how much negotiation room exists.
- Schools are D-rated, which usually means shorter tenancies and higher turnover. Who's the typical renter profile here, and what's been the actual vacancy rate?
- Crime grade is F in this area — have there been break-ins, vandalism, or insurance claims at this property in the last 3 years? What carrier currently insures it and at what premium?
- The area grade is low — what's the realistic commute time and amenity access for the typical tenant pool here? Any planned neighborhood developments (good or bad) we should know about?
- What's the average days-on-market for RENTAL listings here right now (not sales)? A rising rental-DOM trend means longer vacancies and softer asking-rent achievability than the comps imply.
- What's the recent tenant-quality profile in this submarket — average credit score on applications, eviction rate, late-payment / NSF rate, and stable-employment percentage? A property-management company in the area should have these aggregated.
- How much new for-sale + rental construction is in the pipeline within 1–3 miles? Heavy new supply typically softens prices + rents 12–24 months out; constrained supply supports both.
Investment metrics
- 1% rule
- 0.97% ✗
- Cap rate
- 6.50%
- Cash-on-cash
- 0.75%
- DSCR
- 1.03
- GRM
- 8.6
CMA / ARV
- ARV (on-the-fly)
- $202,078
- Comps found
- 4
Show comp detail 4 sales within ~0.75 mi
| Address | Dist | Beds/Ba | Sqft | Sold | Price | $/sf | Match |
|---|---|---|---|---|---|---|---|
| 7243 Irish Valley Trl | 0.10mi | 2/1.5 | 1,044 (-1%) | 11mo | $199,750 | $191 | 82 |
| 5212 Mountain Spring Trl | 0.04mi | 2/1.5 | 1,068 (+1%) | 23mo | $197,400 | $185 | 76 |
| 7509 Fallen Trl | 0.41mi | 2/1.0 | 1,022 (-3%) | 0mo | $219,900 | $215 | 75 |
| 5007 Mountain Spring Trl | 0.14mi | 2/2.0 | 1,198 (+13%) | 14mo | $225,000 | $188 | 56 |
Match score weights: distance 35% · size 25% · config 20% · recency 20%. Top-matched comps best support the ARV.
Projected returns pro-forma
-3.0% appreciation · 1.07% rent growth · sell at horizon
- IRR
- -17.4%
- Equity multiple
- 0.40×
- Total profit
- $-29,120
- Equity at exit
- $25,720
- IRR
- -13.8%
- Equity multiple
- 0.27×
- Total profit
- $-35,076
- Equity at exit
- $14,915
Cash invested: $48,300 (down + closing). Projections, not guarantees.
Landlord ↔ Tenant lean methodology
- Overall (STATE)
- 87 Strongly Landlord-Friendly
- State Texas
- 87 Strongly Landlord-Friendly · R+5
- County
- — inherits STATE
- City
- — inherits STATE
ZIP-level market 76123
- Home prices YoY
- -17.9%
- Rents YoY
- 1.1%
- Active inventory
- 367
- Price-to-rent
- 8.6×
Monthly cashflow live
- Estimated rent
- $1,667 high interval (Pro) →
- Mortgage (P&I)
- −$905
- Tax from tax record
- −$310 /mo · $3,719/yr
- Insurance
- −$72
- HOA
- −$0
- Vacancy / Maint / Mgmt
- −$350
- Net cashflow
- $30
Break-even live
Sensitivity live
| Price | -10% $128 | -5% $79 | +0% $30 | +5% $-19 | +10% $-67 |
|---|---|---|---|---|---|
| Rent | -10% $-101 | -5% $-36 | +0% $30 | +5% $96 | +10% $162 |
| Rate | -1.0pp $117 | -0.5pp $74 | base $30 | +0.5pp $-14 | +1.0pp $-60 |
UW: 25.0% down · 7.5% · 30yr · 1.5% tax · 5.0% vac · 8.0% maint · 8.0% mgmt
Financing live
Cash to close
- Down payment
- $43,125
- Closing costs
- $5,175
- Reserves months
- —
- Total cash needed
- —
Loan-product check · same deal, 3 products live
Conventional
25% down · 7.5% · 30yr
- Down + closing
- —
- Monthly P&I
- —
- Monthly cashflow
- —
- DSCR
- —
- Eligible?
- —
Personal DTI + credit; lowest rate.
DSCR
20% down · 8.5% · 30yr
- Down + closing
- —
- Monthly P&I
- —
- Monthly cashflow
- —
- DSCR
- —
- Eligible?
- —
No personal income docs; deal must DSCR.
Hard money
10% down · 12.0% · 12mo
- Down + closing
- —
- Monthly P&I
- —
- Monthly cashflow
- —
- DSCR
- —
- Eligible?
- —
Short-term bridge; refi at stabilization.
Rent comps 40 comps
| Address | Beds | Baths | Sqft | Rent | $/sqft | DOM | Units | Dist |
|---|---|---|---|---|---|---|---|---|
| 5210 Mountain Spring Trl Fort Worth, TX | 2.0 | 2.0 | 1450 | $1,900 | $1.31 | 3d | 1 | 0.02mi |
| 7245 Irish Valley Trl Unit 7245 Fort Worth, TX | 2.0 | 1.5 | 1050 | $1,600 | $1.52 | 45d | 1 | 0.09mi |
| 5039 Mountain Spring Trl Fort Worth, TX | 2.0 | 1.5 | 1024 | $1,500 | $1.46 | 26d | 1 | 0.10mi |
| 7149 Trail Lake Dr Fort Worth, TX | 2.0–3.0 | 2.0 | 1061 | $1,565 | $1.48 | 0d | 8 | 0.17mi |
| 7501 Kingswood Dr Fort Worth, TX | 1.0–2.0 | 1.0–2.0 | 815 | $1,415 | $1.74 | 0d | 5 | 0.23mi |
| 7334 Kingswood Cir Fort Worth, TX | 2.0 | 1.5 | 1104 | $1,345 | $1.22 | 19d | 1 | 0.23mi |
| 7326 Kingswood Cir Fort Worth, TX | 2.0 | 1.5 | 1104 | $1,425 | $1.29 | 26d | 1 | 0.25mi |
| 7403 Kingswood Cir Fort Worth, TX | 2.0 | 1.5 | 1104 | $1,450 | $1.31 | 8d | 1 | 0.26mi |
| 7337 Kingswood Cir Fort Worth, TX | 2.0 | 1.5 | 1104 | $1,800 | $1.63 | 45d | 1 | 0.26mi |
| 7401 Kingswood Cir Fort Worth, TX | 2.0 | 1.0 | 1104 | $1,450 | $1.31 | 8d | 1 | 0.27mi |
| 5553 Lockhart Ln Fort Worth, TX | 2.0 | 2.0 | 960 | $1,958 | $2.04 | 45d | 1 | 0.48mi |
| 5312 Hastings Dr Fort Worth, TX | 2.0 | 1.0 | 1067 | $1,295 | $1.21 | 8d | 1 | 0.51mi |
| 7305 Redfield Dr Fort Worth, TX | 2.0 | 1.0 | 1192 | $1,500 | $1.26 | 6d | 1 | 0.53mi |
| 5609 Wild Acres Fort Worth, TX | 2.0 | 2.0 | 960 | $1,958 | $2.04 | 45d | 1 | 0.55mi |
| 5637 Wild Acrs Fort Worth, TX | 3.0 | 2.0 | 1236 | $1,988 | $1.61 | 45d | 1 | 0.58mi |
| 5669 Altamesa Blvd Fort Worth, TX | 1.0–3.0 | 1.0–2.0 | 936 | $1,920 | $2.05 | 0d | 20 | 0.58mi |
| 7223 Fuller Cir Fort Worth, TX | 3.0 | 2.0 | 1451 | $1,900 | $1.31 | 16d | 1 | 0.60mi |
| 6754 Trail Lake Dr Unit B Fort Worth, TX | 2.0 | 2.0 | 1064 | $1,550 | $1.46 | 45d | 1 | 0.61mi |
| 5344 Sycamore School Rd Fort Worth, TX | 3.0 | 1.0–2.5 | 1041 | $1,923 | $1.85 | 0d | 14 | 0.62mi |
| 6850 Granbury Rd Unit 6883 Fort Worth, TX | 3.0 | 2.0 | 1296 | $1,719 | $1.33 | 0d | 1 | 0.70mi |
| 6850 Granbury Rd Unit 15104 Fort Worth, TX | 1.0 | 1.0 | 702 | $1,180 | $1.68 | 20d | 1 | 0.70mi |
| 6850 Granbury Rd Unit 6309 Fort Worth, TX | 2.0 | 2.0 | 1161 | $1,760 | $1.52 | 14d | 1 | 0.70mi |
| 6850 Granbury Rd Unit 6887 Fort Worth, TX | 2.0 | 2.0 | 1107 | $1,683 | $1.52 | 0d | 1 | 0.70mi |
| 6850 Granbury Rd Unit 5203 Fort Worth, TX | 2.0 | 2.0 | 1107 | $1,709 | $1.54 | 18d | 1 | 0.70mi |
| 4849 Madyson Ridge Dr Fort Worth, TX | 3.0 | 2.0 | 1390 | $2,000 | $1.44 | 45d | 1 | 0.70mi |
| 6850 Granbury Rd Unit 07305 Fort Worth, TX | 1.0 | 1.0 | 700 | $1,206 | $1.72 | 45d | 1 | 0.71mi |
| 5400 Sycamore School Rd Fort Worth, TX | 1.0–4.0 | 1.0–2.0 | 1125 | $1,291 | $1.15 | 45d | 1 | 0.73mi |
| 6850 Granbury Rd Fort Worth, TX | 2.0 | 2.0 | 1161 | $1,860 | $1.60 | 45d | 1 | 0.74mi |
| 6850 Granbury Rd Fort Worth, TX | 2.0 | 2.0 | 1161 | $1,810 | $1.56 | 14d | 1 | 0.74mi |
| 6850 Granbury Rd Fort Worth, TX | 2.0 | 2.0 | 1161 | $1,760 | $1.52 | 4d | 1 | 0.74mi |
| 6625 S Hulen St Fort Worth, TX | 1.0–3.0 | 1.0–3.0 | 1066 | $1,299 | $1.22 | 26d | 4 | 0.80mi |
| 6625 S Hulen St Fort Worth, TX | 2.0 | 2.0 | 1012 | $1,299 | $1.28 | 5d | 1 | 0.80mi |
| 6629 S Hulen St Fort Worth, TX | 1.0–2.0 | 1.0–2.0 | 867 | $1,099 | $1.27 | 5d | 1 | 0.81mi |
| 6629 S Hulen St Fort Worth, TX | 1.0–2.0 | 1.0–2.0 | 867 | $1,299 | $1.50 | 3d | 1 | 0.81mi |
| 7545 Harris Pkwy Fort Worth, TX | 1.0–2.0 | 1.0–2.0 | 881 | $2,084 | $2.37 | 23d | 1 | 0.86mi |
| 7545 Harris Pkwy Fort Worth, TX | 1.0–2.0 | 1.0–2.0 | 980 | $2,759 | $2.81 | 45d | 36 | 0.86mi |
| 4633 Sycamore School Rd Fort Worth, TX | 2.0 | 2.0 | 1134 | $1,489 | $1.31 | 14d | 1 | 0.86mi |
| 4633 Sycamore School Rd Unit 4670 Fort Worth, TX | 2.0 | 2.0 | 1134 | $1,463 | $1.29 | 0d | 1 | 0.86mi |
| 4633 Sycamore School Rd Unit 4690 Fort Worth, TX | 2.0 | 2.0 | 814 | $1,264 | $1.55 | 45d | 1 | 0.86mi |
| 4509 Altamesa Blvd Unit 4511 Fort Worth, TX | 2.0 | 2.5 | 1435 | $1,679 | $1.17 | 45d | 1 | 0.89mi |
Listing history 7 events
-
2026-06-21days on market $172,500 Active 10 DOM
-
2026-06-18days on market $172,500 Active 7 DOM
-
2026-06-17days on market $172,500 Active 6 DOM
-
2026-06-16days on market $172,500 Active 5 DOM
-
2026-06-15days on market $172,500 Active 4 DOM
-
2026-06-13remarks 691-char remark
-
2026-06-13$172,500 Active 2 DOM
ⓘ Source: listings_history table (triggers on properties + properties_extension) + one-shot
backfill from property_details.listing_events for pre-trigger history.
Tax reassessment forecast TX · Resets to sale price
- Current annual tax
- $3,719 · $310/mo
- Projected year-2 tax
- $3,719 · $310/mo
- Expected delta
- $0/yr ($0/mo · 0.0%)
ⓘ Screening estimate from a state-policy table — verify with the county assessor before closing.
Climate risk First Street
- Flood 1/10 Low FEMA zone X (unshaded) · 0% chance over 30 yrs
- Wildfire 4/10 Moderate
- Heat 7/10 Severe 7 d/yr ≥108°F today · 23 d/yr by 30 yrs out
- Wind 4/10 Moderate 24% chance of damaging wind over 30 yrs
- Air quality 3/10 Moderate 2 unhealthy d/yr today · 3 by 30 yrs out
Nearby sold comps map
Loading sold comps map…
Walkable amenities ~0.75 mi
Loading nearby amenities…
Taxation est. · year 1
- Rental income
- $19,999
- − Mortgage interest
- −$9,663
- − Property taxes
- −$3,719
- − Insurance
- −$862
- − Repairs & maintenance
- −$1,600
- − Management
- −$1,600
- − Depreciation
- −$5,018
- Taxable loss
- −$2,463
- Est. tax savings @ 24.0%
- +$591
- After-tax cash flow
- $954/yr
For passive investors: Depreciation is non-cash, so a rental often shows a tax loss while cash-flowing — sheltering income. Rental losses are passive: they offset passive income freely, and up to $25,000/yr can offset ordinary (W-2) income if you actively participate and your MAGI is under $100k (phasing out to $0 by $150k); unused losses carry forward. On sale, claimed depreciation is recaptured at up to 25%, and gains may owe capital-gains tax (a 1031 exchange can defer both). Figures are a year-1 estimate at your 24.0% rate — not tax advice; consult a CPA.
Schools (NCES district)
- District
- Fort Worth ISD
- NCES district ID
- 4819700
- Math proficiency
- 18% ▼ -16.00%
- Reading proficiency
- 28% ▼ -6.00%
- Median HH income
- $42,109
- Composite
- 19.61/100
- National rank
- #8753
- State rank
- #742 of 826 in TX
Livability — Fort Worth
- Score
- 80/100
- State rank
- #49
- US rank
- #1954
Category grades
Schools grade is shown separately in the Schools card above.
Census & demographics
- Census place
- Fort Worth, TX
- County
- Tarrant County · 2,033,669 people
- City population
- 911,619
- Metro
- Dallas-Fort Worth-Arlington, TX
- Population (ZIP)
- 42,957
- Household income
- $102,768
- Rent vs Own
- Severe rent burden
- 975.0
Population outlook (Tarrant County) Hauer SSP2
- Today (2025)
- 2,380,417 people
- By 2030
- 2,578,900 · +8.3%
- By 2040
- 2,974,995 · +25.0%
- By 2050
- 3,350,489 · +40.8%
- By 2075
- 4,216,909 · +77.2%
- By 2100
- 4,741,527 · +99.2%
Race, ethnicity, and origin ACS 2023
- Neighborhood character
- Highly diverse neighborhood (Simpson 0.73)
- Race & ethnicity
- Black 37% Hispanic / Latino 26% White 24% Two or more races 15% Asian 8%
- Hispanic origin (detail)
- Mexican 22%
- Common ancestry
- Italian 1% Romanian 1% Slovak 1%
- Foreign-born
- 17% · Canada, Vietnam, Jamaica
- Languages at home
- 75% English-only · Spanish 16% Other Indo-European 3% Vietnamese 2%
Political lean MEDSL · Tarrant
- 2024 margin
- Lean R (+5.1) · D 46.7% · R 51.9% · Other 1.4%
- 2008→2024 swing
- +6.6pp toward D · 2008: -11.7pp · 2024: -5.1pp
- All cycles
- 2024: R+5.1 2020: D+0.2 2016: R+8.7 2012: R+15.7 2008: R+11.7
Not yet ingested
- Civics
- —
Market trends
- HPI YoY
- ▼ -50.54%
- Current HPI
- 231.1377
- Rent YoY
- ▲ 1.07%
- Metro
- Dallas-Fort Worth-Arlington, TX
- State GDP YoY
- ▲ 3.95%
- F500 in state
- 110
Industry mix (Fortune 500 HQ in TX)
| Industry | F500 HQs | Revenue |
|---|---|---|
| Energy | 16 | $1,198B |
|
||
| Technology | 5 | $198B |
|
||
| Engineering / Construction | 4 | $72B |
|
||
| Energy Services | 3 | $60B |
|
||
| Utilities | 3 | $41B |
|
||
| Healthcare | 2 | $330B |
|
||
Price history
+92.7% since first listed11 events — show timeline
- 2026-06-11 Listed $172,500 NTREIS
- 2011-09-27 Sold (Public Records) — Public Records
- 2011-09-26 Sold (MLS) — NTREIS
- 2011-09-19 Pending — NTREIS
- 2011-09-07 Contingent — NTREIS
- 2011-08-26 Price Changed $65,000 NTREIS
- 2011-07-26 Relisted — NTREIS
- 2011-07-24 Listing Removed — NTREIS
- 2011-02-07 Price Changed $80,000 NTREIS
- 2010-11-01 Price Changed $85,000 NTREIS
- 2010-06-23 Listed $89,500 NTREIS
Property tax history
+4.3%/yrLatest (2025): $3,719 · +7.3% YoY. Source: county tax records.
Cash-flow waterfall
monthlySold comps — $/sqft
last 12 mo · ≤1 miLoading sold comps…