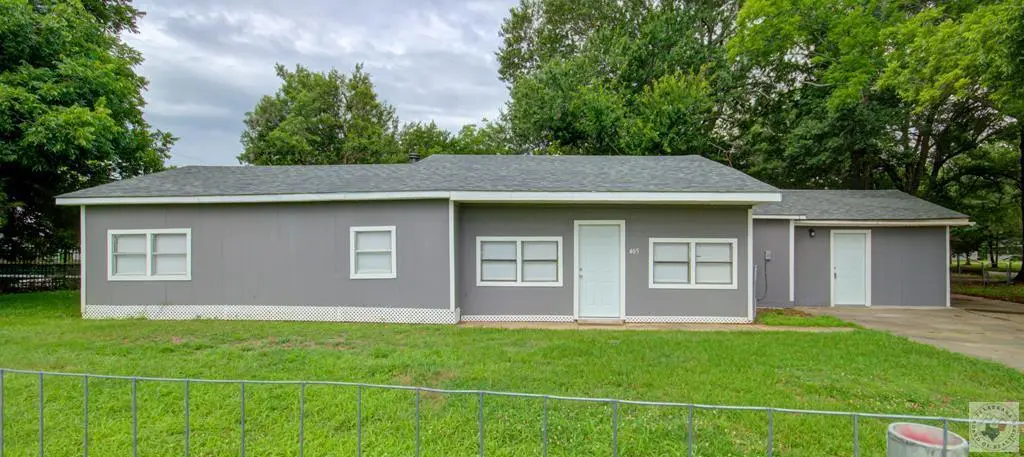
405 E 5th St · Hooks, TX
Flood risk 3/10 · Minor
- FEMA flood zone
- X (unshaded)
- Chance of flooding over 30 yrs
- 0.2%
- Est. flood insurance / yr
- $507 – $1,088
Fire risk 4/10 · Minor
- Est. fire insurance / yr
- $1,222 – $2,270
Heat risk 7/10 · Major
- Hot days now (above 111°F)
- 7 days/yr
- Hot days in 30 yrs
- 24 days/yr
Wind risk 4/10 · Minor
- Chance of severe wind over 30 yrs
- 24.0%
Air-quality risk 2/10 · Minimal
- Unhealthy air days now
- 1 days/yr
- Unhealthy air days in 30 yrs
- 1 days/yr
Risk factors via First Street. Map © Google.
Why this score? — see what drove the C- grade
The composite is a weighted blend of 9 inputs, each scored 0–100. Each bar is that input's sub-score; the figure is the points it added to the 100-point composite (weight × sub-score).
- Cash flow +21.0/30.0
- ARV discount +7.5/15.0
- DSCR +6.7/10.0
- 1% rule +4.3/10.0
- Schools +4.0/10.0
- Livability +3.2/5.0
- Rent growth +2.5/5.0
- Condition / age +2.5/5.0
- Appreciation +0.0/10.0
$163,000
🖨 Deal sheet 📄 Offer letter ✓ Due diligence
Listing remarks MLS
For sale three bedroom one bath house on corner lot in Hooks, TX The property features an additional room that could be a fourth bedroom and enclosed garage perfect for storage or work area. The home will need some repairs and interior is not complete. Selling as-is.
Key facts
- Fenced yard
- Versatile workshop
- New roof
Tags
Property features AI
Exterior
- Parking: Open parking with a parking pad
- Home design: Single-family residence; One story
- Construction: Frame construction; Shingle roof; Pillar/post/pier foundation; Built in (year not provided)
- Exterior features: Chain link fence; Corner lot; Concrete road frontage on a city street; Outbuilding
Interior
- Flooring: Vinyl flooring
- Bathrooms: 2 full bathrooms
- Interior features: Blinds; Vinyl flooring
Neighborhood map
What this means for you Summary
Snapshot
- This is a 5-bed/2.0-bath single-family listed at $163k.
Deal economics
- At list price, monthly cash flow is $229 ($3k/yr) — positive.
- The deal already cash-flows at list — no discount required.
- To meet the 1% rule (rent ≥ 1% of price), the offer needs to be $152k (6.5% below list).
- Recommended offer: $152k (6.5% below list) — sets the bar for 1% rule.
Location & tenants
- Location reads 64/100 on livability (#819 in TX) — a middle-class / working-renter tenant base. Strengths: cost of living A+, housing A-, crime B+; Watch: schools C-, amenities F, commute F.
- Hooks ISD (town): math 46% / reading 50% proficiency, ranked #226 of 826 in TX (top 27%) — families likely to look elsewhere, expect single-tenant / working-renter base with shorter leases.
- Market conditions: 65 active listings in the ZIP; 137 units permitted in Bowie County in 2024 (5 in 5+ unit buildings).
Forward outlook
- Local home prices are declining (-3.0%/yr); year-one equity from $1k of loan paydown is wiped out by about $5k of value loss. Plan a longer hold.
Negotiation context
- Only 10 days on market — expect competitive offers; lowballing is unlikely to land.
- 4 sale attempts since 3y ago with the ask held roughly flat each time — persistent listings suggest the price (not the market) is what's stuck; bring a comps-based counter.
Risks & watch-outs
- Climate carrying-cost: extreme-heat days projected 7→24/yr by 2055 (HVAC capex compounding) — expect insurance premiums to compound above CPI over the hold.
Questions for the listing agent
- Built in 1965 — when were the roof, HVAC, electrical panel, plumbing, and water heater last replaced?
- Is there a deadline driving the sale (1031 exchange, divorce, estate, relocation)? That informs how much negotiation room exists.
- What's the average days-on-market for RENTAL listings here right now (not sales)? A rising rental-DOM trend means longer vacancies and softer asking-rent achievability than the comps imply.
- What's the recent tenant-quality profile in this submarket — average credit score on applications, eviction rate, late-payment / NSF rate, and stable-employment percentage? A property-management company in the area should have these aggregated.
- How much new for-sale + rental construction is in the pipeline within 1–3 miles? Heavy new supply typically softens prices + rents 12–24 months out; constrained supply supports both.
Investment metrics
- 1% rule
- 0.93% ✗
- Cap rate
- 7.98%
- Cash-on-cash
- 6.03%
- DSCR
- 1.27
- GRM
- 8.9
CMA / ARV
No comps found within radius.
Projected returns pro-forma
-3.0% appreciation · 3.0% rent growth · sell at horizon
- IRR
- -7.0%
- Equity multiple
- 0.74×
- Total profit
- $-11,877
- Equity at exit
- $24,304
- IRR
- 2.5%
- Equity multiple
- 1.18×
- Total profit
- $8,180
- Equity at exit
- $14,093
Cash invested: $45,640 (down + closing). Projections, not guarantees.
Landlord ↔ Tenant lean methodology
- Overall (STATE)
- 87 Strongly Landlord-Friendly
- State Texas
- 87 Strongly Landlord-Friendly · R+5
- County
- — inherits STATE
- City
- — inherits STATE
ZIP-level market 75561
- Home prices YoY
- -8.4%
- Active inventory
- 65
- Price-to-rent
- 8.9×
Monthly cashflow live
- Estimated rent
- $1,523 medium interval (Pro) →
- Mortgage (P&I)
- −$855
- Tax from tax record
- −$51 /mo · $616/yr
- Insurance
- −$68
- HOA
- −$0
- Vacancy / Maint / Mgmt
- −$320
- Net cashflow
- $229
Break-even live
UW: 25.0% down · 7.5% · 30yr · 1.5% tax · 5.0% vac · 8.0% maint · 8.0% mgmt
Financing live
Cash to close
- Down payment
- $40,750
- Closing costs
- $4,890
- Reserves months
- —
- Total cash needed
- —
Loan-product check · same deal, 3 products live
Conventional
25% down · 7.5% · 30yr
- Down + closing
- —
- Monthly P&I
- —
- Monthly cashflow
- —
- DSCR
- —
- Eligible?
- —
Personal DTI + credit; lowest rate.
DSCR
20% down · 8.5% · 30yr
- Down + closing
- —
- Monthly P&I
- —
- Monthly cashflow
- —
- DSCR
- —
- Eligible?
- —
No personal income docs; deal must DSCR.
Hard money
10% down · 12.0% · 12mo
- Down + closing
- —
- Monthly P&I
- —
- Monthly cashflow
- —
- DSCR
- —
- Eligible?
- —
Short-term bridge; refi at stabilization.
Listing history 9 events
-
2026-06-19days on market $163,000 Active 10 DOM
-
2026-06-18days on market $163,000 Active 9 DOM
-
2026-06-17days on market $163,000 Active 8 DOM
-
2026-06-16days on market $163,000 Active 7 DOM
-
2026-06-15days on market $163,000 Active 6 DOM
-
2026-06-14days on market $163,000 Active 4 DOM
-
2026-06-13days on market $163,000 Active 3 DOM
-
2026-06-10remarks 666-char remark
-
2026-06-10$163,000 Active 1 DOM
ⓘ Source: listings_history table (triggers on properties + properties_extension) + one-shot
backfill from property_details.listing_events for pre-trigger history.
Tax reassessment forecast TX · Resets to sale price
- Current annual tax
- $616 · $51/mo
- Projected year-2 tax
- $2,983 · $249/mo
- Expected delta
- +$2,367/yr (+$197/mo · 384.4%)
ⓘ Screening estimate from a state-policy table — verify with the county assessor before closing.
Climate risk First Street
- Flood 3/10 Moderate FEMA zone X (unshaded) · 20% chance over 30 yrs
- Wildfire 4/10 Moderate
- Heat 7/10 Severe 7 d/yr ≥111°F today · 24 d/yr by 30 yrs out
- Wind 4/10 Moderate 24% chance of damaging wind over 30 yrs
- Air quality 2/10 Low 1 unhealthy d/yr today · 1 by 30 yrs out
Nearby sold comps map
Loading sold comps map…
Walkable amenities ~0.75 mi
Loading nearby amenities…
Taxation est. · year 1
- Rental income
- $18,279
- − Mortgage interest
- −$9,131
- − Property taxes
- −$616
- − Insurance
- −$815
- − Repairs & maintenance
- −$1,462
- − Management
- −$1,462
- − Depreciation
- −$4,742
- Taxable income
- $51
- Est. tax owed @ 24.0%
- −$12
- After-tax cash flow
- $2,740/yr
For passive investors: Depreciation is non-cash, so a rental often shows a tax loss while cash-flowing — sheltering income. Rental losses are passive: they offset passive income freely, and up to $25,000/yr can offset ordinary (W-2) income if you actively participate and your MAGI is under $100k (phasing out to $0 by $150k); unused losses carry forward. On sale, claimed depreciation is recaptured at up to 25%, and gains may owe capital-gains tax (a 1031 exchange can defer both). Figures are a year-1 estimate at your 24.0% rate — not tax advice; consult a CPA.
Schools (NCES district)
- District
- Hooks ISD
- NCES district ID
- 4823490
- Math proficiency
- 46% ▼ -9.00%
- Reading proficiency
- 50% ▲ 1.00%
- Median HH income
- $42,354
- Composite
- 40.38/100
- National rank
- #3734
- State rank
- #226 of 826 in TX
Livability — Hooks
- Score
- 64/100
- State rank
- #819
- US rank
- #14861
Category grades
Schools grade is shown separately in the Schools card above.
Census & demographics
- Census place
- Hooks, TX
- Population (ZIP)
- 4,954
Population outlook (Bowie County) Hauer SSP2
- Today (2025)
- 94,699 people
- By 2030
- 94,824 · +0.1%
- By 2040
- 94,870 · +0.2%
- By 2050
- 93,686 · -1.1%
- By 2075
- 90,082 · -4.9%
- By 2100
- 76,579 · -19.1%
Race, ethnicity, and origin ACS 2023
- Neighborhood character
- Predominantly White (70%)
- Race & ethnicity
- White 70% Black 16% Hispanic / Latino 8% Two or more races 8%
- Hispanic origin (detail)
- Mexican 6%
- Common ancestry
- Slovak 3% European 1% Romanian 1%
- Foreign-born
- 3% · Canada
- Languages at home
- 96% English-only · Spanish 3%
Political lean MEDSL · Bowie
- 2024 margin
- Solid R (+48.7) · D 25.3% · R 74.0%
- 2008→2024 swing
- -10.8pp toward R · 2008: -37.9pp · 2024: -48.7pp
- All cycles
- 2024: R+48.7 2020: R+42.8 2016: R+46.6 2012: R+41.5 2008: R+37.9
Not yet ingested
- Civics
- —
Market trends
- HPI YoY
- ▼ -14.29%
- Current HPI
- 154.9243
- Rent YoY
- —
- Metro
- —
- State GDP YoY
- ▲ 3.95%
- F500 in state
- 110
Industry mix (Fortune 500 HQ in TX)
| Industry | F500 HQs | Revenue |
|---|---|---|
| Energy | 16 | $1,198B |
|
||
| Technology | 5 | $198B |
|
||
| Engineering / Construction | 4 | $72B |
|
||
| Energy Services | 3 | $60B |
|
||
| Utilities | 3 | $41B |
|
||
| Healthcare | 2 | $330B |
|
||
Price history
+136.2% since first listed12 events — show timeline
- 2026-06-09 Listed $163,000 TBOR
- 2025-06-09 Sold (Public Records) — Public Records
- 2025-04-14 Sold (Public Records) — Public Records
- 2025-04-11 Sold (MLS) — TBOR
- 2025-03-17 Pending — TBOR
- 2025-03-04 Listed $29,000 TBOR
- 2024-05-31 Price Changed $49,000 TBOR
- 2024-03-26 Price Changed $52,000 TBOR
- 2024-01-06 Price Changed $59,000 TBOR
- 2023-08-25 Relisted — TBOR
- 2023-08-17 Delisted — TBOR
- 2023-07-13 Listed $69,000 TBOR
Property tax history
-5.9%/yrLatest (2025): $616 · -55.3% YoY. Source: county tax records.
Cash-flow waterfall
monthlySold comps — $/sqft
last 12 mo · ≤1 miLoading sold comps…