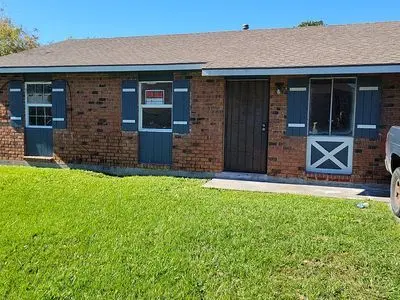
2108 Rue Racine · Marrero, LA
Flood risk 8/10 · Major
- FEMA flood zone
- X (shaded)
- Chance of flooding over 30 yrs
- 0.6%
- Est. flood insurance / yr
- $507 – $1,088
Fire risk 1/10 · Minimal
- Est. fire insurance / yr
- $1,269 – $2,357
Heat risk 10/10 · Severe
- Hot days now (above 109°F)
- 7 days/yr
- Hot days in 30 yrs
- 21 days/yr
Wind risk 10/10 · Severe
- Chance of severe wind over 30 yrs
- 99.0%
Air-quality risk 3/10 · Minor
- Unhealthy air days now
- 3 days/yr
- Unhealthy air days in 30 yrs
- 4 days/yr
Risk factors via First Street. Map © Google.
Why this score? — see what drove the D- grade
The composite is a weighted blend of 9 inputs, each scored 0–100. Each bar is that input's sub-score; the figure is the points it added to the 100-point composite (weight × sub-score).
- Cash flow +17.3/30.0
- DSCR +5.4/10.0
- 1% rule +3.4/10.0
- Livability +3.4/5.0
- Rent growth +2.8/5.0
- Schools +2.5/10.0
- Condition / age +2.5/5.0
- ARV discount +1.4/15.0
- Appreciation +0.0/10.0
$208,000
🖨 Deal sheet (PDF) 📄 Offer letter ✓ Due diligence
Listing remarks
This home was recently redone as noted in photos. The garage was closed in to add more living space. Near multiple JPRD parks, shopping, and quick access to business 90. Great starter home for new couples looking to start a family. Numerous schools from which to choose. Retirees and singles can find plenty to do with a state park, walking trail, and bike areas very close by. Please call owner to set up appointments to see the home. 504-957-9817
Key facts
- Living space
- Walking trail
- Closed garage
Tags
Neighborhood map
What this means for you Summary
Snapshot
- This is a 3-bed/2.0-bath single-family listed at $208k.
Deal economics
- At list price, monthly cash flow is $85 ($1k/yr) — positive.
- The deal already cash-flows at list — no discount required.
- To meet the 1% rule (rent ≥ 1% of price), the offer needs to be $174k (16.4% below list).
- Recommended offer: $174k (16.4% below list) — sets the bar for 1% rule.
Location & tenants
- Location reads 67/100 on livability (#104 in LA) — a middle-class / working-renter tenant base. Strengths: cost of living A+, housing A+, health & safety A+; Watch: crime F, amenities F, commute F.
- Jefferson Parish (suburban): math 24% / reading 34% proficiency, ranked #44 of 98 in LA (top 45%) — low school quality limits family demand, transient renter base, plan for 1-2y turnover; 70% free/reduced lunch — lower-income household profile, screen leases tightly.
- Zoned schools: Ray St. Pierre Academy For Advanced Studies (math 82% / reading 82%, grade A+, #9 of 646 statewide, top 1%, 336 students, 26% FRL); Stella Worley Middle School (math 7% / reading 19%, grade F, #189 of 218 statewide, top 87%, 470 students, 80% FRL); John Ehret High School (math 19% / reading 27%, grade F, #169 of 265 statewide, top 64%, 1,579 students, 66% FRL).
- Market conditions: Rents rising (+1.1%/yr); 299 active listings in the ZIP; 21 comparable units currently listed for rent nearby; rentals at typical pace (median 26d on market — plan ~3-4 weeks tenant-placement turnaround); 518 units permitted in Jefferson Parish in 2024 (43 in 5+ unit buildings).
- This rent runs 38% of the median local income ($55k/yr) — at the standard rent-burdened threshold; future hikes will face affordability resistance.
Forward outlook
- Local home prices are declining (-3.0%/yr); year-one equity from $1k of loan paydown is wiped out by about $6k of value loss. Plan a longer hold.
Negotiation context
- It's been on market 26 days — a 2% lower offer ($205k) is reasonable based on typical stale-listing flexibility.
- 2 sale attempts since 3y ago with the ask held roughly flat each time — persistent listings suggest the price (not the market) is what's stuck; bring a comps-based counter.
- Current owner paid $9k; list at $208k implies a 2211% gain — meaningful room to come down on a strong offer.
Risks & watch-outs
- Watch-outs: flood insurance adds $66/mo.
- Climate carrying-cost: severe flood risk; severe wind risk, 99% chance of damaging wind over 30y; extreme-heat days projected 7→21/yr by 2055 (HVAC capex compounding) — expect insurance premiums to compound above CPI over the hold.
Questions for the listing agent
- Built in 1973 — when were the roof, HVAC, electrical panel, plumbing, and water heater last replaced?
- What's the actual annual flood-insurance premium (NFIP or private), and is the property in a SFHA with mandatory coverage?
- Is there a deadline driving the sale (1031 exchange, divorce, estate, relocation)? That informs how much negotiation room exists.
- Schools are B-rated — typically a magnet for longer-tenancy family renters. What's the average tenant stay here, and is there a school-zone premium baked into asking?
- Crime grade is F in this area — have there been break-ins, vandalism, or insurance claims at this property in the last 3 years? What carrier currently insures it and at what premium?
- The area grade is low — what's the realistic commute time and amenity access for the typical tenant pool here? Any planned neighborhood developments (good or bad) we should know about?
- What's the average days-on-market for RENTAL listings here right now (not sales)? A rising rental-DOM trend means longer vacancies and softer asking-rent achievability than the comps imply.
- What's the recent tenant-quality profile in this submarket — average credit score on applications, eviction rate, late-payment / NSF rate, and stable-employment percentage? A property-management company in the area should have these aggregated.
- How much new for-sale + rental construction is in the pipeline within 1–3 miles? Heavy new supply typically softens prices + rents 12–24 months out; constrained supply supports both.
Investment metrics
- 1% rule
- 0.84% ✗
- Cap rate
- 7.17%
- Cash-on-cash
- 3.12%
- DSCR
- 1.14
- GRM
- 10.0
CMA / ARV
- ARV (on-the-fly)
- $183,300
- Comps found
- 12
Show comp detail 12 sales within ~0.75 mi
| Address | Dist | Beds/Ba | Sqft | Sold | Price | $/sf | Match |
|---|---|---|---|---|---|---|---|
| 2039 Sauvage Ave | 0.14mi | 3/2.0 | 1,400 (+8%) | 8mo | $175,000 | $125 | 74 |
| 1852 Bonnie Ann Dr | 0.33mi | 3/1.5 | 1,291 (-1%) | 13mo | $150,000 | $116 | 70 |
| 5521 Wabash Dr | 0.38mi | 3/2.0 | 1,357 (+4%) | 8mo | $215,000 | $158 | 68 |
| 5841 Milladorn Ave | 0.54mi | 3/2.0 | 1,235 (-5%) | 3mo | $205,000 | $166 | 64 |
| 6444 Millender Dr | 0.35mi | 4/2.0 (+1) | 1,417 (+9%) | 5mo | $160,000 | $113 | 60 |
| 5816 Glasco Dr | 0.57mi | 3/2.0 | 1,225 (-6%) | 6mo | $183,000 | $149 | 59 |
| 2232 Potomac Dr | 0.40mi | 3/2.0 | 1,478 (+14%) | 1mo | $225,000 | $152 | 58 |
| 5824 Rue Montespan Ave | 0.19mi | 4/2.0 (+1) | 1,455 (+12%) | 11mo | $205,000 | $141 | 57 |
| 2020 Bonnie Ann Dr | 0.31mi | 2/2.0 (-1) | 1,187 (-9%) | 11mo | $138,000 | $116 | 57 |
| 2205 Sauvage Ave | 0.28mi | 4/2.0 (+1) | 1,485 (+14%) | 6mo | $195,000 | $131 | 53 |
| 6529 Rue Louis Philippe | 0.39mi | 3/2.0 | 1,470 (+13%) | 13mo | $230,000 | $156 | 49 |
| 1652 Hope Dr | 0.66mi | 3/1.0 | 1,150 (-12%) | 1mo | $115,000 | $100 | 45 |
Match score weights: distance 35% · size 25% · config 20% · recency 20%. Top-matched comps best support the ARV.
Projected returns pro-forma
-3.0% appreciation · 1.05% rent growth · sell at horizon
- IRR
- -15.6%
- Equity multiple
- 0.46×
- Total profit
- $-31,705
- Equity at exit
- $31,013
- IRR
- -10.5%
- Equity multiple
- 0.41×
- Total profit
- $-34,113
- Equity at exit
- $17,984
Cash invested: $58,240 (down + closing). Projections, not guarantees.
Landlord ↔ Tenant lean methodology
- Overall (STATE)
- 90 Strongly Landlord-Friendly
- State Louisiana
- 90 Strongly Landlord-Friendly · R+12
- County
- — inherits STATE
- City
- — inherits STATE
ZIP-level market 70072
- Rents YoY
- 1.1%
- Active inventory
- 299
- Price-to-rent
- 10.0×
Monthly cashflow live
- Estimated rent
- $1,739 high interval (Pro) →
- Mortgage (P&I)
- −$1,091
- Tax from tax record
- −$45 /mo · $542/yr
- Insurance
- −$87
- Flood insurance flood zone
- −$66 /mo · $798/yr
- HOA
- −$0
- Vacancy / Maint / Mgmt
- −$365
- Net cashflow
- $85
Break-even live
Sensitivity live
| Price | -10% $203 | -5% $144 | +0% $85 | +5% $26 | +10% $-33 |
|---|---|---|---|---|---|
| Rent | -10% $-52 | -5% $16 | +0% $85 | +5% $154 | +10% $222 |
| Rate | -1.0pp $190 | -0.5pp $138 | base $85 | +0.5pp $31 | +1.0pp $-24 |
UW: 25.0% down · 7.5% · 30yr · 1.5% tax · 5.0% vac · 8.0% maint · 8.0% mgmt
Financing live
Cash to close
- Down payment
- $52,000
- Closing costs
- $6,240
- Reserves months
- —
- Total cash needed
- —
Loan-product check · same deal, 3 products live
Conventional
25% down · 7.5% · 30yr
- Down + closing
- —
- Monthly P&I
- —
- Monthly cashflow
- —
- DSCR
- —
- Eligible?
- —
Personal DTI + credit; lowest rate.
DSCR
20% down · 8.5% · 30yr
- Down + closing
- —
- Monthly P&I
- —
- Monthly cashflow
- —
- DSCR
- —
- Eligible?
- —
No personal income docs; deal must DSCR.
Hard money
10% down · 12.0% · 12mo
- Down + closing
- —
- Monthly P&I
- —
- Monthly cashflow
- —
- DSCR
- —
- Eligible?
- —
Short-term bridge; refi at stabilization.
Rent comps 21 comps
| Address | Beds | Baths | Sqft | Rent | $/sqft | DOM | Units | Dist |
|---|---|---|---|---|---|---|---|---|
| 5504 Randolph St Marrero, LA | 3.0 | 2.0 | 1800 | $1,800 | $1.00 | 25d | 1 | 0.45mi |
| 1728 Irma St Marrero, LA | 3.0 | 2.0 | 1450 | $1,550 | $1.07 | 25d | 1 | 0.46mi |
| 1836 Plaza Dr Unit A Marrero, LA | 3.0 | 1.0 | 1040 | $1,700 | $1.63 | 45d | 1 | 0.58mi |
| 1836 Plaza Dr Unit C Marrero, LA | 3.0 | 1.0 | 1040 | $1,700 | $1.63 | 6d | 1 | 0.58mi |
| 5128 Eden Roc Dr Marrero, LA | 3.0 | 2.0 | 1400 | $1,750 | $1.25 | 6d | 1 | 0.71mi |
| 5119 Oak Dr Marrero, LA | 3.0 | 2.0 | 1624 | $1,750 | $1.08 | 16d | 1 | 0.82mi |
| 5045 Dueling Oaks Ave Marrero, LA | 3.0 | 2.0 | 1300 | $1,700 | $1.31 | 25d | 1 | 0.84mi |
| 2325 Wilton St Unit A Marrero, LA | 2.0 | 1.0 | 1000 | $1,200 | $1.20 | 45d | 1 | 0.92mi |
| 5007 Towering Oaks Ave Marrero, LA | 3.0 | 2.0 | 1400 | $1,700 | $1.21 | 45d | 1 | 0.93mi |
| 1510 Javez St Marrero, LA | 3.0 | 2.0 | 1578 | $2,200 | $1.39 | 25d | 1 | 0.94mi |
| 5027 Richland Dr Marrero, LA | 2.0 | 1.5 | 1260 | $1,500 | $1.19 | 6d | 1 | 0.94mi |
| 5118 Ehret Rd Unit B Marrero, LA | 3.0 | 2.5 | 1275 | $1,800 | $1.41 | 6d | 1 | 0.99mi |
| 1917 Gladstone Dr Marrero, LA | 3.0 | 2.0 | 1090 | $1,600 | $1.47 | 25d | 1 | 1.02mi |
| 5913 S Oak Dr Marrero, LA | 4.0 | 2.0 | 1300 | $1,950 | $1.50 | 25d | 1 | 1.04mi |
| 5162 Mount Matterhorn Ave Marrero, LA | 2.0 | 1.0 | 1000 | $1,050 | $1.05 | 6d | 1 | 1.20mi |
| 5160 Mount Matterhorn St Marrero, LA | 2.0 | 1.0 | 1000 | $1,050 | $1.05 | 25d | 1 | 1.21mi |
| 5160 Evans Dr Marrero, LA | 3.0 | 1.0 | 1000 | $1,500 | $1.50 | 45d | 1 | 1.28mi |
| 1501 Somerset Pl Marrero, LA | 3.0 | 2.0 | 1697 | $1,850 | $1.09 | 25d | 1 | 1.32mi |
| 1501 Somerset Pl Marrero, LA | 3.0 | 2.0 | 1697 | $1,850 | $1.09 | 45d | 1 | 1.32mi |
| 2632 Dove Ave Unit NA Marrero, LA | 3.0 | 2.0 | 1250 | $1,650 | $1.32 | 45d | 1 | 1.35mi |
| 116 Sunrise Dr Marrero, LA | 3.0 | 1.5 | 1225 | $1,750 | $1.43 | 45d | 1 | 1.41mi |
Listing history 17 events
-
2026-06-21days on market $208,000 Active 26 DOM
-
2026-06-18days on market $208,000 Active 23 DOM
-
2026-06-17days on market $208,000 Active 22 DOM
-
2026-06-16days on market $208,000 Active 21 DOM
-
2026-06-15days on market $208,000 Active 20 DOM
-
2026-06-13days on market $208,000 Active 18 DOM
-
2026-06-10days on market $208,000 Active 15 DOM
-
2026-06-09days on market $208,000 Active 14 DOM
-
2026-06-08days on market $208,000 Active 13 DOM
-
2026-06-07days on market $208,000 Active 12 DOM
-
2026-06-03days on market $208,000 Active 8 DOM
-
2026-06-02days on market $208,000 Active 7 DOM
-
2026-06-01days on market $208,000 Active 6 DOM
-
2026-05-31days on market $208,000 Active 5 DOM
-
2026-05-26$208,000 Active
-
2023-01-13$150,000
-
1991-12-01soldstatus $9,000
ⓘ Source: listings_history table (triggers on properties + properties_extension) + one-shot
backfill from property_details.listing_events for pre-trigger history.
Tax reassessment forecast LA · Resets to sale price
- Current annual tax
- $542 · $45/mo
- Projected year-2 tax
- $1,144 · $95/mo
- Expected delta
- +$602/yr (+$50/mo · 110.9%)
ⓘ Screening estimate from a state-policy table — verify with the county assessor before closing.
Climate risk First Street
- Flood 8/10 Severe FEMA zone X (shaded) · 60% chance over 30 yrs
- Wildfire 1/10 Low
- Heat 10/10 Extreme 7 d/yr ≥109°F today · 21 d/yr by 30 yrs out
- Wind 10/10 Extreme 99% chance of damaging wind over 30 yrs
- Air quality 3/10 Moderate 3 unhealthy d/yr today · 4 by 30 yrs out
Nearby sold comps map
Loading sold comps map…
Walkable amenities ~0.75 mi
Loading nearby amenities…
Taxation est. · year 1
- Rental income
- $20,872
- − Mortgage interest
- −$11,651
- − Property taxes
- −$542
- − Insurance
- −$1,838
- − Repairs & maintenance
- −$1,670
- − Management
- −$1,670
- − Depreciation
- −$6,051
- Taxable loss
- −$2,550
- Est. tax savings @ 24.0%
- +$612
- After-tax cash flow
- $1,632/yr
For passive investors: Depreciation is non-cash, so a rental often shows a tax loss while cash-flowing — sheltering income. Rental losses are passive: they offset passive income freely, and up to $25,000/yr can offset ordinary (W-2) income if you actively participate and your MAGI is under $100k (phasing out to $0 by $150k); unused losses carry forward. On sale, claimed depreciation is recaptured at up to 25%, and gains may owe capital-gains tax (a 1031 exchange can defer both). Figures are a year-1 estimate at your 24.0% rate — not tax advice; consult a CPA.
Schools (NCES district)
- District
- Jefferson Parish
- NCES district ID
- 2200840
- Math proficiency
- 24% ▼ -36.00%
- Reading proficiency
- 34% ▼ -30.00%
- Median HH income
- $48,421
- Composite
- 25.19/100
- National rank
- #7511
- State rank
- #44 of 98 in LA
Livability — Marrero
- Score
- 67/100
- State rank
- #104
- US rank
- #10146
Category grades
Schools grade is shown separately in the Schools card above.
Census & demographics
- Census place
- Marrero, LA
- County
- Jefferson Parish · 426,999 people
- City population
- 55,693
- Metro
- New Orleans-Metairie, LA
- Population (ZIP)
- 55,693
- Household income
- $54,885
- Rent vs Own
- Severe rent burden
- 1807.0
Population outlook (Jefferson County) Hauer SSP2
- Today (2025)
- 451,696 people
- By 2030
- 455,451 · +0.8%
- By 2040
- 458,308 · +1.5%
- By 2050
- 461,031 · +2.1%
- By 2075
- 476,351 · +5.5%
- By 2100
- 499,377 · +10.6%
Race, ethnicity, and origin ACS 2023
- Neighborhood character
- Diverse neighborhood (Simpson 0.67)
- Race & ethnicity
- Black 40% White 39% Hispanic / Latino 12% Two or more races 7% Asian 5%
- Hispanic origin (detail)
- Mexican 4% Dominican 1%
- Common ancestry
- Lithuanian 12% Hispanic 1%
- Foreign-born
- 10% · Canada, Vietnam, Jamaica
- Languages at home
- 85% English-only · Spanish 8% Vietnamese 4% French/Haitian/Cajun 2%
Political lean MEDSL · Jefferson
- 2024 margin
- R (+12.9) · D 42.5% · R 55.5% · Other 2.1%
- 2008→2024 swing
- +13.6pp toward D · 2008: -26.6pp · 2024: -12.9pp
- All cycles
- 2024: R+12.9 2020: R+11.1 2016: R+14.8 2012: R+18.4 2008: R+26.6
Not yet ingested
- Civics
- —
Market trends
- HPI YoY
- ▼ -89.87%
- Current HPI
- 161.7477
- Rent YoY
- ▲ 1.05%
- Metro
- New Orleans-Metairie, LA
- State GDP YoY
- ▲ 3.29%
- F500 in state
- 10
Industry mix (Fortune 500 HQ in LA)
| Industry | F500 HQs | Revenue |
|---|---|---|
| Telecommunications | 2 | $23B |
|
||
| Utilities | 1 | $12B |
|
||
| Wholesale / Distribution | 1 | $5B |
|
||
| Advertising | 1 | $2B |
|
||
Price history
+2211.1% since first listed3 events — show timeline
- 2026-05-26 Listed $208,000 FSBO.com
- 2023-01-13 Listed $150,000 AcadianaMLS
- 1991-12-01 Sold (Public Records) $9,000 Public Records
Property tax history
+2.5%/yrLatest (2025): $542 · +0.3% YoY. Source: county tax records.
Cash-flow waterfall
monthlySold comps — $/sqft
last 12 mo · ≤1 miLoading sold comps…