5012 Gramercy Rd · Port LaBelle, FL
Flood risk 5/10 · Moderate
- FEMA flood zone
- X (unshaded)
- Chance of flooding over 30 yrs
- 0.62%
- Est. flood insurance / yr
- $507 – $1,088
Fire risk 5/10 · Moderate
- Est. fire insurance / yr
- $947 – $1,759
Heat risk 9/10 · Severe
- Hot days now (above 108°F)
- 7 days/yr
- Hot days in 30 yrs
- 24 days/yr
Wind risk 10/10 · Severe
- Chance of severe wind over 30 yrs
- 99.0%
Air-quality risk 2/10 · Minimal
- Unhealthy air days now
- 0 days/yr
- Unhealthy air days in 30 yrs
- 1 days/yr
Risk factors via First Street. Map © Google.
Why this score? — see what drove the C- grade
The composite is a weighted blend of 9 inputs, each scored 0–100. Each bar is that input's sub-score; the figure is the points it added to the 100-point composite (weight × sub-score).
- Cash flow +14.6/30.0
- Appreciation +10.0/10.0
- ARV discount +7.5/15.0
- DSCR +4.5/10.0
- 1% rule +4.0/10.0
- Schools +3.1/10.0
- Livability +3.1/5.0
- Rent growth +2.5/5.0
- Condition / age +2.5/5.0
$279,999
🖨 Deal sheet 📄 Offer letter ✓ Due diligence
Listing remarks
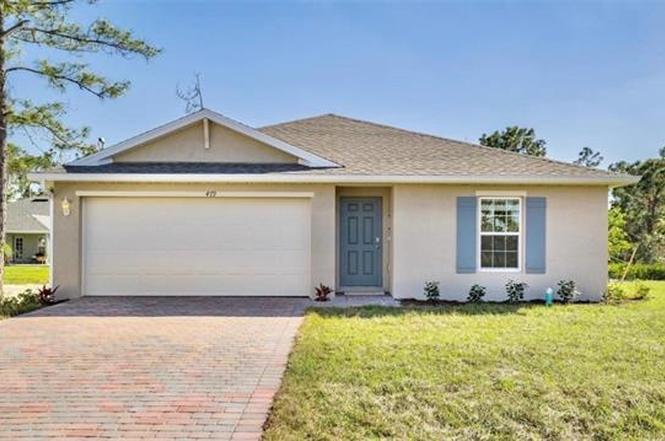
Under Construction. The appealing one-story home includes many contemporary features and an open-concept design with 8'8" ceilings that enhance the wonderful feel of this home. The well-appointed kitchen includes a large island, perfect for bar-style eating or entertaining, a walk-in pantry, and plenty of cabinets and counter space. The dining room overlooks the covered lanai, which is a great area for relaxing and dining al fresco. The large primary bedroom, located at the back of the home for privacy, can comfortably fit a king-size bed and includes an En Suite bathroom with double vanity, big walk-in closet, and separate linen closet. This open concept Home comes with designer cabin
Key facts
- En suite bathroom
- One story home
- Open concept design
Tags
Property features AI
Finance
- Other: Lot roughly 0.249 acres (regular lot); Lot dimensions approx. 80' x 125', total area 1,980 sq ft (developer brochure); Directions available from State Rd 29 to property on Gramercy Rd; Single unit building on a single-floor
- HOA & community: No HOA maintenance; Community amenities: none; Non-gated community
Exterior
- Parking: Attached 2-car garage; Paved driveway
- Utilities: Well water; Septic sewer; Electric service (central); Cable available
- Home design: Single-family home; 1 story (ranch); Rear exposure facing west; Residential property in Port LaBelle development
- Construction: Concrete block construction; Built in 2026
- Exterior features: Room for pool; Automatic sprinkler system; Shutters (manual); Single hung windows; Shingle roof; Stucco exterior finish; Paved road access; Well irrigation
Interior
- Kitchen: Dishwasher; Microwave; Range; Refrigerator/ice maker; Self-cleaning oven; Pantry
- Bedrooms: 4 bedrooms (split bedroom layout)
- Flooring: Laminate flooring
- Bathrooms: 2 full bathrooms; Master bathroom with shower only
- Heating & cooling: Central electric heat; Central electric cooling
- Interior features: Cable prewire; Smoke detectors; Walk-in closet; Window coverings; Open porch/lanai; Pantry; Great room floor plan; Split bedroom floor plan; Unfurnished
- Laundry & utility: Laundry in residence; Washer/dryer hookup; Water treatment system (owned); Auto garage door
Neighborhood map
What this means for you Summary
Snapshot
- This is a 4-bed/2.0-bath land listed at $280k.
Deal economics
- At list price, monthly cash flow is $66 ($793/yr) — positive.
- The deal already cash-flows at list — no discount required.
- To meet the 1% rule (rent ≥ 1% of price), the offer needs to be $253k (9.5% below list).
- Recommended offer: $246k (12.0% below list) — sets the bar for market timing.
- Cap rate 6.6% vs local median 5.1% in Port LaBelle — meaningfully above typical; check what's discounted (condition, days-on-market, listing class) to confirm the premium yield is real.
Location & tenants
- Location reads 62/100 on livability (#750 in FL) — a middle-class / working-renter tenant base. Strengths: cost of living A+, housing A+; Watch: schools F, amenities F, commute F.
- Hendry (town): math 35% / reading 40% proficiency, ranked #65 of 73 in FL (top 89%) — families likely to look elsewhere, expect single-tenant / working-renter base with shorter leases; 75% free/reduced lunch — lower-income household profile, screen leases tightly.
- Market conditions: 942 active listings in the ZIP; 7 comparable units currently listed for rent nearby; rentals at typical pace (median 16d on market — plan ~3-4 weeks tenant-placement turnaround); 557 units permitted in Hendry County in 2024 (45 in 5+ unit buildings).
- At $2,533/mo this rent would consume 53% of the median local household income ($57k/yr) (locally 498% of renters already pay >50% of income on rent) — very limited rent-growth headroom before tenants either downsize or default.
Forward outlook
- In year one you build about $30k of equity ($2k loan paydown + $28k appreciation (10.0% local appreciation)).
- Hendry County population projected to shrink 7% by 2050 — rents likely to lag national; underwrite the cash flow, not the appreciation.
- At projected returns (10.0% appreciation + 3.0% rent growth), your $78k cash investment doubles in ~3 years — after that, you're playing with house money.
- By year 2, paydown + projected appreciation supports a ~$48k cash-out refi (75% LTV) — recoverable capital for the next deal without selling this one.
Negotiation context
- It's been on market 147 days — a 12% lower offer ($246k) is reasonable based on typical stale-listing flexibility.
- 3 sale attempts; this cycle's ask has dropped $20k (7%) from the opening price — seller is motivated, your offer sets the floor, not the list.
- Current owner paid $22k; list at $280k implies a 1173% gain — meaningful room to come down on a strong offer.
Risks & watch-outs
- Climate carrying-cost: moderate flood risk; severe wind risk, 99% chance of damaging wind over 30y; moderate wildfire risk; extreme-heat days projected 7→24/yr by 2055 (HVAC capex compounding) — expect insurance premiums to compound above CPI over the hold.
Questions for the listing agent
- It's been on market 147 days. Have you received any prior offers? Is the seller open to a 12% concession, seller financing, or rate buy-down credit?
- Why hasn't it sold? Are there any deal-killer items the seller is aware of (foundation, flood, title, zoning, code violations)?
- Is there a deadline driving the sale (1031 exchange, divorce, estate, relocation)? That informs how much negotiation room exists.
- Schools are F-rated, which usually means shorter tenancies and higher turnover. Who's the typical renter profile here, and what's been the actual vacancy rate?
- What's the average days-on-market for RENTAL listings here right now (not sales)? A rising rental-DOM trend means longer vacancies and softer asking-rent achievability than the comps imply.
- What's the recent tenant-quality profile in this submarket — average credit score on applications, eviction rate, late-payment / NSF rate, and stable-employment percentage? A property-management company in the area should have these aggregated.
- How much new for-sale + rental construction is in the pipeline within 1–3 miles? Heavy new supply typically softens prices + rents 12–24 months out; constrained supply supports both.
Investment metrics
- 1% rule
- 0.90% ✗
- Cap rate
- 6.58%
- Cash-on-cash
- 1.01%
- DSCR
- 1.05
- GRM
- 9.2
CMA / ARV
No comps found within radius.
Projected returns pro-forma
10.0% appreciation · 3.0% rent growth · sell at horizon
- IRR
- 25.0%
- Equity multiple
- 3.00×
- Total profit
- $156,742
- Equity at exit
- $252,245
- IRR
- 22.1%
- Equity multiple
- 6.85×
- Total profit
- $458,345
- Equity at exit
- $543,976
Cash invested: $78,400 (down + closing). Projections, not guarantees.
Landlord ↔ Tenant lean methodology
- Overall (STATE)
- 87 Strongly Landlord-Friendly
- State Florida
- 87 Strongly Landlord-Friendly · R+3
- County
- — inherits STATE
- City
- — inherits STATE
ZIP-level market 33935
- Home prices YoY
- 16.3%
- Active inventory
- 942
- Price-to-rent
- 9.2×
Monthly cashflow live
- Estimated rent
- $2,533 high interval (Pro) →
- Mortgage (P&I)
- −$1,468
- Tax est. 1.5%
- −$350 /mo · $4,200/yr
- Insurance
- −$117
- HOA
- −$0
- Vacancy / Maint / Mgmt
- −$532
- Net cashflow
- $66
Break-even live
UW: 25.0% down · 7.5% · 30yr · 1.5% tax · 5.0% vac · 8.0% maint · 8.0% mgmt
Financing live
Cash to close
- Down payment
- $70,000
- Closing costs
- $8,400
- Reserves months
- —
- Total cash needed
- —
Loan-product check · same deal, 3 products live
Conventional
25% down · 7.5% · 30yr
- Down + closing
- —
- Monthly P&I
- —
- Monthly cashflow
- —
- DSCR
- —
- Eligible?
- —
Personal DTI + credit; lowest rate.
DSCR
20% down · 8.5% · 30yr
- Down + closing
- —
- Monthly P&I
- —
- Monthly cashflow
- —
- DSCR
- —
- Eligible?
- —
No personal income docs; deal must DSCR.
Hard money
10% down · 12.0% · 12mo
- Down + closing
- —
- Monthly P&I
- —
- Monthly cashflow
- —
- DSCR
- —
- Eligible?
- —
Short-term bridge; refi at stabilization.
Rent comps 7 comps
| Address | Beds | Baths | Sqft | Rent | $/sqft | DOM | Units | Dist |
|---|---|---|---|---|---|---|---|---|
| 5029 W Hummingbird Dr Labelle, FL | 3.0 | 2.0 | 1212 | $2,450 | $2.02 | 3d | 1 | 0.15mi |
| 5012 Gunn Pl Labelle, FL | 3.0 | 2.5 | 1783 | $2,500 | $1.40 | 3d | 1 | 0.25mi |
| 5029 S Rosebud Cir Labelle, FL | 3.0 | 2.0 | 1389 | $1,780 | $1.28 | 23d | 1 | 0.59mi |
| 3051 NW Beechwood Cir Labelle, FL | 4.0 | 2.0 | 1499 | $2,200 | $1.47 | 23d | 1 | 0.68mi |
| 801 SW Raintree Blvd Labelle, FL | 3.0 | 2.0 | 1285 | $1,700 | $1.32 | 23d | 1 | 1.01mi |
| 7038 Lotus Cir Labelle, FL | 4.0 | 3.0 | 1680 | $2,200 | $1.31 | 16d | 1 | 1.13mi |
| 7016 Palpano Cir Labelle, FL | 3.0 | 2.5 | 1507 | $2,100 | $1.39 | 16d | 1 | 1.43mi |
Listing history 13 events
-
2026-05-18status Pending
-
2026-05-08price $279,999
-
2026-03-13price $274,999
-
2026-01-08price $294,999
-
2025-12-22$300,490 Active
-
2025-09-11soldstatus $22,000 Closed
-
2025-09-11soldstatus $22,000
-
2025-09-11$22,000
-
2025-09-11soldstatus $22,000
-
2025-08-16status Pending
-
2025-04-24historical Active Under Contract
-
2025-04-10$24,000 Active
-
2003-11-07soldstatus $8,500
ⓘ Source: listings_history table (triggers on properties + properties_extension) + one-shot
backfill from property_details.listing_events for pre-trigger history.
Climate risk First Street
- Flood 5/10 Major FEMA zone X (unshaded) · 62% chance over 30 yrs
- Wildfire 5/10 Major
- Heat 9/10 Extreme 7 d/yr ≥108°F today · 24 d/yr by 30 yrs out
- Wind 10/10 Extreme 99% chance of damaging wind over 30 yrs
- Air quality 2/10 Low 0 unhealthy d/yr today · 1 by 30 yrs out
Nearby sold comps map
Loading sold comps map…
Walkable amenities ~0.75 mi
Loading nearby amenities…
Taxation est. · year 1
- Rental income
- $30,396
- − Mortgage interest
- −$15,684
- − Property taxes
- −$4,200
- − Insurance
- −$1,400
- − Repairs & maintenance
- −$2,432
- − Management
- −$2,432
- − Depreciation
- −$8,145
- Taxable loss
- −$3,897
- Est. tax savings @ 24.0%
- +$935
- After-tax cash flow
- $1,728/yr
For passive investors: Depreciation is non-cash, so a rental often shows a tax loss while cash-flowing — sheltering income. Rental losses are passive: they offset passive income freely, and up to $25,000/yr can offset ordinary (W-2) income if you actively participate and your MAGI is under $100k (phasing out to $0 by $150k); unused losses carry forward. On sale, claimed depreciation is recaptured at up to 25%, and gains may owe capital-gains tax (a 1031 exchange can defer both). Figures are a year-1 estimate at your 24.0% rate — not tax advice; consult a CPA.
Schools (NCES district)
- District
- Hendry
- NCES district ID
- 1200780
- Math proficiency
- 35% ▼ -11.00%
- Reading proficiency
- 40% ▼ -4.00%
- Median HH income
- $37,043
- Composite
- 31.16/100
- National rank
- #6054
- State rank
- #65 of 73 in FL
Livability — Port LaBelle
- Score
- 62/100
- State rank
- #750
- US rank
- #16264
Category grades
Schools grade is shown separately in the Schools card above.
Census & demographics
- Census place
- Port LaBelle, FL
- County
- Hendry County · 23,186 people
- Metro
- Clewiston, FL
- Population (ZIP)
- 23,186
- Household income
- $57,009
- Rent vs Own
- Severe rent burden
- 498.0
Population outlook (Hendry County) Hauer SSP2
- Today (2025)
- 38,866 people
- By 2030
- 38,558 · -0.8%
- By 2040
- 37,743 · -2.9%
- By 2050
- 36,117 · -7.1%
- By 2075
- 30,070 · -22.6%
- By 2100
- 21,966 · -43.5%
Race, ethnicity, and origin ACS 2023
- Neighborhood character
- Majority Hispanic (56%)
- Race & ethnicity
- Hispanic / Latino 56% White 39% Two or more races 21% Black 2% Native American 2%
- Hispanic origin (detail)
- Mexican 40% Puerto Rican 3% Cuban 5%
- Common ancestry
- Lithuanian 2% Serbian 2% Slovak 1%
- Foreign-born
- 27% · Canada, Jamaica
- Languages at home
- 50% English-only · Spanish 50%
Political lean MEDSL · Hendry
- 2024 margin
- Solid R (+38.3) · D 30.4% · R 68.7%
- 2008→2024 swing
- -31.1pp toward R · 2008: -7.2pp · 2024: -38.3pp
- All cycles
- 2024: R+38.3 2020: R+23.0 2016: R+14.2 2012: R+5.9 2008: R+7.2
Not yet ingested
- Civics
- —
Market trends
- HPI YoY
- ▲ 75.20%
- Current HPI
- 537.4928
- Rent YoY
- —
- Metro
- Clewiston, FL
- State GDP YoY
- ▲ 3.28%
- F500 in state
- 36
Industry mix (Fortune 500 HQ in FL)
| Industry | F500 HQs | Revenue |
|---|---|---|
| Industrial Technology | 2 | $29B |
|
||
| Insurance | 2 | $17B |
|
||
| Retail | 1 | $60B |
|
||
| Technology Distribution | 1 | $58B |
|
||
| Homebuilding | 1 | $35B |
|
||
| Technology Manufacturing | 1 | $35B |
|
||
Price history
+3194.1% since first listed13 events — show timeline
- 2026-05-18 Pending — NAPLESMLS
- 2026-05-08 Price Changed $279,999 NAPLESMLS
- 2026-03-13 Price Changed $274,999 NAPLESMLS
- 2026-01-08 Price Changed $294,999 NAPLESMLS
- 2025-12-22 Listed $300,490 NAPLESMLS
- 2025-09-11 Sold (Public Records) $22,000 Public Records
- 2025-09-11 Listed $22,000 Stellar MLS as Distributed by MLS Grid
- 2025-09-11 Sold (MLS) $22,000 Stellar MLS as Distributed by MLS Grid
- 2025-09-11 Sold (MLS) $22,000 Beaches MLS
- 2025-08-16 Pending — Beaches MLS
- 2025-04-24 Contingent — Beaches MLS
- 2025-04-10 Listed $24,000 Beaches MLS
- 2003-11-07 Sold (Public Records) $8,500 Public Records
Property tax history
+9.4%/yrLatest (2025): $379 · +19.3% YoY. Source: county tax records.
Cash-flow waterfall
monthlySold comps — $/sqft
last 12 mo · ≤1 miLoading sold comps…