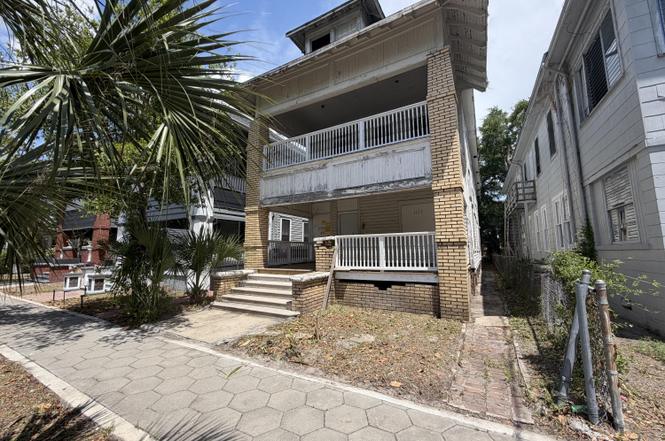
1619 N Laura St N · Jacksonville, FL
Flood risk 1/10 · Minimal
- FEMA flood zone
- X (unshaded)
- Chance of flooding over 30 yrs
- 0.0%
- Est. flood insurance / yr
- $507 – $1,088
Fire risk 1/10 · Minimal
- Est. fire insurance / yr
- $947 – $1,759
Heat risk 9/10 · Severe
- Hot days now (above 107°F)
- 7 days/yr
- Hot days in 30 yrs
- 20 days/yr
Wind risk 9/10 · Severe
- Chance of severe wind over 30 yrs
- 99.0%
Air-quality risk 5/10 · Moderate
- Unhealthy air days now
- 7 days/yr
- Unhealthy air days in 30 yrs
- 7 days/yr
Risk factors via First Street. Map © Google.
Why this score? — see what drove the C- grade
The composite is a weighted blend of 9 inputs, each scored 0–100. Each bar is that input's sub-score; the figure is the points it added to the 100-point composite (weight × sub-score).
- ARV discount +15.0/15.0
- Cash flow +14.7/30.0
- DSCR +4.5/10.0
- Livability +4.2/5.0
- Schools +3.9/10.0
- 1% rule +3.5/10.0
- Rent growth +2.7/5.0
- Condition / age +2.5/5.0
- Appreciation +0.0/10.0
$295,000
🖨 Deal sheet (PDF) 📄 Offer letter ✓ Due diligence
Listing remarks MLS
Historic Springfield is waiting for you!! This bank owned property has original hardwood floors in great condition!! One of Springfield's best street's!! Possible seller financing for a qualified buyer. Being sold As-Is, do inspections prior to making offer.
Key facts
- 3,049 sq ft lot
- Built 1899
- Listed 6 days
Property features AI
Exterior
- Parking: On-street parking
- Utilities: Electricity available; Water available
- Home design: Single Family Residence used for residential purposes
- Exterior features: Lot of 0.07 acres
Interior
- Bedrooms: 4 bedrooms
- Bathrooms: 3 full bathrooms
- Heating & cooling: No heating specified; No cooling specified
- Interior features: No built-in appliances listed
Neighborhood map
What this means for you Summary
Snapshot
- This is a 4-bed/4.0-bath single-family listed at $295k.
Deal economics
- At list price, monthly cash flow is $75 ($898/yr) — positive.
- The deal already cash-flows at list — no discount required.
- To meet the 1% rule (rent ≥ 1% of price), the offer needs to be $251k (14.9% below list).
- Recommended offer: $251k (14.9% below list) — sets the bar for 1% rule.
- Cap rate 6.6% vs local median 3.9% in Jacksonville — top-decile yield for the area; either an underpriced asset or a hidden risk that comps aren't pricing in. Stress-test before assuming the spread holds.
Location & tenants
- Location reads 83/100 on livability (#50 in FL, #911 nationally) — a professional / high-income tenant draw. Strengths: amenities A+, commute A+, housing A+.
- Duval (urban): math 46% / reading 45% proficiency, ranked #48 of 73 in FL (top 66%) — families likely to look elsewhere, expect single-tenant / working-renter base with shorter leases.
- Zoned schools: Andrew A. Robinson Elementary School (math 46% / reading 28%, grade F, #1,609 of 2,144 statewide, top 77%, 535 students, 81% FRL); Matthew W. Gilbert Middle School (math 26% / reading 17%, grade F, #553 of 571 statewide, top 97%, 688 students, 86% FRL); Andrew Jackson High School (math 30% / reading 26%, grade F, #464 of 667 statewide, top 70%, 870 students, 54% FRL) — zoned schools average 74% FRL vs 49% district-wide (24 pts higher); higher-poverty schools than district average — tighter screening recommended.
- Zoned-school proficiency averages 29% at this address vs 46% district-wide (-17 pts) — the specific schools serving this property underperform the Duval average; the district grade overstates school quality for this exact location.
- Market conditions: Rents flat; 200 active listings in the ZIP; 4 comparable units currently listed for rent nearby; rentals at typical pace (median 26d on market — plan ~3-4 weeks tenant-placement turnaround); lower-income renter base — watch delinquency; 6,503 units permitted in Duval County in 2024 (1,131 in 5+ unit buildings).
Forward outlook
- Local home prices are declining (-3.0%/yr); year-one equity from $2k of loan paydown is wiped out by about $9k of value loss. Plan a longer hold.
- Duval County population projected at +19% by 2050 — long-run rental-demand tailwind backs the buy-and-hold thesis.
Negotiation context
- Only 6 days on market — expect competitive offers; lowballing is unlikely to land.
- 4 sale attempts since 25y ago with the ask held roughly flat each time — persistent listings suggest the price (not the market) is what's stuck; bring a comps-based counter.
- Current owner paid $179k; list at $295k implies a 65% gain — meaningful room to come down on a strong offer.
Risks & watch-outs
- Watch-outs: built in 1899 — expect roof / HVAC / electrical / plumbing capex.
- Climate carrying-cost: severe wind risk, 99% chance of damaging wind over 30y; extreme-heat days projected 7→20/yr by 2055 (HVAC capex compounding) — expect insurance premiums to compound above CPI over the hold.
Questions for the listing agent
- Built in 1899 — when were the roof, HVAC, electrical panel, plumbing, and water heater last replaced?
- Is there a deadline driving the sale (1031 exchange, divorce, estate, relocation)? That informs how much negotiation room exists.
- Schools are B-rated — typically a magnet for longer-tenancy family renters. What's the average tenant stay here, and is there a school-zone premium baked into asking?
- What's the average days-on-market for RENTAL listings here right now (not sales)? A rising rental-DOM trend means longer vacancies and softer asking-rent achievability than the comps imply.
- What's the recent tenant-quality profile in this submarket — average credit score on applications, eviction rate, late-payment / NSF rate, and stable-employment percentage? A property-management company in the area should have these aggregated.
- How much new for-sale + rental construction is in the pipeline within 1–3 miles? Heavy new supply typically softens prices + rents 12–24 months out; constrained supply supports both.
Investment metrics
- 1% rule
- 0.85% ✗
- Cap rate
- 6.60%
- Cash-on-cash
- 1.09%
- DSCR
- 1.05
- GRM
- 9.8
CMA / ARV
- ARV (on-the-fly)
- $580,580
- Comps found
- 12
Show comp detail 12 sales within ~0.75 mi
| Address | Dist | Beds/Ba | Sqft | Sold | Price | $/sf | Match |
|---|---|---|---|---|---|---|---|
| 1706 Silver St | 0.14mi | 3/2.5 (-1) | 2,788 (-2%) | 3mo | $565,000 | $203 | 76 |
| 1449 N Pearl St | 0.24mi | 4/2.0 | 2,859 (-0%) | 12mo | $575,000 | $201 | 71 |
| 419 E 6th St | 0.49mi | 5/3.0 (+1) | 2,836 (-1%) | 1mo | $585,000 | $206 | 66 |
| 104 E 5th St | 0.23mi | 3/3.0 (-1) | 2,953 (+3%) | 11mo | $619,000 | $210 | 66 |
| 220 E 7th St | 0.30mi | 5/3.0 (+1) | 2,901 (+1%) | 15mo | $469,900 | $162 | 62 |
| 1223 Hubbard St | 0.41mi | 4/2.5 | 2,768 (-3%) | 10mo | $585,000 | $211 | 61 |
| 1826 Silver St | 0.23mi | 4/2.5 | 2,676 (-6%) | 16mo | $307,500 | $115 | 59 |
| 145 W 10th St | 0.36mi | 4/2.5 | 2,947 (+3%) | 16mo | $210,000 | $71 | 58 |
| 414 E 4th St | 0.54mi | 5/4.0 (+1) | 3,006 (+5%) | 10mo | $684,801 | $228 | 53 |
| 1626 N Liberty St | 0.34mi | 5/3.5 (+1) | 3,200 (+12%) | 8mo | $650,000 | $203 | 51 |
| 122 W 10th St | 0.32mi | 4/2.0 | 3,136 (+10%) | 16mo | $550,000 | $175 | 48 |
| 1936 N Market St | 0.39mi | 4/3.0 | 2,433 (-15%) | 7mo | $300,000 | $123 | 47 |
Match score weights: distance 35% · size 25% · config 20% · recency 20%. Top-matched comps best support the ARV.
Projected returns pro-forma
-3.0% appreciation · 0.94% rent growth · sell at horizon
- IRR
- -16.8%
- Equity multiple
- 0.42×
- Total profit
- $-48,175
- Equity at exit
- $43,985
- IRR
- -12.6%
- Equity multiple
- 0.32×
- Total profit
- $-56,055
- Equity at exit
- $25,506
Cash invested: $82,600 (down + closing). Projections, not guarantees.
Landlord ↔ Tenant lean methodology
- Overall (STATE)
- 87 Strongly Landlord-Friendly
- State Florida
- 87 Strongly Landlord-Friendly · R+3
- County
- — inherits STATE
- City
- — inherits STATE
ZIP-level market 32206
- Home prices YoY
- -23.7%
- Rents YoY
- 0.9%
- Active inventory
- 200
- Price-to-rent
- 9.8×
Monthly cashflow live
- Estimated rent
- $2,510 medium interval (Pro) →
- Mortgage (P&I)
- −$1,547
- Tax from tax record
- −$238 /mo · $2,857/yr
- Insurance
- −$123
- HOA
- −$0
- Vacancy / Maint / Mgmt
- −$527
- Net cashflow
- $75
Break-even live
Sensitivity live
| Price | -10% $242 | -5% $158 | +0% $75 | +5% $-9 | +10% $-92 |
|---|---|---|---|---|---|
| Rent | -10% $-123 | -5% $-24 | +0% $75 | +5% $174 | +10% $273 |
| Rate | -1.0pp $223 | -0.5pp $150 | base $75 | +0.5pp $-2 | +1.0pp $-79 |
UW: 25.0% down · 7.5% · 30yr · 1.5% tax · 5.0% vac · 8.0% maint · 8.0% mgmt
Financing live
Cash to close
- Down payment
- $73,750
- Closing costs
- $8,850
- Reserves months
- —
- Total cash needed
- —
Loan-product check · same deal, 3 products live
Conventional
25% down · 7.5% · 30yr
- Down + closing
- —
- Monthly P&I
- —
- Monthly cashflow
- —
- DSCR
- —
- Eligible?
- —
Personal DTI + credit; lowest rate.
DSCR
20% down · 8.5% · 30yr
- Down + closing
- —
- Monthly P&I
- —
- Monthly cashflow
- —
- DSCR
- —
- Eligible?
- —
No personal income docs; deal must DSCR.
Hard money
10% down · 12.0% · 12mo
- Down + closing
- —
- Monthly P&I
- —
- Monthly cashflow
- —
- DSCR
- —
- Eligible?
- —
Short-term bridge; refi at stabilization.
Rent comps 4 comps
| Address | Beds | Baths | Sqft | Rent | $/sqft | DOM | Units | Dist |
|---|---|---|---|---|---|---|---|---|
| 1931 Silver St Jacksonville, FL | 3.0 | 2.0 | 2132 | $2,600 | $1.22 | 25d | 1 | 0.28mi |
| 1827 N Market St Jacksonville, FL | 5.0 | 3.5 | 2750 | $3,100 | $1.13 | 19d | 1 | 0.35mi |
| 424 E 6th St Jacksonville, FL | 4.0 | 3.0 | 2746 | $2,895 | $1.05 | 25d | 1 | 0.52mi |
| 440 E 6th St Jacksonville, FL | 3.0 | 2.0 | 1968 | $2,100 | $1.07 | 25d | 1 | 0.55mi |
Listing history 7 events
-
2026-06-21days on market $295,000 Active 6 DOM
-
2026-06-18days on market $295,000 Active 3 DOM
-
2026-06-17remarks 437-char remark
-
2026-06-17remarks 388-char remark
-
2026-06-17days on market $295,000 Active 2 DOM
-
2026-06-16remarks 371-char remark
-
2026-06-16$295,000 Active 1 DOM
ⓘ Source: listings_history table (triggers on properties + properties_extension) + one-shot
backfill from property_details.listing_events for pre-trigger history.
Tax reassessment forecast FL · Resets to sale price
- Current annual tax
- $2,857 · $238/mo
- Projected year-2 tax
- $2,857 · $238/mo
- Expected delta
- $0/yr ($0/mo · 0.0%)
ⓘ Screening estimate from a state-policy table — verify with the county assessor before closing.
Climate risk First Street
- Flood 1/10 Low FEMA zone X (unshaded) · 0% chance over 30 yrs
- Wildfire 1/10 Low
- Heat 9/10 Extreme 7 d/yr ≥107°F today · 20 d/yr by 30 yrs out
- Wind 9/10 Extreme 99% chance of damaging wind over 30 yrs
- Air quality 5/10 Major 7 unhealthy d/yr today · 7 by 30 yrs out
Nearby sold comps map
Loading sold comps map…
Walkable amenities ~0.75 mi
Loading nearby amenities…
Taxation est. · year 1
- Rental income
- $30,119
- − Mortgage interest
- −$16,525
- − Property taxes
- −$2,857
- − Insurance
- −$1,475
- − Repairs & maintenance
- −$2,410
- − Management
- −$2,410
- − Depreciation
- −$8,582
- Taxable loss
- −$4,138
- Est. tax savings @ 24.0%
- +$993
- After-tax cash flow
- $1,891/yr
For passive investors: Depreciation is non-cash, so a rental often shows a tax loss while cash-flowing — sheltering income. Rental losses are passive: they offset passive income freely, and up to $25,000/yr can offset ordinary (W-2) income if you actively participate and your MAGI is under $100k (phasing out to $0 by $150k); unused losses carry forward. On sale, claimed depreciation is recaptured at up to 25%, and gains may owe capital-gains tax (a 1031 exchange can defer both). Figures are a year-1 estimate at your 24.0% rate — not tax advice; consult a CPA.
Schools (NCES district)
- District
- Duval
- NCES district ID
- 1200480
- Math proficiency
- 46% ▼ -11.00%
- Reading proficiency
- 45% ▼ -4.00%
- Median HH income
- $48,987
- Composite
- 38.97/100
- National rank
- #4076
- State rank
- #48 of 73 in FL
Livability — Jacksonville
- Score
- 83/100
- State rank
- #50
- US rank
- #911
Category grades
Schools grade is shown separately in the Schools card above.
Census & demographics
- Census place
- Jacksonville, FL
- County
- Duval County · 1,015,274 people
- City population
- 979,034
- Metro
- Jacksonville, FL
- Population (ZIP)
- 17,105
- Household income
- $39,242
- Rent vs Own
- Severe rent burden
- 1057.0
Population outlook (Duval County) Hauer SSP2
- Today (2025)
- 1,013,010 people
- By 2030
- 1,059,228 · +4.6%
- By 2040
- 1,141,439 · +12.7%
- By 2050
- 1,205,258 · +19.0%
- By 2075
- 1,324,282 · +30.7%
- By 2100
- 1,319,620 · +30.3%
Race, ethnicity, and origin ACS 2023
- Neighborhood character
- Predominantly Black (65%)
- Race & ethnicity
- Black 65% White 22% Two or more races 8% Hispanic / Latino 6%
- Hispanic origin (detail)
- Mexican 1% Puerto Rican 2%
- Common ancestry
- Italian 2% Romanian 1% Slovak 1%
- Foreign-born
- 5% · Canada
- Languages at home
- 93% English-only · Spanish 3% Arabic 1% German/W. Germanic 1%
Political lean MEDSL · Duval
- 2024 margin
- Toss-up / Even · D 48.7% · R 50.1% · Other 1.2%
- 2008→2024 swing
- +0.4pp no change · 2008: -1.9pp · 2024: -1.5pp
- All cycles
- 2024: R+1.5 2020: D+3.8 2016: R+1.5 2012: R+3.6 2008: R+1.9
Not yet ingested
- Civics
- —
Market trends
- HPI YoY
- ▼ -64.55%
- Current HPI
- 208.1852
- Rent YoY
- ▲ 0.94%
- Metro
- Jacksonville, FL
- State GDP YoY
- ▲ 3.28%
- F500 in state
- 36
Industry mix (Fortune 500 HQ in FL)
| Industry | F500 HQs | Revenue |
|---|---|---|
| Industrial Technology | 2 | $29B |
|
||
| Insurance | 2 | $17B |
|
||
| Retail | 1 | $60B |
|
||
| Technology Distribution | 1 | $58B |
|
||
| Homebuilding | 1 | $35B |
|
||
| Technology Manufacturing | 1 | $35B |
|
||
Price history
+321.4% since first listed15 events — show timeline
- 2026-06-15 Listed $295,000 realMLS
- 2007-01-10 Listing Removed — realMLS
- 2007-01-05 Sold (MLS) $179,000 realMLS
- 2006-09-19 Listed $189,000 realMLS
- 2004-07-30 Listing Removed — realMLS
- 2004-07-27 Sold (MLS) $65,000 realMLS
- 2003-11-04 Sold (Public Records) $87,000 Public Records
- 2003-08-28 Listed $75,000 realMLS
- 2002-03-27 Listing Removed — realMLS
- 2001-09-26 Listed $103,000 realMLS
- 1998-11-02 Sold (Public Records) $36,000 Public Records
- 1996-03-01 Sold (Public Records) $22,000 Public Records
- 1988-08-01 Sold (Public Records) $112,000 Public Records
- 1983-05-01 Sold (Public Records) $75,000 Public Records
- 1982-03-01 Sold (Public Records) $70,000 Public Records
Property tax history
+15.2%/yrLatest (2025): $2,857 · +7.2% YoY. Source: county tax records.
Cash-flow waterfall
monthlySold comps — $/sqft
last 12 mo · ≤1 miLoading sold comps…