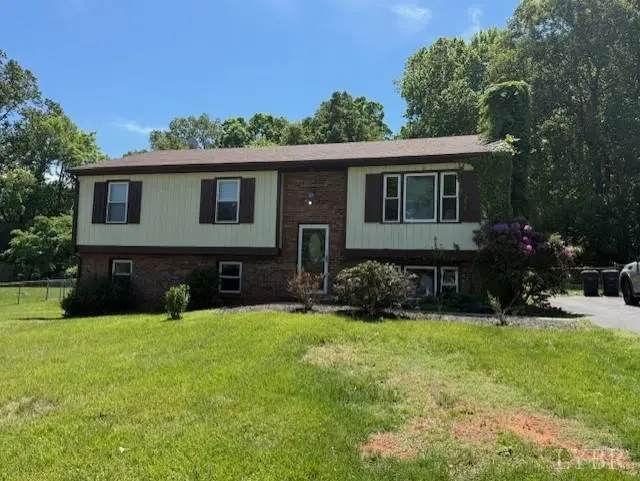
113 Hillview Dr · Lynchburg, VA
Flood risk 1/10 · Minimal
- FEMA flood zone
- X (unshaded)
- Chance of flooding over 30 yrs
- 0.0%
- Est. flood insurance / yr
- $473 – $860
Fire risk 3/10 · Minor
- Est. fire insurance / yr
- $666 – $1,236
Heat risk 5/10 · Moderate
- Hot days now (above 101°F)
- 7 days/yr
- Hot days in 30 yrs
- 18 days/yr
Wind risk 2/10 · Minimal
- Chance of severe wind over 30 yrs
- 3.0%
Air-quality risk 2/10 · Minimal
- Unhealthy air days now
- 0 days/yr
- Unhealthy air days in 30 yrs
- 1 days/yr
Risk factors via First Street. Map © Google.
Why this score? — see what drove the C+ grade
The composite is a weighted blend of 9 inputs, each scored 0–100. Each bar is that input's sub-score; the figure is the points it added to the 100-point composite (weight × sub-score).
- Cash flow +19.7/30.0
- ARV discount +15.0/15.0
- DSCR +6.2/10.0
- 1% rule +4.7/10.0
- Livability +4.5/5.0
- Schools +4.0/10.0
- Rent growth +3.8/5.0
- Condition / age +2.5/5.0
- Appreciation +0.0/10.0
$199,900
🖨 Deal sheet (PDF) 📄 Offer letter ✓ Due diligence
Listing remarks
Opportunity doesn't knock like this very often. This 1,741 sq ft brick split foyer is a true investor's canvas, solid bones, generous layout, and priced below market value to leave plenty of room for vision and profit. Whether you're looking to flip, rent, or create long-term equity, this one checks the boxes. Upstairs, you'll find a light-filled living room that welcomes in natural sunlight, a dedicated dining space perfect for gathering, and a kitchen ready for a full redesign. The primary suite includes half bath, accompanied by two additional bedrooms and a full hall bath, an ideal footprint for modern reconfiguration. Downstairs opens up even more possibilities: a spacious den anchored
Key facts
- Brick split foyer
- Spacious den
- 0.46 acre lot
Tags
Property features AI
Exterior
- Parking: Off-street parking
- Utilities: Public water; Septic tank
- Home design: Single-family residence; Residential property
- Construction: Brick construction; Shingle roof
- Exterior features: Garden; Deck
Interior
- Kitchen: Dishwasher; Electric range; Oven
- Flooring: Hardwood; Laminate; Vinyl; Wood
- Bathrooms: 1 full bathroom; 1 half bathroom
- Heating & cooling: Heat pump
- Interior features: Finished full basement with walk-out access; Fireplace in den
- Laundry & utility: Laundry located in basement; Electric water heater
Neighborhood map
What this means for you Summary
Snapshot
- This is a 4-bed/1.5-bath single-family listed at $200k.
Deal economics
- At list price, monthly cash flow is $235 ($3k/yr) — positive.
- The deal already cash-flows at list — no discount required.
- To meet the 1% rule (rent ≥ 1% of price), the offer needs to be $193k (3.4% below list).
- Recommended offer: $193k (3.4% below list) — sets the bar for 1% rule.
- Cap rate 7.7% vs local median 4.0% in Lynchburg — top-decile yield for the area; either an underpriced asset or a hidden risk that comps aren't pricing in. Stress-test before assuming the spread holds.
Location & tenants
- Location reads 91/100 on livability (#1 in VA, #58 nationally) — a professional / high-income tenant draw. Strengths: amenities A+, commute A+, cost of living A+; Watch: crime C-, employment D+.
- Lynchburg City Public School District (urban): math 36% / reading 61% proficiency, ranked #104 of 131 in VA (top 79%) — families likely to look elsewhere, expect single-tenant / working-renter base with shorter leases; 61% free/reduced lunch — lower-income household profile, screen leases tightly.
- Zoned schools: Sandusky Elementary (math 47% / reading 67%, grade C+, #597 of 1,108 statewide, top 57%, 352 students, 91% FRL); Sandusky Middle (math 29% / reading 52%, grade F, #303 of 342 statewide, top 89%, 568 students, 96% FRL); Heritage High (math 32% / reading 77%, grade C-, #281 of 319 statewide, top 90%, 1,073 students, 94% FRL) — zoned schools average 94% FRL vs 61% district-wide (33 pts higher); higher-poverty schools than district average — tighter screening recommended.
- Market conditions: Rents rising fast (+5.1%/yr); 324 active listings in the ZIP; 13 comparable units currently listed for rent nearby; rentals at typical pace (median 23d on market — plan ~3-4 weeks tenant-placement turnaround); 46% of comp listings sitting > 30 days — soft ceiling on asking rent; 472 units permitted in Lynchburg city in 2024 (240 in 5+ unit buildings).
- This rent runs 34% of the median local income ($69k/yr) — at the standard rent-burdened threshold; future hikes will face affordability resistance.
Forward outlook
- Local home prices are declining (-3.0%/yr); year-one equity from $1k of loan paydown is wiped out by about $6k of value loss. Plan a longer hold.
- Lynchburg County population projected at +37% by 2050 — long-run rental-demand tailwind backs the buy-and-hold thesis.
Negotiation context
- It's been on market 19 days — a 2% lower offer ($197k) is reasonable based on typical stale-listing flexibility.
Risks & watch-outs
- Climate carrying-cost: extreme-heat days projected 7→18/yr by 2055 (HVAC capex compounding) — expect insurance premiums to compound above CPI over the hold.
Questions for the listing agent
- Is there a deadline driving the sale (1031 exchange, divorce, estate, relocation)? That informs how much negotiation room exists.
- Schools are A-rated — typically a magnet for longer-tenancy family renters. What's the average tenant stay here, and is there a school-zone premium baked into asking?
- What's the average days-on-market for RENTAL listings here right now (not sales)? A rising rental-DOM trend means longer vacancies and softer asking-rent achievability than the comps imply.
- What's the recent tenant-quality profile in this submarket — average credit score on applications, eviction rate, late-payment / NSF rate, and stable-employment percentage? A property-management company in the area should have these aggregated.
- How much new for-sale + rental construction is in the pipeline within 1–3 miles? Heavy new supply typically softens prices + rents 12–24 months out; constrained supply supports both.
Investment metrics
- 1% rule
- 0.97% ✗
- Cap rate
- 7.70%
- Cash-on-cash
- 5.03%
- DSCR
- 1.22
- GRM
- 8.6
CMA / ARV
- ARV (median comp)
- $284,378
- List price
- $199,900
- Delta
- -29.71%
- Verdict
- UNDERPRICED
- Comps
- 20 within 1.0 mi
Show comp detail 12 sales within ~0.75 mi
| Address | Dist | Beds/Ba | Sqft | Sold | Price | $/sf | Match |
|---|---|---|---|---|---|---|---|
| 113 Hillview Dr | 0.00mi | 4/1.5 | 1,741 (-11%) | 1mo | $199,000 | $114 | 81 |
| 110 Hillview Dr | 0.03mi | 3/1.5 (-1) | 1,990 (+1%) | 16mo | $244,000 | $123 | 78 |
| 7152 Meadowbrook Dr Rd | 0.21mi | 4/2.0 | 1,924 (-2%) | 10mo | $290,000 | $151 | 77 |
| 7135 Suncrest Dr | 0.27mi | 3/2.5 (-1) | 1,983 (+1%) | 1mo | $298,850 | $151 | 76 |
| 7131 Meadowbrook Rd | 0.32mi | 4/1.5 | 1,826 (-7%) | 4mo | $274,000 | $150 | 70 |
| 106 Hillview Dr | 0.07mi | 3/1.5 (-1) | 1,778 (-9%) | 12mo | $300,000 | $169 | 66 |
| 407 Old Graves Mill Rd | 0.52mi | 4/1.5 | 1,825 (-7%) | 10mo | $280,000 | $153 | 55 |
| 7133 Suncrest Dr | 0.30mi | 5/2.0 (+1) | 1,726 (-12%) | 5mo | $311,885 | $181 | 55 |
| 313 Robin Dr | 0.63mi | 3/2.0 (-1) | 1,973 (+1%) | 10mo | $272,000 | $138 | 54 |
| 329 Smoketree Ln | 0.37mi | 3/2.5 (-1) | 2,098 (+7%) | 11mo | $356,400 | $170 | 53 |
| 109 Pearson Dr | 0.57mi | 3/2.0 (-1) | 2,132 (+9%) | 10mo | $272,500 | $128 | 43 |
| 348 Smoketree Ln | 0.55mi | 3/2.5 (-1) | 2,166 (+10%) | 14mo | $349,900 | $162 | 36 |
Match score weights: distance 35% · size 25% · config 20% · recency 20%. Top-matched comps best support the ARV.
Projected returns pro-forma
-3.0% appreciation · 5.11% rent growth · sell at horizon
- IRR
- -6.3%
- Equity multiple
- 0.76×
- Total profit
- $-13,288
- Equity at exit
- $29,806
- IRR
- 5.6%
- Equity multiple
- 1.46×
- Total profit
- $25,494
- Equity at exit
- $17,284
Cash invested: $55,972 (down + closing). Projections, not guarantees.
Landlord ↔ Tenant lean methodology
- Overall (STATE)
- 55 Moderately Landlord-Leaning
- State Virginia
- 55 Moderately Landlord-Leaning · D+2
- County
- — inherits STATE
- City
- — inherits STATE
ZIP-level market 24502
- Rents YoY
- 5.1%
- Active inventory
- 324
- Price-to-rent
- 8.6×
Monthly cashflow live
- Estimated rent
- $1,930 high interval (Pro) →
- Mortgage (P&I)
- −$1,048
- Tax from tax record
- −$159 /mo · $1,904/yr
- Insurance
- −$83
- HOA
- −$0
- Vacancy / Maint / Mgmt
- −$405
- Net cashflow
- $235
Break-even live
Sensitivity live
| Price | -10% $348 | -5% $291 | +0% $235 | +5% $178 | +10% $122 |
|---|---|---|---|---|---|
| Rent | -10% $82 | -5% $158 | +0% $235 | +5% $311 | +10% $387 |
| Rate | -1.0pp $335 | -0.5pp $286 | base $235 | +0.5pp $183 | +1.0pp $130 |
UW: 25.0% down · 7.5% · 30yr · 1.5% tax · 5.0% vac · 8.0% maint · 8.0% mgmt
Financing live
Cash to close
- Down payment
- $49,975
- Closing costs
- $5,997
- Reserves months
- —
- Total cash needed
- —
Loan-product check · same deal, 3 products live
Conventional
25% down · 7.5% · 30yr
- Down + closing
- —
- Monthly P&I
- —
- Monthly cashflow
- —
- DSCR
- —
- Eligible?
- —
Personal DTI + credit; lowest rate.
DSCR
20% down · 8.5% · 30yr
- Down + closing
- —
- Monthly P&I
- —
- Monthly cashflow
- —
- DSCR
- —
- Eligible?
- —
No personal income docs; deal must DSCR.
Hard money
10% down · 12.0% · 12mo
- Down + closing
- —
- Monthly P&I
- —
- Monthly cashflow
- —
- DSCR
- —
- Eligible?
- —
Short-term bridge; refi at stabilization.
Rent comps 13 comps
| Address | Beds | Baths | Sqft | Rent | $/sqft | DOM | Units | Dist |
|---|---|---|---|---|---|---|---|---|
| 501 Bent Oak Ct Lynchburg, VA | 3.0 | 2.0 | 1250 | $1,900 | $1.52 | 45d | 1 | 0.39mi |
| 7222 Richland Dr Lynchburg, VA | 4.0 | 2.0 | 2164 | $1,950 | $0.90 | 45d | 1 | 0.43mi |
| 209 Old Graves Mill Rd Lynchburg, VA | 2.0–3.0 | 2.0 | 1313 | $1,430 | $1.09 | 14d | 7 | 0.70mi |
| 240 Beverly Hills Cir Lynchburg, VA | 2.0–3.0 | 2.0–2.5 | 1402 | $1,756 | $1.25 | 22d | 10 | 0.74mi |
| 106 Morning Glory Ct Lynchburg, VA | 3.0 | 2.0 | 1424 | $1,645 | $1.16 | 45d | 1 | 0.90mi |
| 518 Northwynd Cir Lynchburg, VA | 3.0 | 2.5 | 2224 | $1,900 | $0.85 | 45d | 1 | 0.90mi |
| 639 Wyndhurst Dr Unit 639 Lynchburg, VA | 3.0 | 3.0 | 1940 | $700 | $0.36 | 14d | 1 | 0.94mi |
| 1114 Rosedale Blvd Lynchburg, VA | 3.0 | 2.0 | 1502 | $1,745 | $1.16 | 45d | 1 | 0.94mi |
| 556 Leesville Rd #306 Lynchburg, VA | 3.0 | 3.0 | 1520 | $2,100 | $1.38 | 45d | 1 | 1.07mi |
| 556 Leesville Rd Lynchburg, VA | 3.0 | 2.5 | 1600 | $1,695 | $1.06 | 14d | 1 | 1.07mi |
| 110 Aaron Pl #605 Lynchburg, VA | 3.0 | 2.0 | 1517 | $1,795 | $1.18 | 14d | 1 | 1.23mi |
| 110 Aaron Pl #611 Lynchburg, VA | 3.0 | 2.5 | 1490 | $1,925 | $1.29 | 22d | 1 | 1.23mi |
| 304 Hunterdale Dr Lynchburg, VA | 3.0 | 2.5 | 2100 | $2,400 | $1.14 | 14d | 1 | 1.44mi |
Listing history 6 events
-
2026-05-01$199,900 Active 995-char remark
-
2026-03-18soldstatus $141,875
-
2021-01-29soldstatus $175,000
-
2015-06-12soldstatus $432,100
-
2011-11-30soldstatus $62,502
-
1980-11-24soldstatus $49,900
ⓘ Source: listings_history table (triggers on properties + properties_extension) + one-shot
backfill from property_details.listing_events for pre-trigger history.
Tax reassessment forecast VA · Resets to sale price
- Current annual tax
- $1,904 · $159/mo
- Projected year-2 tax
- $1,904 · $159/mo
- Expected delta
- $0/yr ($0/mo · -0.0%)
ⓘ Screening estimate from a state-policy table — verify with the county assessor before closing.
Climate risk First Street
- Flood 1/10 Low FEMA zone X (unshaded) · 0% chance over 30 yrs
- Wildfire 3/10 Moderate
- Heat 5/10 Major 7 d/yr ≥101°F today · 18 d/yr by 30 yrs out
- Wind 2/10 Low 3% chance of damaging wind over 30 yrs
- Air quality 2/10 Low 0 unhealthy d/yr today · 1 by 30 yrs out
Nearby sold comps map
Loading sold comps map…
Walkable amenities ~0.75 mi
Loading nearby amenities…
Taxation est. · year 1
- Rental income
- $23,164
- − Mortgage interest
- −$11,198
- − Property taxes
- −$1,904
- − Insurance
- −$1,000
- − Repairs & maintenance
- −$1,853
- − Management
- −$1,853
- − Depreciation
- −$5,815
- Taxable loss
- −$459
- Est. tax savings @ 24.0%
- +$110
- After-tax cash flow
- $2,926/yr
For passive investors: Depreciation is non-cash, so a rental often shows a tax loss while cash-flowing — sheltering income. Rental losses are passive: they offset passive income freely, and up to $25,000/yr can offset ordinary (W-2) income if you actively participate and your MAGI is under $100k (phasing out to $0 by $150k); unused losses carry forward. On sale, claimed depreciation is recaptured at up to 25%, and gains may owe capital-gains tax (a 1031 exchange can defer both). Figures are a year-1 estimate at your 24.0% rate — not tax advice; consult a CPA.
Schools (NCES district)
- District
- Lynchburg City Public School District
- NCES district ID
- 5102340
- Math proficiency
- 36% ▼ -38.00%
- Reading proficiency
- 61% ▼ -8.00%
- Median HH income
- $39,097
- Composite
- 40.4/100
- National rank
- #3730
- State rank
- #104 of 131 in VA
Livability — Lynchburg
- Score
- 91/100
- State rank
- #1
- US rank
- #58
Category grades
Schools grade is shown separately in the Schools card above.
Census & demographics
- Census place
- Lynchburg, VA
- County
- Lynchburg City · 97,036 people
- City population
- 97,036
- Metro
- Lynchburg, VA
- Population (ZIP)
- 41,979
- Household income
- $68,872
- Rent vs Own
- Severe rent burden
- 1774.0
Population outlook (Lynchburg County) Hauer SSP2
- Today (2025)
- 87,977 people
- By 2030
- 93,626 · +6.4%
- By 2040
- 106,145 · +20.7%
- By 2050
- 120,783 · +37.3%
- By 2075
- 162,249 · +84.4%
- By 2100
- 191,358 · +117.5%
Race, ethnicity, and origin ACS 2023
- Neighborhood character
- Predominantly White (68%)
- Race & ethnicity
- White 68% Black 19% Two or more races 6% Hispanic / Latino 6% Asian 2%
- Hispanic origin (detail)
- Mexican 2%
- Common ancestry
- Slovak 3% Italian 2% Lithuanian 2%
- Foreign-born
- 6% · Canada, South Korea, United Kingdom
- Languages at home
- 91% English-only · Spanish 4% Other Indo-European 1% Other Asian/Pacific 1%
Political lean MEDSL · Lynchburg
- 2024 margin
- Lean R (+7.9) · D 45.4% · R 53.3% · Other 1.3%
- 2008→2024 swing
- -3.9pp toward R · 2008: -4.0pp · 2024: -7.9pp
- All cycles
- 2024: R+7.9 2020: D+2.6 2016: R+9.0 2012: R+10.6 2008: R+4.0
Not yet ingested
- Civics
- —
Market trends
- HPI YoY
- ▼ -222.79%
- Current HPI
- 241.9041
- Rent YoY
- ▲ 5.11%
- Metro
- Lynchburg, VA
- State GDP YoY
- ▲ 2.40%
- F500 in state
- 50
Industry mix (Fortune 500 HQ in VA)
| Industry | F500 HQs | Revenue |
|---|---|---|
| Aerospace / Defense | 4 | $236B |
|
||
| Technology / Defense | 3 | $32B |
|
||
| Financial Services | 2 | $176B |
|
||
| Utilities | 2 | $27B |
|
||
| Insurance | 2 | $25B |
|
||
| Technology | 2 | $15B |
|
||
Price history
+298.8% since first listed9 events — show timeline
- 2026-06-05 Sold (MLS) $199,000 LMLS
- 2026-05-20 Pending — LMLS
- 2026-05-04 Sold (Public Records) $160,000 Public Records
- 2026-05-01 Listed $199,900 LMLS
- 2026-03-18 Sold (Public Records) $141,875 Public Records
- 2021-01-29 Sold (Public Records) $175,000 Public Records
- 2015-06-12 Sold (Public Records) $432,100 Public Records
- 2011-11-30 Sold (Public Records) $62,502 Public Records
- 1980-11-24 Sold (Public Records) $49,900 Public Records
Property tax history
+1.6%/yrLatest (2025): $1,904 · +6.3% YoY. Source: county tax records.
Cash-flow waterfall
monthlySold comps — $/sqft
last 12 mo · ≤1 miLoading sold comps…