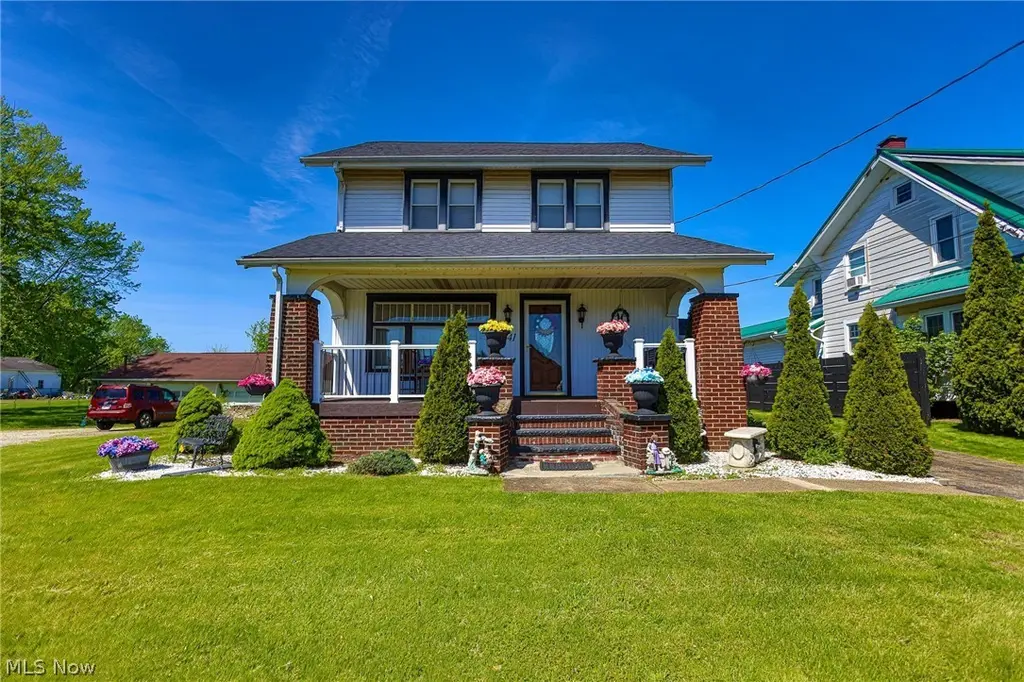
5541 Ravenna Ave · Louisville, OH
Flood risk 1/10 · Minimal
- FEMA flood zone
- X (unshaded)
- Chance of flooding over 30 yrs
- 0.0%
- Est. flood insurance / yr
- $473 – $860
Fire risk 1/10 · Minimal
- Est. fire insurance / yr
- $713 – $1,323
Heat risk 3/10 · Minor
- Hot days now (above 96°F)
- 7 days/yr
- Hot days in 30 yrs
- 17 days/yr
Wind risk 1/10 · Minimal
- Chance of severe wind over 30 yrs
- 0.0%
Air-quality risk 2/10 · Minimal
- Unhealthy air days now
- 1 days/yr
- Unhealthy air days in 30 yrs
- 2 days/yr
Risk factors via First Street. Map © Google.
Why this score? — see what drove the D grade
The composite is a weighted blend of 9 inputs, each scored 0–100. Each bar is that input's sub-score; the figure is the points it added to the 100-point composite (weight × sub-score).
- ARV discount +15.0/15.0
- Cash flow +8.0/30.0
- Schools +5.9/10.0
- Livability +4.0/5.0
- Rent growth +3.9/5.0
- Condition / age +2.5/5.0
- DSCR +2.0/10.0
- 1% rule +1.6/10.0
- Appreciation +0.0/10.0
$259,900
🖨 Deal sheet 📄 Offer letter ✓ Due diligence
Listing remarks
Your Forever Home Awaits: Space, Style, and the Ultimate Garage! Prepare to be impressed by this stunning 4-bedroom home that perfectly blends "good bones" with modern peace of mind. Located in a highly-rated school district with convenient, easy access to Route 62, this home offers the perfect balance of neighborhood charm and commuter convenience. The standout feature is undoubtedly the massive 2-car detached garage. More than just a place to park, this hobbyist's paradise includes: A dedicated workshop area for your projects. A spacious loft for additional storage or creative space. Every amenity a garage enthusiast could dream of! Outdoor Living & Major Updates -Rest ea
Key facts
- New patio
- Workshop area
- Private fireplace
Tags
Property features AI
Exterior
- Parking: Detached 2-car garage; Asphalt driveway; Garage with door opener
- Utilities: Septic tank; Well water
- Home design: Two-story house; Faces east
- Construction: Vinyl siding; Asphalt roof; Built (year per public records)
- Exterior features: Deck; Front porch; Patio; 60 x 180 lot dimensions
Interior
- Kitchen: Eat-in kitchen; Kitchen with range, refrigerator, microwave, dishwasher, and freezer
- Bedrooms: Second-floor bedrooms (multiple); Bedroom with fireplace
- Bathrooms: Two full bathrooms; Two half bathrooms; One main-level bathroom
- Heating & cooling: Gas forced-air heating; Central air conditioning
- Interior features: Ceiling fans; Eat-in kitchen; His and hers closets; Multiple closets; Storage space
- Laundry & utility: Washer and dryer; Water softener
Neighborhood map
What this means for you Summary
Snapshot
- This is a 4-bed/2.0-bath single-family listed at $260k.
Deal economics
- At list price, monthly cash flow is $-269 ($-3k/yr) — negative.
- To cash-flow at today's rent, offer at most $212k (18.3% below list).
- To meet the 1% rule (rent ≥ 1% of price), the offer needs to be $171k (34.1% below list).
- Recommended offer: $171k (34.1% below list) — sets the bar for 1% rule.
- Cap rate 5.1% vs local median 3.4% in Louisville — top-decile yield for the area; either an underpriced asset or a hidden risk that comps aren't pricing in. Stress-test before assuming the spread holds.
Location & tenants
- Location reads 79/100 on livability (#142 in OH, #2,205 nationally) — a middle-class / working-renter tenant base. Strengths: crime A+, cost of living A+, housing A+; Watch: amenities F, commute F.
- Louisville City (suburban): math 67% / reading 70% proficiency, ranked #162 of 656 in OH (top 25%) — acceptable for families but not a draw, mixed tenant base, ~2y average lease.
- Market conditions: Rents rising fast (+5.6%/yr); 88 active listings in the ZIP; solid renter incomes; 528 units permitted in Stark County in 2024 (84 in 5+ unit buildings).
Forward outlook
- Local home prices are declining (-3.0%/yr); year-one equity from $2k of loan paydown is wiped out by about $8k of value loss. Plan a longer hold.
- Stark County population projected to shrink 8% by 2050 — rents likely to lag national; underwrite the cash flow, not the appreciation.
Negotiation context
- It's been on market 19 days — a 2% lower offer ($256k) is reasonable based on typical stale-listing flexibility.
Risks & watch-outs
- Watch-outs: built in 1925 — expect roof / HVAC / electrical / plumbing capex.
Questions for the listing agent
- What do current leases actually rent for vs. the listed asking? Can we see a recent rent roll and the last 12 months of T-12 income?
- Built in 1925 — when were the roof, HVAC, electrical panel, plumbing, and water heater last replaced?
- Is there a deadline driving the sale (1031 exchange, divorce, estate, relocation)? That informs how much negotiation room exists.
- Schools are A-rated — typically a magnet for longer-tenancy family renters. What's the average tenant stay here, and is there a school-zone premium baked into asking?
- The area grade is low — what's the realistic commute time and amenity access for the typical tenant pool here? Any planned neighborhood developments (good or bad) we should know about?
- What's the average days-on-market for RENTAL listings here right now (not sales)? A rising rental-DOM trend means longer vacancies and softer asking-rent achievability than the comps imply.
- What's the recent tenant-quality profile in this submarket — average credit score on applications, eviction rate, late-payment / NSF rate, and stable-employment percentage? A property-management company in the area should have these aggregated.
- How much new for-sale + rental construction is in the pipeline within 1–3 miles? Heavy new supply typically softens prices + rents 12–24 months out; constrained supply supports both.
Investment metrics
- 1% rule
- 0.66% ✗
- Cap rate
- 5.05%
- Cash-on-cash
- -4.44%
- DSCR
- 0.80
- GRM
- 12.6
CMA / ARV
- ARV (median comp)
- $328,617
- List price
- $259,900
- Delta
- -20.91%
- Verdict
- UNDERPRICED
- Comps
- 20 within 1.0 mi
Show comp detail 5 sales within ~0.75 mi
| Address | Dist | Beds/Ba | Sqft | Sold | Price | $/sf | Match |
|---|---|---|---|---|---|---|---|
| 910 Crosswyck Cir | 0.52mi | 4/3.5 | 2,153 (-4%) | 7mo | $399,900 | $186 | 58 |
| 7425 Brookside St | 0.17mi | 3/3.0 (-1) | 2,089 (-6%) | 20mo | $321,000 | $154 | 56 |
| 1461 Brookridge Ave | 0.46mi | 3/2.5 (-1) | 1,912 (-14%) | 2mo | $235,000 | $123 | 46 |
| 1170 Winding Ridge Ave | 0.61mi | 3/2.5 (-1) | 1,918 (-14%) | 5mo | $293,000 | $153 | 37 |
| 1276 Cheverton Ave NE | 0.62mi | 3/2.5 (-1) | 2,124 (-5%) | 24mo | $331,000 | $156 | 37 |
Match score weights: distance 35% · size 25% · config 20% · recency 20%. Top-matched comps best support the ARV.
Projected returns pro-forma
-3.0% appreciation · 5.57% rent growth · sell at horizon
- IRR
- -21.3%
- Equity multiple
- 0.25×
- Total profit
- $-54,794
- Equity at exit
- $38,752
- IRR
- -10.4%
- Equity multiple
- 0.31×
- Total profit
- $-50,457
- Equity at exit
- $22,471
Cash invested: $72,772 (down + closing). Projections, not guarantees.
Landlord ↔ Tenant lean methodology
- Overall (STATE)
- 73 Landlord-Friendly
- State Ohio
- 73 Landlord-Friendly · R+6
- County
- — inherits STATE
- City
- — inherits STATE
ZIP-level market 44641
- Rents YoY
- 5.6%
- Active inventory
- 88
- Price-to-rent
- 12.6×
Monthly cashflow live
- Estimated rent
- $1,714 medium interval (Pro) →
- Mortgage (P&I)
- −$1,363
- Tax from tax record
- −$152 /mo · $1,821/yr
- Insurance
- −$108
- HOA
- −$0
- Vacancy / Maint / Mgmt
- −$360
- Net cashflow
- $-269
Break-even live
UW: 25.0% down · 7.5% · 30yr · 1.5% tax · 5.0% vac · 8.0% maint · 8.0% mgmt
Financing live
Cash to close
- Down payment
- $64,975
- Closing costs
- $7,797
- Reserves months
- —
- Total cash needed
- —
Loan-product check · same deal, 3 products live
Conventional
25% down · 7.5% · 30yr
- Down + closing
- —
- Monthly P&I
- —
- Monthly cashflow
- —
- DSCR
- —
- Eligible?
- —
Personal DTI + credit; lowest rate.
DSCR
20% down · 8.5% · 30yr
- Down + closing
- —
- Monthly P&I
- —
- Monthly cashflow
- —
- DSCR
- —
- Eligible?
- —
No personal income docs; deal must DSCR.
Hard money
10% down · 12.0% · 12mo
- Down + closing
- —
- Monthly P&I
- —
- Monthly cashflow
- —
- DSCR
- —
- Eligible?
- —
Short-term bridge; refi at stabilization.
Listing history 1 events
-
2026-05-07$259,900 Active 1598-char remark
ⓘ Source: listings_history table (triggers on properties + properties_extension) + one-shot
backfill from property_details.listing_events for pre-trigger history.
Tax reassessment forecast OH · Partial reset (capped growth)
- Current annual tax
- $1,821 · $152/mo
- Projected year-2 tax
- $2,938 · $245/mo
- Expected delta
- +$1,117/yr (+$93/mo · 61.3%)
ⓘ Screening estimate from a state-policy table — verify with the county assessor before closing.
Climate risk First Street
- Flood 1/10 Low FEMA zone X (unshaded) · 0% chance over 30 yrs
- Wildfire 1/10 Low
- Heat 3/10 Moderate 7 d/yr ≥96°F today · 17 d/yr by 30 yrs out
- Wind 1/10 Low 0% chance of damaging wind over 30 yrs
- Air quality 2/10 Low 1 unhealthy d/yr today · 2 by 30 yrs out
Nearby sold comps map
Loading sold comps map…
Walkable amenities ~0.75 mi
Loading nearby amenities…
Taxation est. · year 1
- Rental income
- $20,564
- − Mortgage interest
- −$14,558
- − Property taxes
- −$1,821
- − Insurance
- −$1,300
- − Repairs & maintenance
- −$1,645
- − Management
- −$1,645
- − Depreciation
- −$7,561
- Taxable loss
- −$7,966
- Est. tax savings @ 24.0%
- +$1,912
- After-tax cash flow
- $-1,318/yr
For passive investors: Depreciation is non-cash, so a rental often shows a tax loss while cash-flowing — sheltering income. Rental losses are passive: they offset passive income freely, and up to $25,000/yr can offset ordinary (W-2) income if you actively participate and your MAGI is under $100k (phasing out to $0 by $150k); unused losses carry forward. On sale, claimed depreciation is recaptured at up to 25%, and gains may owe capital-gains tax (a 1031 exchange can defer both). Figures are a year-1 estimate at your 24.0% rate — not tax advice; consult a CPA.
Schools (NCES district)
- District
- Louisville City
- NCES district ID
- 3904987
- Math proficiency
- 67% ▼ -11.00%
- Reading proficiency
- 70% ▼ -4.00%
- Median HH income
- $54,455
- Composite
- 58.54/100
- National rank
- #992
- State rank
- #162 of 656 in OH
Livability — Louisville
- Score
- 79/100
- State rank
- #142
- US rank
- #2205
Category grades
Schools grade is shown separately in the Schools card above.
Census & demographics
- County
- Stark County · 272,865 people
- City population
- 20,031
- Metro
- Canton-Massillon, OH
- Population (ZIP)
- 20,031
- Household income
- $80,303
- Rent vs Own
- Severe rent burden
- 344.0
Population outlook (Stark County) Hauer SSP2
- Today (2025)
- 373,708 people
- By 2030
- 371,245 · -0.7%
- By 2040
- 361,331 · -3.3%
- By 2050
- 345,290 · -7.6%
- By 2075
- 302,669 · -19.0%
- By 2100
- 238,870 · -36.1%
Race, ethnicity, and origin ACS 2023
- Neighborhood character
- Predominantly White (95%)
- Race & ethnicity
- White 95% Two or more races 2% Hispanic / Latino 1% Black 1%
- Common ancestry
- Italian 6% Lithuanian 5% Romanian 2%
- Foreign-born
- 1% · Canada
- Languages at home
- 98% English-only · German/W. Germanic 1%
Political lean MEDSL · Stark
- 2024 margin
- Strong R (+21.9) · D 38.6% · R 60.5%
- 2008→2024 swing
- -27.4pp toward R · 2008: 5.5pp · 2024: -21.9pp
- All cycles
- 2024: R+21.9 2020: R+18.5 2016: R+17.4 2012: R+0.4 2008: D+5.5
Not yet ingested
- Civics
- —
Market trends
- HPI YoY
- ▼ -203.38%
- Current HPI
- 214.6849
- Rent YoY
- ▲ 5.57%
- Metro
- Canton-Massillon, OH
- State GDP YoY
- ▲ 1.98%
- F500 in state
- 48
Industry mix (Fortune 500 HQ in OH)
| Industry | F500 HQs | Revenue |
|---|---|---|
| Insurance | 3 | $145B |
|
||
| Industrial Machinery | 3 | $49B |
|
||
| Financial Services | 3 | $24B |
|
||
| Consumer Goods | 2 | $93B |
|
||
| Aerospace / Defense | 2 | $47B |
|
||
| Utilities | 2 | $33B |
|
||
Price history
2 events — show timeline
- 2026-05-26 Listing Removed — MLSNOW
- 2026-05-07 Listed $259,900 MLSNOW
Property tax history
+5.2%/yrLatest (2024): $1,821 · +22.9% YoY. Source: county tax records.
Cash-flow waterfall
monthlySold comps — $/sqft
last 12 mo · ≤1 miLoading sold comps…