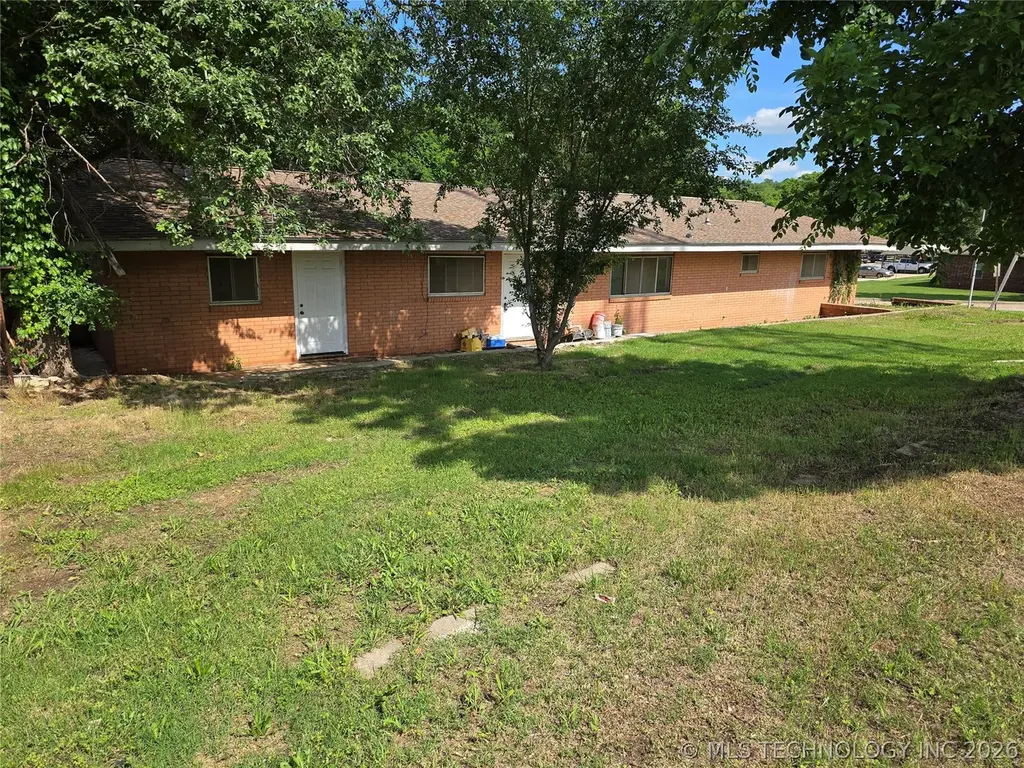
502 Granite St · Pawnee, OK
Flood risk 1/10 · Minimal
- FEMA flood zone
- X
- Chance of flooding over 30 yrs
- 0.0%
- Est. flood insurance / yr
- $507 – $1,088
Fire risk 8/10 · Major
- Est. fire insurance / yr
- $2,463 – $4,575
Heat risk 6/10 · Moderate
- Hot days now (above 109°F)
- 7 days/yr
- Hot days in 30 yrs
- 19 days/yr
Wind risk 2/10 · Minimal
- Chance of severe wind over 30 yrs
- 2.0%
Air-quality risk 2/10 · Minimal
- Unhealthy air days now
- 2 days/yr
- Unhealthy air days in 30 yrs
- 2 days/yr
Risk factors via First Street. Map © Google.
Why this score? — see what drove the B- grade
The composite is a weighted blend of 9 inputs, each scored 0–100. Each bar is that input's sub-score; the figure is the points it added to the 100-point composite (weight × sub-score).
- Cash flow +30.0/30.0
- DSCR +10.0/10.0
- 1% rule +9.9/10.0
- Appreciation +5.0/10.0
- Livability +3.3/5.0
- ARV discount +3.1/15.0
- Rent growth +2.5/5.0
- Condition / age +2.5/5.0
- Schools +1.7/10.0
$85,000
🖨 Deal sheet (PDF) 📄 Offer letter ✓ Due diligence
Listing remarks
2500 SF mol with Detached 2 car garage. Room lots of room. Possibly could be converted into a duplex. This home sits on 1 full and part of 2 other lots. If you are ready for a project with a big up-side check this out. 1/2 block from downtown Pawnee and the County courthouse.
Key facts
- 0.26 acre lot
- 2 garage spots
- Built 1959
Tags
Property features AI
Finance
- HOA & community: Sidewalks in the community
Exterior
- Parking: Detached garage with storage; 2-car garage
- Security: Interior safe room
- Utilities: Electricity available; Natural gas available; Public water; Public sewer; Phone available
- Home design: Single-story; Brick and wood-frame construction; Slab foundation
- Construction: Built (year per public records); Asphalt/fiberglass roof
- Exterior features: Covered patio and porch; Porch; Dog run; Partial fencing; Corner lot; Faces east; Safe room (interior)
Interior
- Kitchen: Oven
- Flooring: Tile
- Bathrooms: 3 full bathrooms
- Heating & cooling: Central heating (gas); Central air conditioning
- Interior features: Aluminum window frames; Laminate countertops; Tile flooring; Wood-burning fireplace
- Laundry & utility: Washer hookup; Electric dryer hookup; Gas dryer hookup; Electric water heater
Neighborhood map
What this means for you Summary
Snapshot
- This is a 3-bed/3.0-bath single-family listed at $85k.
Deal economics
- At list price, monthly cash flow is $433 ($5k/yr) — positive.
- The deal already cash-flows at list — no discount required.
- Meets the 1% rule at list price ($1k rent vs $85k).
- Recommended offer: $84k (1.5% below list) — sets the bar for market timing.
Location & tenants
- Location reads 66/100 on livability (#116 in OK) — a middle-class / working-renter tenant base. Strengths: cost of living A+, housing A+, health & safety A+; Watch: amenities F, commute F, employment F.
- Pawnee (rural): math 16% / reading 23% proficiency, ranked #176 of 270 in OK (top 65%) — low school quality limits family demand, transient renter base, plan for 1-2y turnover; 68% free/reduced lunch — lower-income household profile, screen leases tightly.
- Zoned schools: Pawnee Es (math 22% / reading 22%, grade F, #413 of 845 statewide, top 54%, 309 students, 0% FRL); Pawnee Ms (math 8% / reading 22%, grade F, #226 of 345 statewide, top 67%, 143 students, 0% FRL); Pawnee Hs (math 24% / reading 34%, grade F, #96 of 447 statewide, top 26%, 181 students, 0% FRL) — zoned schools average 0% FRL vs 68% district-wide (68 pts lower); this property's tenant base skews higher-income than the district average.
- Market conditions: 43 active listings in the ZIP; 3 units permitted in Pawnee County in 2024 (0 in 5+ unit buildings).
Forward outlook
- In year one you build about $3k of equity ($588 loan paydown + $3k appreciation (3.0% local appreciation)).
- Pawnee County population projected to shrink 4% by 2050 — rents likely to lag national; underwrite the cash flow, not the appreciation.
- At projected returns (3.0% appreciation + 3.0% rent growth), your $24k cash investment doubles in ~3 years — after that, you're playing with house money.
- By year 10, paydown + projected appreciation supports a ~$30k cash-out refi (75% LTV) — recoverable capital for the next deal without selling this one.
Negotiation context
- It's been on market 20 days — a 2% lower offer ($84k) is reasonable based on typical stale-listing flexibility.
Risks & watch-outs
- Watch-outs: built in 1959 — expect roof / HVAC / electrical / plumbing capex.
- Climate carrying-cost: severe wildfire risk; extreme-heat days projected 7→19/yr by 2055 (HVAC capex compounding) — expect insurance premiums to compound above CPI over the hold.
Questions for the listing agent
- Built in 1959 — when were the roof, HVAC, electrical panel, plumbing, and water heater last replaced?
- Is there a deadline driving the sale (1031 exchange, divorce, estate, relocation)? That informs how much negotiation room exists.
- Schools are F-rated, which usually means shorter tenancies and higher turnover. Who's the typical renter profile here, and what's been the actual vacancy rate?
- What's the average days-on-market for RENTAL listings here right now (not sales)? A rising rental-DOM trend means longer vacancies and softer asking-rent achievability than the comps imply.
- What's the recent tenant-quality profile in this submarket — average credit score on applications, eviction rate, late-payment / NSF rate, and stable-employment percentage? A property-management company in the area should have these aggregated.
- How much new for-sale + rental construction is in the pipeline within 1–3 miles? Heavy new supply typically softens prices + rents 12–24 months out; constrained supply supports both.
Investment metrics
- 1% rule
- 1.49% ✓
- Cap rate
- 12.40%
- Cash-on-cash
- 21.83%
- DSCR
- 1.97
- GRM
- 5.6
CMA / ARV
- ARV (on-the-fly)
- $77,376
- Comps found
- 1
Show comp detail 1 sale within ~0.75 mi
| Address | Dist | Beds/Ba | Sqft | Sold | Price | $/sf | Match |
|---|---|---|---|---|---|---|---|
| 408 Cleveland St | 0.33mi | 4/2.0 (+1) | 2,552 (+2%) | 2mo | $80,000 | $31 | 70 |
Match score weights: distance 35% · size 25% · config 20% · recency 20%. Top-matched comps best support the ARV.
Projected returns pro-forma
3.0% appreciation · 3.0% rent growth · sell at horizon
- IRR
- 28.1%
- Equity multiple
- 2.59×
- Total profit
- $37,816
- Equity at exit
- $38,220
- IRR
- 28.6%
- Equity multiple
- 5.03×
- Total profit
- $96,006
- Equity at exit
- $58,901
Cash invested: $23,800 (down + closing). Projections, not guarantees.
Landlord ↔ Tenant lean methodology
- Overall (STATE)
- 83 Strongly Landlord-Friendly
- State Oklahoma
- 83 Strongly Landlord-Friendly · R+20
- County
- — inherits STATE
- City
- — inherits STATE
ZIP-level market 74058
- Active inventory
- 43
- Price-to-rent
- 5.6×
Monthly cashflow live
- Estimated rent
- $1,265 medium interval (Pro) →
- Mortgage (P&I)
- −$446
- Tax from tax record
- −$86 /mo · $1,028/yr
- Insurance
- −$35
- HOA
- −$0
- Vacancy / Maint / Mgmt
- −$266
- Net cashflow
- $433
Break-even live
Sensitivity live
| Price | -10% $481 | -5% $457 | +0% $433 | +5% $409 | +10% $385 |
|---|---|---|---|---|---|
| Rent | -10% $333 | -5% $383 | +0% $433 | +5% $483 | +10% $533 |
| Rate | -1.0pp $476 | -0.5pp $454 | base $433 | +0.5pp $411 | +1.0pp $388 |
UW: 25.0% down · 7.5% · 30yr · 1.5% tax · 5.0% vac · 8.0% maint · 8.0% mgmt
Financing live
Cash to close
- Down payment
- $21,250
- Closing costs
- $2,550
- Reserves months
- —
- Total cash needed
- —
Loan-product check · same deal, 3 products live
Conventional
25% down · 7.5% · 30yr
- Down + closing
- —
- Monthly P&I
- —
- Monthly cashflow
- —
- DSCR
- —
- Eligible?
- —
Personal DTI + credit; lowest rate.
DSCR
20% down · 8.5% · 30yr
- Down + closing
- —
- Monthly P&I
- —
- Monthly cashflow
- —
- DSCR
- —
- Eligible?
- —
No personal income docs; deal must DSCR.
Hard money
10% down · 12.0% · 12mo
- Down + closing
- —
- Monthly P&I
- —
- Monthly cashflow
- —
- DSCR
- —
- Eligible?
- —
Short-term bridge; refi at stabilization.
Listing history 22 events
-
2026-06-21days on market $85,000 Active 20 DOM
-
2026-06-21days on market $85,000 Active 19 DOM
-
2026-06-18days on market $85,000 Active 17 DOM
-
2026-06-17days on market $85,000 Active 16 DOM
-
2026-06-16days on market $85,000 Active 15 DOM
-
2026-06-15days on market $85,000 Active 14 DOM
-
2026-06-13days on market $85,000 Active 12 DOM
-
2026-06-12days on market $85,000 Active 11 DOM
-
2026-06-09days on market $85,000 Active 8 DOM
-
2026-06-08days on market $85,000 Active 7 DOM
-
2026-06-08days on market $85,000 Active 6 DOM
-
2026-06-05days on market $85,000 Active 4 DOM
-
2026-06-04days on market $85,000 Active 2 DOM
-
2026-06-01remarks 308-char remark
-
2026-06-01days on market $85,000 Active 1 DOM
-
2026-03-13price $85,000
-
2026-01-17price $90,000
-
2026-01-13price $95,000
-
2025-11-28price $99,000
-
2025-08-24price $105,000
-
2025-07-16price $110,000
-
2025-06-01$120,000 Active
ⓘ Source: listings_history table (triggers on properties + properties_extension) + one-shot
backfill from property_details.listing_events for pre-trigger history.
Tax reassessment forecast OK · Resets to sale price
- Current annual tax
- $1,028 · $86/mo
- Projected year-2 tax
- $1,028 · $86/mo
- Expected delta
- $0/yr ($0/mo · 0.0%)
ⓘ Screening estimate from a state-policy table — verify with the county assessor before closing.
Climate risk First Street
- Flood 1/10 Low FEMA zone X · 0% chance over 30 yrs
- Wildfire 8/10 Severe
- Heat 6/10 Major 7 d/yr ≥109°F today · 19 d/yr by 30 yrs out
- Wind 2/10 Low 2% chance of damaging wind over 30 yrs
- Air quality 2/10 Low 2 unhealthy d/yr today · 2 by 30 yrs out
Nearby sold comps map
Loading sold comps map…
Walkable amenities ~0.75 mi
Loading nearby amenities…
Taxation est. · year 1
- Rental income
- $15,186
- − Mortgage interest
- −$4,761
- − Property taxes
- −$1,028
- − Insurance
- −$425
- − Repairs & maintenance
- −$1,215
- − Management
- −$1,215
- − Depreciation
- −$2,473
- Taxable income
- $4,069
- Est. tax owed @ 24.0%
- −$977
- After-tax cash flow
- $4,218/yr
For passive investors: Depreciation is non-cash, so a rental often shows a tax loss while cash-flowing — sheltering income. Rental losses are passive: they offset passive income freely, and up to $25,000/yr can offset ordinary (W-2) income if you actively participate and your MAGI is under $100k (phasing out to $0 by $150k); unused losses carry forward. On sale, claimed depreciation is recaptured at up to 25%, and gains may owe capital-gains tax (a 1031 exchange can defer both). Figures are a year-1 estimate at your 24.0% rate — not tax advice; consult a CPA.
Schools (NCES district)
- District
- Pawnee
- NCES district ID
- 4023610
- Math proficiency
- 16% ▼ -12.00%
- Reading proficiency
- 23% ▼ -5.00%
- Median HH income
- $39,841
- Composite
- 16.5/100
- National rank
- #9184
- State rank
- #176 of 270 in OK
Livability — Pawnee
- Score
- 66/100
- State rank
- #116
- US rank
- #11883
Category grades
Schools grade is shown separately in the Schools card above.
Census & demographics
- Census place
- Pawnee, OK
- Population (ZIP)
- 3,558
Population outlook (Pawnee County) Hauer SSP2
- Today (2025)
- 16,219 people
- By 2030
- 16,028 · -1.2%
- By 2040
- 15,724 · -3.1%
- By 2050
- 15,563 · -4.0%
- By 2075
- 15,905 · -1.9%
- By 2100
- 16,058 · -1.0%
Race, ethnicity, and origin ACS 2023
- Neighborhood character
- Predominantly White (71%)
- Race & ethnicity
- White 71% Native American 16% Two or more races 11% Hispanic / Latino 2%
- Common ancestry
- Lithuanian 4% Serbian 3% Slovak 3%
- Foreign-born
- 0%
- Languages at home
- 98% English-only · Spanish 1%
Political lean MEDSL · Pawnee
- 2024 margin
- Solid R (+58.9) · D 19.7% · R 78.6% · Other 1.7%
- 2008→2024 swing
- -21.4pp toward R · 2008: -37.4pp · 2024: -58.9pp
- All cycles
- 2024: R+58.9 2020: R+57.5 2016: R+53.2 2012: R+40.0 2008: R+37.4
Not yet ingested
- Civics
- —
Market trends
- HPI YoY
- —
- Current HPI
- —
- Rent YoY
- —
- Metro
- —
- State GDP YoY
- ▲ 1.55%
- F500 in state
- 6
Industry mix (Fortune 500 HQ in OK)
| Industry | F500 HQs | Revenue |
|---|---|---|
| Energy | 3 | $48B |
|
||
Price history
-29.2% since first listed7 events — show timeline
- 2026-03-13 Price Changed $85,000 MLS Technology, Inc.
- 2026-01-17 Price Changed $90,000 MLS Technology, Inc.
- 2026-01-13 Price Changed $95,000 MLS Technology, Inc.
- 2025-11-28 Price Changed $99,000 MLS Technology, Inc.
- 2025-08-24 Price Changed $105,000 MLS Technology, Inc.
- 2025-07-16 Price Changed $110,000 MLS Technology, Inc.
- 2025-06-01 Listed $120,000 MLS Technology, Inc.
Property tax history
+2.2%/yrLatest (2025): $1,028 · -5.4% YoY. Source: county tax records.
Cash-flow waterfall
monthlySold comps — $/sqft
last 12 mo · ≤1 miLoading sold comps…