325 Kelly Rd Lot O9 · Vernon, CT
Flood risk No data
- FEMA flood zone
- —
- Chance of flooding over 30 yrs
- —
- Est. flood insurance / yr
- —
Fire risk No data
- Est. fire insurance / yr
- —
Heat risk No data
- Hot days now (above threshold)
- —
- Hot days in 30 yrs
- —
Wind risk No data
- Chance of severe wind over 30 yrs
- —
Air-quality risk No data
- Unhealthy air days now
- —
- Unhealthy air days in 30 yrs
- —
Risk factors via First Street. Map © Google.
Why this score? — see what drove the B- grade
The composite is a weighted blend of 9 inputs, each scored 0–100. Each bar is that input's sub-score; the figure is the points it added to the 100-point composite (weight × sub-score).
- Cash flow +30.0/30.0
- 1% rule +10.0/10.0
- DSCR +10.0/10.0
- ARV discount +7.5/15.0
- Rent growth +3.7/5.0
- Schools +3.6/10.0
- Livability +2.5/5.0
- Condition / age +2.5/5.0
- Appreciation +0.0/10.0
$69,000
🖨 Deal sheet 📄 Offer letter ✓ Due diligence
Listing remarks
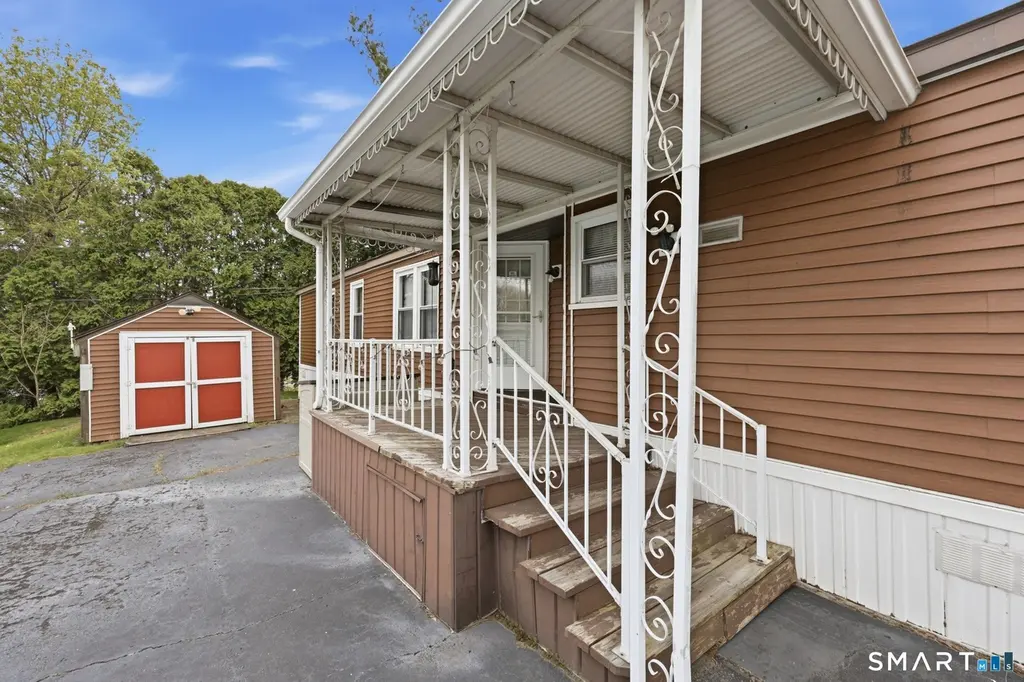
Welcome to easy, low-maintenance living in the desirable 55+ community of Vernon Village Inc. ! This well-maintained manufactured home is perfect for retirees, downsizers, or anyone looking for comfortable one-level living in a quiet community setting. This 2-bedroom, 2 full bath home offers a functional layout with spacious living areas and several major updates already completed, including newer roof, siding, central air, and water heater. The kitchen comes equipped with stainless steel appliances including a refrigerator, gas range, and dishwasher. Enjoy your morning coffee on the covered front porch or relax outdoors on the small rear deck. Conveniently located near shopping centers, me
Key facts
- Covered front porch
- Newer roof
- Newer siding
Tags
Property features AI
Finance
- HOA & community: Homeowners association with a monthly fee of $460; HOA covers trash pickup, snow removal, water and sewer; Association amenities include medical facilities; Professional on-site property management
Exterior
- Parking: Off-street parking; 2 parking spaces
- Utilities: Public water connected; Public sewer connected; Hot water by propane (30 gallon tank); Propane fuel tank above ground
- Home design: Single-family home; Adult community (55+)
- Construction: Prefab construction; Vinyl siding; Asphalt shingle roof; No foundation specified
- Exterior features: Porch; Shed; Located in a subdivision
Interior
- Kitchen: Gas range; Refrigerator; Dishwasher
- Bedrooms: 2 bedrooms
- Bathrooms: 2 full bathrooms
- Heating & cooling: Central air; Baseboard heat (propane fuel)
- Interior features: Open floor plan; No basement
- Laundry & utility: Laundry on the main level; Laundry located in hallway between kitchen and bathroom
Neighborhood map
What this means for you Summary
Snapshot
- This is a 2-bed/2.0-bath manufactured listed at $69k.
Deal economics
- At list price, monthly cash flow is $533 ($6k/yr) — positive.
- The deal already cash-flows at list — no discount required.
- Meets the 1% rule at list price ($2k rent vs $69k).
- Recommended offer: $68k (1.5% below list) — sets the bar for market timing.
Location & tenants
- Location reads: area grade B — affects rentability + tenant quality, not the cash-flow math above.
- Vernon School District (suburban): math 34% / reading 48% proficiency, ranked #97 of 153 in CT (top 63%) — families likely to look elsewhere, expect single-tenant / working-renter base with shorter leases.
- Zoned schools: Skinner Road School (math 32% / reading 47%, grade F, #298 of 553 statewide, top 56%, 321 students, 52% FRL); Rockville High School (math 22% / reading 52%, grade F, #112 of 194 statewide, top 60%, 932 students, 48% FRL).
- Market conditions: Rents rising fast (+4.7%/yr); 81 active listings in the ZIP; 1 comparable units currently listed for rent nearby; solid renter incomes; 1,867 units permitted in Capitol Planning Region in 2024 (1,399 in 5+ unit buildings).
Forward outlook
- Local home prices are declining (-3.0%/yr); year-one equity from $477 of loan paydown is wiped out by about $2k of value loss. Plan a longer hold.
- At projected returns (-3.0% appreciation + 4.7% rent growth), your $19k cash investment doubles in ~4 years — after that, you're playing with house money.
Negotiation context
- It's been on market 28 days — a 2% lower offer ($68k) is reasonable based on typical stale-listing flexibility.
- Current owner paid $20k; list at $69k implies a 245% gain — meaningful room to come down on a strong offer.
Risks & watch-outs
- Watch-outs: HOA is 25% of rent.
Questions for the listing agent
- What does the HOA fee cover, when was the last increase, and are there any pending special assessments or reserve-fund shortfalls?
- Is there a deadline driving the sale (1031 exchange, divorce, estate, relocation)? That informs how much negotiation room exists.
- What's the average days-on-market for RENTAL listings here right now (not sales)? A rising rental-DOM trend means longer vacancies and softer asking-rent achievability than the comps imply.
- What's the recent tenant-quality profile in this submarket — average credit score on applications, eviction rate, late-payment / NSF rate, and stable-employment percentage? A property-management company in the area should have these aggregated.
- How much new for-sale + rental construction is in the pipeline within 1–3 miles? Heavy new supply typically softens prices + rents 12–24 months out; constrained supply supports both.
Investment metrics
- 1% rule
- 2.66% ✓
- Cap rate
- 15.56%
- Cash-on-cash
- 33.10%
- DSCR
- 2.47
- GRM
- 3.1
CMA / ARV
No comps found within radius.
Projected returns pro-forma
-3.0% appreciation · 4.73% rent growth · sell at horizon
- IRR
- 31.3%
- Equity multiple
- 2.36×
- Total profit
- $26,317
- Equity at exit
- $10,288
- IRR
- 39.9%
- Equity multiple
- 5.23×
- Total profit
- $81,676
- Equity at exit
- $5,966
Cash invested: $19,320 (down + closing). Projections, not guarantees.
Landlord ↔ Tenant lean methodology
- Overall (STATE)
- 27 Tenant-Leaning
- State Connecticut
- 27 Tenant-Leaning · D+7
- County
- — inherits STATE
- City
- — inherits STATE
ZIP-level market 06066
- Rents YoY
- 4.7%
- Active inventory
- 81
- Price-to-rent
- 3.1×
Monthly cashflow live
- Estimated rent
- $1,838 medium interval (Pro) →
- Mortgage (P&I)
- −$362
- Tax from tax record
- −$68 /mo · $821/yr
- Insurance
- −$29
- HOA
- −$460
- Vacancy / Maint / Mgmt
- −$386
- Net cashflow
- $533
Break-even live
UW: 25.0% down · 7.5% · 30yr · 1.5% tax · 5.0% vac · 8.0% maint · 8.0% mgmt
Financing live
Cash to close
- Down payment
- $17,250
- Closing costs
- $2,070
- Reserves months
- —
- Total cash needed
- —
Loan-product check · same deal, 3 products live
Conventional
25% down · 7.5% · 30yr
- Down + closing
- —
- Monthly P&I
- —
- Monthly cashflow
- —
- DSCR
- —
- Eligible?
- —
Personal DTI + credit; lowest rate.
DSCR
20% down · 8.5% · 30yr
- Down + closing
- —
- Monthly P&I
- —
- Monthly cashflow
- —
- DSCR
- —
- Eligible?
- —
No personal income docs; deal must DSCR.
Hard money
10% down · 12.0% · 12mo
- Down + closing
- —
- Monthly P&I
- —
- Monthly cashflow
- —
- DSCR
- —
- Eligible?
- —
Short-term bridge; refi at stabilization.
Rent comps 1 comps
| Address | Beds | Baths | Sqft | Rent | $/sqft | DOM | Units | Dist |
|---|---|---|---|---|---|---|---|---|
| 25 Gerber Rd E South Windsor, CT | 2.0 | 1.0 | 900 | $2,045 | $2.27 | 1d | 1 | 0.40mi |
HOA detail
- Monthly dues
- $460 · $5,520/yr
- Likely covers
- watergas
Listing history 16 events
-
2026-06-18days on market $69,000 Active 28 DOM
-
2026-06-17days on market $69,000 Active 27 DOM
-
2026-06-16days on market $69,000 Active 26 DOM
-
2026-06-15days on market $69,000 Active 25 DOM
-
2026-06-13days on market $69,000 Active 23 DOM
-
2026-06-13days on market $69,000 Active 22 DOM
-
2026-06-10days on market $69,000 Active 20 DOM
-
2026-06-09days on market $69,000 Active 19 DOM
-
2026-06-08days on market $69,000 Active 18 DOM
-
2026-06-07days on market $69,000 Active 17 DOM
-
2026-06-03days on market $69,000 Active 13 DOM
-
2026-06-02days on market $69,000 Active 12 DOM
-
2026-06-01days on market $69,000 Active 11 DOM
-
2026-05-31days on market $69,000 Active 10 DOM
-
2026-04-30$75,000 Active
-
2014-11-25soldstatus $20,000
ⓘ Source: listings_history table (triggers on properties + properties_extension) + one-shot
backfill from property_details.listing_events for pre-trigger history.
Tax reassessment forecast CT · Partial reset (capped growth)
- Current annual tax
- $821 · $68/mo
- Projected year-2 tax
- $1,149 · $96/mo
- Expected delta
- +$328/yr (+$27/mo · 39.9%)
ⓘ Screening estimate from a state-policy table — verify with the county assessor before closing.
Nearby sold comps map
Loading sold comps map…
Walkable amenities ~0.75 mi
Loading nearby amenities…
Taxation est. · year 1
- Rental income
- $22,055
- − Mortgage interest
- −$3,865
- − Property taxes
- −$821
- − Insurance
- −$345
- − Repairs & maintenance
- −$1,764
- − Management
- −$1,764
- − HOA
- −$5,520
- − Depreciation
- −$2,007
- Taxable income
- $5,968
- Est. tax owed @ 24.0%
- −$1,432
- After-tax cash flow
- $4,963/yr
For passive investors: Depreciation is non-cash, so a rental often shows a tax loss while cash-flowing — sheltering income. Rental losses are passive: they offset passive income freely, and up to $25,000/yr can offset ordinary (W-2) income if you actively participate and your MAGI is under $100k (phasing out to $0 by $150k); unused losses carry forward. On sale, claimed depreciation is recaptured at up to 25%, and gains may owe capital-gains tax (a 1031 exchange can defer both). Figures are a year-1 estimate at your 24.0% rate — not tax advice; consult a CPA.
Schools (NCES district)
- District
- Vernon School District
- NCES district ID
- 0904680
- Math proficiency
- 34% ▼ -11.00%
- Reading proficiency
- 48% ▼ -6.00%
- Median HH income
- $60,342
- Composite
- 36.26/100
- National rank
- #4704
- State rank
- #97 of 153 in CT
Livability — Vernon
No livability data for this city. (Only ~50 U.S. cities are tracked.)
Census & demographics
- County
- Tolland County · 46,815 people
- Metro
- Hartford-East Hartford-Middletown, CT
- Population (ZIP)
- 30,577
- Household income
- $85,356
- Rent vs Own
- Severe rent burden
- 1140.0
Population outlook (Capitol County) Hauer SSP2
- By 2040
- 1,063,519
Race, ethnicity, and origin ACS 2023
- Neighborhood character
- Predominantly White (71%)
- Race & ethnicity
- White 71% Hispanic / Latino 12% Two or more races 7% Asian 6% Black 5%
- Hispanic origin (detail)
- Mexican 1% Puerto Rican 9%
- Common ancestry
- Lithuanian 8% Romanian 7% Slovak 2%
- Foreign-born
- 11% · Canada, China, South Korea
- Languages at home
- 84% English-only · Spanish 6% Other Indo-European 5% Russian/Polish/Slavic 1%
Political lean MEDSL · Capitol
- 2024 margin
- Strong D (+21.9) · D 60.1% · R 38.2% · Other 1.7%
- All cycles
- 2024: D+21.9
Not yet ingested
- Civics
- —
Market trends
- HPI YoY
- ▼ -136.25%
- Current HPI
- 249.7888
- Rent YoY
- ▲ 4.73%
- Metro
- Hartford-East Hartford-Middletown, CT
- State GDP YoY
- ▲ 1.06%
- F500 in state
- 38
Industry mix (Fortune 500 HQ in CT)
| Industry | F500 HQs | Revenue |
|---|---|---|
| Industrial Machinery | 4 | $38B |
|
||
| Insurance | 3 | $71B |
|
||
| Financial Services | 2 | $25B |
|
||
| Transportation / Logistics | 2 | $18B |
|
||
| Healthcare | 1 | $247B |
|
||
| Telecommunications | 1 | $55B |
|
||
Price history
+275.0% since first listed2 events — show timeline
- 2026-04-30 Listed $75,000 Smart MLS
- 2014-11-25 Sold (Public Records) $20,000 Public Records
Property tax history
-1.8%/yrLatest (2023): $821 · +0.0% YoY. Source: county tax records.
Cash-flow waterfall
monthlySold comps — $/sqft
last 12 mo · ≤1 miLoading sold comps…