 5-Plex
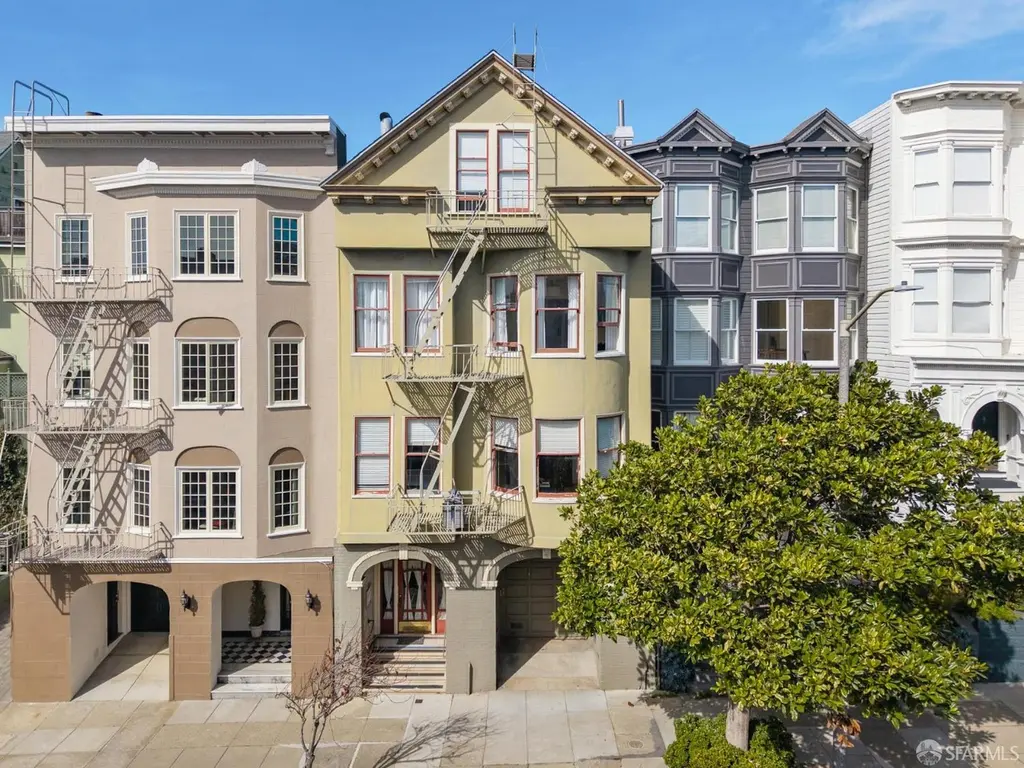
2870 Sacramento St · San Francisco, CA
Flood risk 1/10 · Minimal
- FEMA flood zone
- X (unshaded)
- Chance of flooding over 30 yrs
- 0.0%
- Est. flood insurance / yr
- $507 – $1,088
Fire risk 1/10 · Minimal
- Est. fire insurance / yr
- $659 – $1,223
Heat risk 2/10 · Minimal
- Hot days now (above 78°F)
- 7 days/yr
- Hot days in 30 yrs
- 17 days/yr
Wind risk 1/10 · Minimal
- Chance of severe wind over 30 yrs
- —
Air-quality risk 8/10 · Major
- Unhealthy air days now
- 15 days/yr
- Unhealthy air days in 30 yrs
- 15 days/yr
Risk factors via First Street. Map © Google.
Why this score? — see what drove the B- grade
The composite is a weighted blend of 9 inputs, each scored 0–100. Each bar is that input's sub-score; the figure is the points it added to the 100-point composite (weight × sub-score).
- Cash flow +23.7/30.0
- Appreciation +9.3/10.0
- DSCR +7.6/10.0
- ARV discount +6.9/15.0
- 1% rule +5.8/10.0
- Rent growth +5.0/5.0
- Schools +5.0/10.0
- Livability +3.8/5.0
- Condition / age +2.5/5.0
$3,250,000
🖨 Deal sheet (PDF) 📄 Offer letter ✓ Due diligence
Multi-family units
County records classify this as Multi-Family (5+ Unit). Listing-text estimate: 5 units. confirmed
5+ unit building — per-unit beds/baths from public records are typically unavailable; the breakdown below (if shown) is an estimate from the listing text.
Listing remarks
2870 Sacramento Street represents a rare opportunity to acquire a well-maintained 5-Unit trophy apartment building in the heart of magnificent Pacific Heights. Offering over 5,265 square feet of living area on a 3,192sqft lot (per tax records), this property features an exemplary unit mix, excellent scale, and expansion potential in a premier location. The building showcases a classic Edwardian facade and spacious floor plans with hardwood flooring and high ceilings, thoughtfully infused with modern updates and awash with natural light throughout the day. Unit 1 features an updated eat-in kitchen, generous double-parlor living and dining rooms, an updated tiled bath, a large primary bedroom
Key facts
- Common garden
- Premier location
- 3,192 sq ft lot
Tags
Property features AI
Finance
- Other: Living/building area reported as 5,265 square feet; Lot features include garden and sidewalk
- Financial info: Property is a 5-unit residential income building with all 5 units leased
- HOA & community: No association fee
Exterior
- Parking: Attached garage with 2 tandem spaces; Garage door opener
- Security: Separate meters for utilities (supports individual unit metering)
- Utilities: Common area meter and separate meters for gas, electric, and water; City/public water; Public sewer; Natural gas connected; Electricity available / electric on property
- Home design: Residential income property (multi-family); Edwardian style; 5 or more units; 1 building with 4 stories; Built in 1923; Updated/remodeled
- Construction: Asphalt/composition roof; Concrete perimeter foundation; Built in 1923
- Exterior features: Yard space; Garden; Balcony/deck and uncovered deck; Bay windows and partial dual-pane windows; Fenced; Sidewalk
Interior
- Kitchen: Updated kitchens in multiple units
- Bedrooms: Total of 5 bedrooms
- Flooring: Hardwood flooring; Tile flooring
- Bathrooms: 4 full bathrooms
- Heating & cooling: Baseboard heating; Gas water heater
- Interior features: Baseboard heating; Finished basement with storage space; Updated/remodeled condition
- Laundry & utility: In-unit water heaters; In-unit laundry in at least one unit
Neighborhood map
What this means for you Summary
Snapshot
- This is a 5 × 5-bed/4.0-bath units multifamily listed at $3.25M.
Deal economics
- At list price, monthly cash flow is $6k ($74k/yr) — positive. Per door: $1k/mo.
- The deal already cash-flows at list — no discount required.
- Meets the 1% rule at list price ($35k rent vs $3.25M).
- Recommended offer: $3.06M (6.0% below list) — sets the bar for market timing.
- Cap rate 8.6% vs local median 2.1% in San Francisco — top-decile yield for the area; either an underpriced asset or a hidden risk that comps aren't pricing in. Stress-test before assuming the spread holds.
Location & tenants
- Location reads 76/100 on livability (#90 in CA, #3,143 nationally) — a middle-class / working-renter tenant base. Strengths: amenities A+, commute A+, employment A+; Watch: crime F, cost of living F.
- San Francisco Unified (urban): math 50% / reading 56% proficiency, ranked #322 of 1,400 in CA (top 23%) — acceptable for families but not a draw, mixed tenant base, ~2y average lease.
- Zoned schools: Lilienthal (Claire) Elementary (669 students, 19% FRL); Giannini (A.P.) Middle (1,192 students, 34% FRL); Lowell High (2,632 students, 37% FRL) — zoned schools average 30% FRL vs 49% district-wide (19 pts lower); this property's tenant base skews higher-income than the district average.
- Market conditions: Rents rising fast (+20.6%/yr); 64 active listings in the ZIP; high-income renter base; 750 units permitted in San Francisco County in 2024 (688 in 5+ unit buildings).
- At $35,080/mo this rent would consume 278% of the median local household income ($152k/yr) (locally 2151% of renters already pay >50% of income on rent) — very limited rent-growth headroom before tenants either downsize or default.
Forward outlook
- In year one you build about $299k of equity ($22k loan paydown + $277k appreciation (8.5% local appreciation)).
- San Francisco County population projected at +39% by 2050 — long-run rental-demand tailwind backs the buy-and-hold thesis.
- At projected returns (8.5% appreciation + 8.0% rent growth), your $910k cash investment doubles in ~3 years — after that, you're playing with house money.
- By year 2, paydown + projected appreciation supports a ~$480k cash-out refi (75% LTV) — recoverable capital for the next deal without selling this one.
Negotiation context
- It's been on market 90 days — a 6% lower offer ($3.06M) is reasonable based on typical stale-listing flexibility.
Risks & watch-outs
- Watch-outs: built in 1923 — expect roof / HVAC / electrical / plumbing capex.
Questions for the listing agent
- It's been on market 90 days. Have you received any prior offers? Is the seller open to a 6% concession, seller financing, or rate buy-down credit?
- Can we see the unit-by-unit rent roll, current vacancy, and any below-market leases? What's the average tenancy length?
- What capital expenditures (roof, boiler, parking lot, exteriors) have been made in the last 5 years, and what's planned in the next 2?
- Built in 1923 — when were the roof, HVAC, electrical panel, plumbing, and water heater last replaced?
- Why hasn't it sold? Are there any deal-killer items the seller is aware of (foundation, flood, title, zoning, code violations)?
- Is there a deadline driving the sale (1031 exchange, divorce, estate, relocation)? That informs how much negotiation room exists.
- Schools are B-rated — typically a magnet for longer-tenancy family renters. What's the average tenant stay here, and is there a school-zone premium baked into asking?
- Crime grade is F in this area — have there been break-ins, vandalism, or insurance claims at this property in the last 3 years? What carrier currently insures it and at what premium?
- What's the average days-on-market for RENTAL listings here right now (not sales)? A rising rental-DOM trend means longer vacancies and softer asking-rent achievability than the comps imply.
- What's the recent tenant-quality profile in this submarket — average credit score on applications, eviction rate, late-payment / NSF rate, and stable-employment percentage? A property-management company in the area should have these aggregated.
- How much new apartment / multifamily construction is in the pipeline within 1–3 miles? Heavy new supply (>2% of stock underway) typically softens rents 12–24 months out; light construction supports rent growth.
Investment metrics
- 1% rule
- 1.08% ✓
- Cap rate
- 8.57%
- Cash-on-cash
- 8.12%
- DSCR
- 1.36
- GRM
- 7.7
CMA / ARV
- ARV (median comp)
- $3,207,015
- List price
- $3,250,000
- Delta
- 1.34%
- Verdict
- FAIR
- Comps
- 20 within 1.0 mi
Projected returns pro-forma
8.52% appreciation · 8.0% rent growth · sell at horizon
- IRR
- 29.5%
- Equity multiple
- 3.23×
- Total profit
- $2,024,789
- Equity at exit
- $2,584,256
- IRR
- 28.0%
- Equity multiple
- 7.66×
- Total profit
- $6,058,270
- Equity at exit
- $5,243,615
Cash invested: $910,000 (down + closing). Projections, not guarantees.
Landlord ↔ Tenant lean methodology
- Overall (CITY)
- 0 Strongly Tenant-Friendly
- State California
- 18 Strongly Tenant-Friendly · D+13
- County
- — inherits STATE
- City San Francisco
- 0 Strongly Tenant-Friendly · D+57
ZIP-level market 94115
- Home prices YoY
- 3.9%
- Rents YoY
- 20.6%
- Active inventory
- 64
- Price-to-rent
- 38.6×
Monthly cashflow live
- Estimated rent
- $35,080 medium interval (Pro) →
- Mortgage (P&I)
- −$17,043
- Tax from tax record
- −$3,155 /mo · $37,860/yr
- Insurance
- −$1,354
- HOA
- −$0
- Vacancy / Maint / Mgmt
- −$7,367
- Net cashflow
- $6,161
Break-even live
Sensitivity live
| Price | -10% $8,000 | -5% $7,081 | +0% $6,161 | +5% $5,241 | +10% $4,321 |
|---|---|---|---|---|---|
| Rent | -10% $3,389 | -5% $4,775 | +0% $6,161 | +5% $7,546 | +10% $8,932 |
| Rate | -1.0pp $7,797 | -0.5pp $6,987 | base $6,161 | +0.5pp $5,319 | +1.0pp $4,462 |
5-unit breakdown (identical units grouped — click to expand)
| Units | Beds | Baths | Est. rent |
|---|---|---|---|
| 5× units | 5 | 4 | $35,080 |
| #1 | 5 | 4 | $7,016 |
| #2 | 5 | 4 | $7,016 |
| #3 | 5 | 4 | $7,016 |
| #4 | 5 | 4 | $7,016 |
| #5 | 5 | 4 | $7,016 |
| Total (5 units) | $35,080 | ||
UW: 25.0% down · 7.5% · 30yr · 1.5% tax · 5.0% vac · 8.0% maint · 8.0% mgmt
Financing live
Cash to close
- Down payment
- $812,500
- Closing costs
- $97,500
- Reserves months
- —
- Total cash needed
- —
Loan-product check · same deal, 3 products live
Conventional
25% down · 7.5% · 30yr
- Down + closing
- —
- Monthly P&I
- —
- Monthly cashflow
- —
- DSCR
- —
- Eligible?
- —
Personal DTI + credit; lowest rate.
DSCR
20% down · 8.5% · 30yr
- Down + closing
- —
- Monthly P&I
- —
- Monthly cashflow
- —
- DSCR
- —
- Eligible?
- —
No personal income docs; deal must DSCR.
Hard money
10% down · 12.0% · 12mo
- Down + closing
- —
- Monthly P&I
- —
- Monthly cashflow
- —
- DSCR
- —
- Eligible?
- —
Short-term bridge; refi at stabilization.
Listing history 8 events
-
2026-06-07statusdays on market $3,250,000 Pending 90 DOM
-
2026-06-04days on market $3,250,000 Contingent - Show 88 DOM
-
2026-06-03days on market $3,250,000 Contingent - Show 87 DOM
-
2026-06-02days on market $3,250,000 Contingent - Show 86 DOM
-
2026-06-01days on market $3,250,000 Contingent - Show 85 DOM
-
2026-05-31days on market $3,250,000 Contingent - Show 84 DOM
-
2026-05-11historical Contingent - Show
-
2026-03-08$3,250,000 Active
ⓘ Source: listings_history table (triggers on properties + properties_extension) + one-shot
backfill from property_details.listing_events for pre-trigger history.
Tax reassessment forecast CA · Resets to sale price
- Current annual tax
- $37,860 · $3,155/mo
- Projected year-2 tax
- $37,860 · $3,155/mo
- Expected delta
- $0/yr ($0/mo · 0.0%)
ⓘ Screening estimate from a state-policy table — verify with the county assessor before closing.
Climate risk First Street
- Flood 1/10 Low FEMA zone X (unshaded) · 0% chance over 30 yrs
- Wildfire 1/10 Low
- Heat 2/10 Low 7 d/yr ≥78°F today · 17 d/yr by 30 yrs out
- Wind 1/10 Low
- Air quality 8/10 Severe 15 unhealthy d/yr today · 15 by 30 yrs out
Nearby sold comps map
Loading sold comps map…
Walkable amenities ~0.75 mi
Loading nearby amenities…
Taxation est. · year 1
- Rental income
- $420,960
- − Mortgage interest
- −$182,051
- − Property taxes
- −$37,860
- − Insurance
- −$16,250
- − Repairs & maintenance
- −$33,677
- − Management
- −$33,677
- − Depreciation
- −$94,545
- Taxable income
- $22,900
- Est. tax owed @ 24.0%
- −$5,496
- After-tax cash flow
- $68,432/yr
For passive investors: Depreciation is non-cash, so a rental often shows a tax loss while cash-flowing — sheltering income. Rental losses are passive: they offset passive income freely, and up to $25,000/yr can offset ordinary (W-2) income if you actively participate and your MAGI is under $100k (phasing out to $0 by $150k); unused losses carry forward. On sale, claimed depreciation is recaptured at up to 25%, and gains may owe capital-gains tax (a 1031 exchange can defer both). Figures are a year-1 estimate at your 24.0% rate — not tax advice; consult a CPA.
Schools (NCES district)
- District
- San Francisco Unified
- NCES district ID
- 0634410
- Math proficiency
- 50% ▬ 0.00%
- Reading proficiency
- 56% ▲ 1.00%
- Median HH income
- $81,249
- Composite
- 50.14/100
- National rank
- #4088
- State rank
- #322 of 1400 in CA
Livability — San Francisco
- Score
- 76/100
- State rank
- #90
- US rank
- #3143
Category grades
Schools grade is shown separately in the Schools card above.
Census & demographics
- Census place
- San Francisco, CA
- County
- San Francisco County · 827,552 people
- City population
- 827,552
- Metro
- San Francisco-Oakland-Berkeley, CA
- Population (ZIP)
- 32,629
- Household income
- $151,524
- Rent vs Own
- Severe rent burden
- 2151.0
Population outlook (San Francisco County) Hauer SSP2
- Today (2025)
- 1,030,936 people
- By 2030
- 1,110,409 · +7.7%
- By 2040
- 1,270,010 · +23.2%
- By 2050
- 1,435,001 · +39.2%
- By 2075
- 1,779,074 · +72.6%
- By 2100
- 1,966,767 · +90.8%
Race, ethnicity, and origin ACS 2023
- Neighborhood character
- Diverse neighborhood (Simpson 0.70)
- Race & ethnicity
- White 49% Asian 20% Two or more races 11% Hispanic / Latino 11% Black 10%
- Hispanic origin (detail)
- Mexican 6%
- Common ancestry
- Scotch-Irish 3% Romanian 3% Lithuanian 3%
- Foreign-born
- 26% · Canada, China, South Korea
- Languages at home
- 71% English-only · Spanish 6% Chinese 5% Russian/Polish/Slavic 3%
Political lean MEDSL · San Francisco
- 2024 margin
- Solid D (+64.8) · D 80.3% · R 15.5% · Other 4.1%
- 2008→2024 swing
- -5.7pp toward R · 2008: 70.5pp · 2024: 64.8pp
- All cycles
- 2024: D+64.8 2020: D+72.5 2016: D+76.1 2012: D+70.2 2008: D+70.5
Not yet ingested
- Civics
- —
Market trends
- HPI YoY
- ▲ 8.52%
- Current HPI
- 224.7175
- Rent YoY
- ▲ 20.62%
- Metro
- San Francisco-Oakland-Berkeley, CA
- State GDP YoY
- ▲ 3.21%
- F500 in state
- 116
Industry mix (Fortune 500 HQ in CA)
| Industry | F500 HQs | Revenue |
|---|---|---|
| Technology | 27 | $1,492B |
|
||
| Financial Services | 3 | $174B |
|
||
| Retail | 3 | $44B |
|
||
| Insurance | 3 | $26B |
|
||
| Media / Entertainment | 2 | $115B |
|
||
| Pharmaceuticals / Biotech | 2 | $62B |
|
||
Price history
2 events — show timeline
- 2026-05-11 Contingent — San Francisco MLS
- 2026-03-08 Listed $3,250,000 San Francisco MLS
Property tax history
+6.5%/yrLatest (2025): $37,860 · +6.2% YoY. Source: county tax records.
Cash-flow waterfall
monthlySold comps — $/sqft
last 12 mo · ≤1 miLoading sold comps…