 Multi-family
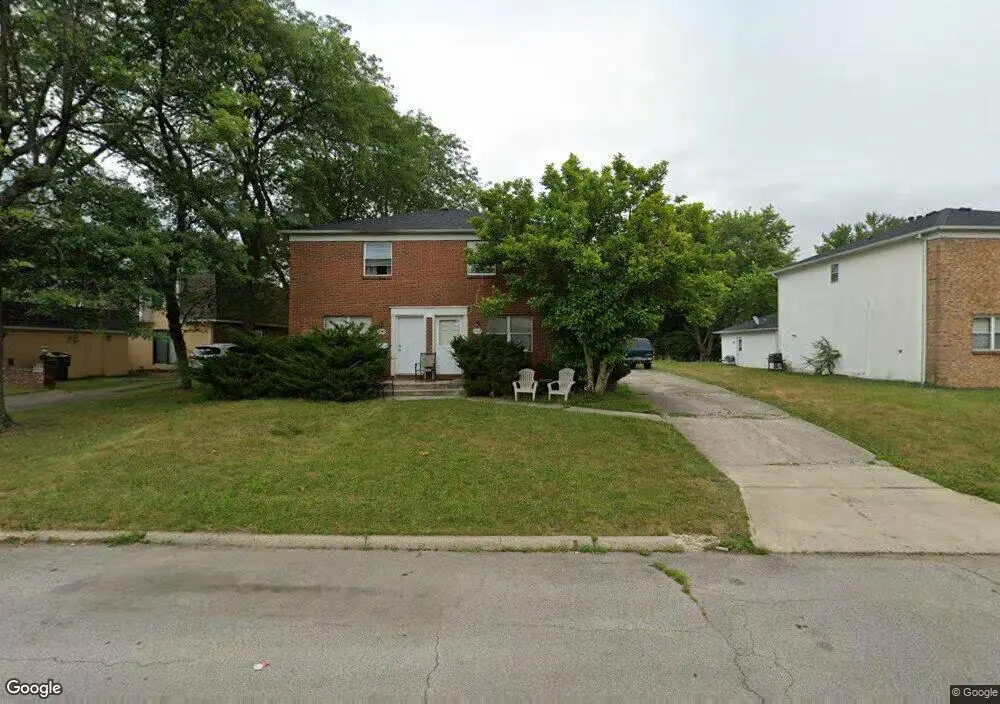
2040 Bairsford Dr · Columbus, OH
Flood risk 6/10 · Moderate
- FEMA flood zone
- X (unshaded)
- Chance of flooding over 30 yrs
- 0.68%
- Est. flood insurance / yr
- $473 – $860
Fire risk 1/10 · Minimal
- Est. fire insurance / yr
- $713 – $1,323
Heat risk 4/10 · Minor
- Hot days now (above 99°F)
- 7 days/yr
- Hot days in 30 yrs
- 18 days/yr
Wind risk 2/10 · Minimal
- Chance of severe wind over 30 yrs
- 1.0%
Air-quality risk 2/10 · Minimal
- Unhealthy air days now
- 1 days/yr
- Unhealthy air days in 30 yrs
- 2 days/yr
Risk factors via First Street. Map © Google.
Why this score? — see what drove the C+ grade
The composite is a weighted blend of 9 inputs, each scored 0–100. Each bar is that input's sub-score; the figure is the points it added to the 100-point composite (weight × sub-score).
- Cash flow +23.3/30.0
- ARV discount +15.0/15.0
- DSCR +7.5/10.0
- 1% rule +6.1/10.0
- Livability +4.0/5.0
- Rent growth +3.1/5.0
- Condition / age +2.2/5.0
- Schools +1.7/10.0
- Appreciation +0.0/10.0
$245,000
🖨 Deal sheet 📄 Offer letter ✓ Due diligence
Multi-family units
County records classify this as Multi-Family (2-4 Unit). Listing-text estimate: 1 unit. estimate disagrees with records
Key facts
- 0.23 acre lot
- Built 1971
- Listed 15 days
Property features AI
Finance
- Other: Property listed as Real Estate Owned (REO)
- Financial info: Two-unit property; Net operating income reported at $3,279; Operating expenses reported at $3,279
Exterior
- Utilities: Public water; Public sewer; Natural gas available; Electricity available; Storm sewer
- Home design: Duplex; Built in 1971
- Exterior features: Lot in Walnut Hills subdivision; Located near Livingston Road
Interior
- Heating & cooling: Central Air; Forced Air
- Interior features: Central air conditioning; Forced-air heating
Neighborhood map
What this means for you Summary
Snapshot
- This is a 4-bed/?-bath multifamily listed at $245k. Condition is rated fair.
Deal economics
- At list price, monthly cash flow is $449 ($5k/yr) — positive.
- The deal already cash-flows at list — no discount required.
- Meets the 1% rule at list price ($3k rent vs $245k).
- Recommended offer: $241k (1.5% below list) — sets the bar for market timing.
- Cap rate 8.5% vs local median 3.8% in Columbus — top-decile yield for the area; either an underpriced asset or a hidden risk that comps aren't pricing in. Stress-test before assuming the spread holds.
Location & tenants
- Location reads 81/100 on livability (#97 in OH, #1,491 nationally) — a professional / high-income tenant draw. Strengths: commute A+, cost of living A+, housing A+; Watch: employment C-, crime F.
- Columbus City School District (urban): math 15% / reading 26% proficiency, ranked #626 of 656 in OH (top 95%) — low school quality limits family demand, transient renter base, plan for 1-2y turnover; 72% free/reduced lunch — lower-income household profile, screen leases tightly.
- Market conditions: Rents rising (+2.4%/yr); 89 active listings in the ZIP; 6 comparable units currently listed for rent nearby; rentals at typical pace (median 24d on market — plan ~3-4 weeks tenant-placement turnaround); 8,139 units permitted in Franklin County in 2024 (5,940 in 5+ unit buildings).
- At $2,712/mo this rent would consume 63% of the median local household income ($51k/yr) (locally 2584% of renters already pay >50% of income on rent) — very limited rent-growth headroom before tenants either downsize or default.
Forward outlook
- Local home prices are declining (-3.0%/yr); year-one equity from $2k of loan paydown is wiped out by about $7k of value loss. Plan a longer hold.
- Franklin County population projected at +34% by 2050 — long-run rental-demand tailwind backs the buy-and-hold thesis.
Negotiation context
- It's been on market 15 days — a 2% lower offer ($241k) is reasonable based on typical stale-listing flexibility.
Risks & watch-outs
- Climate carrying-cost: major flood risk — expect insurance premiums to compound above CPI over the hold.
Questions for the listing agent
- Have any recent inspections been done? Can we get a copy of the seller's disclosures and any deferred-maintenance estimates?
- Built in 1971 — when were the roof, HVAC, electrical panel, plumbing, and water heater last replaced?
- Is there a deadline driving the sale (1031 exchange, divorce, estate, relocation)? That informs how much negotiation room exists.
- Crime grade is F in this area — have there been break-ins, vandalism, or insurance claims at this property in the last 3 years? What carrier currently insures it and at what premium?
- What's the average days-on-market for RENTAL listings here right now (not sales)? A rising rental-DOM trend means longer vacancies and softer asking-rent achievability than the comps imply.
- What's the recent tenant-quality profile in this submarket — average credit score on applications, eviction rate, late-payment / NSF rate, and stable-employment percentage? A property-management company in the area should have these aggregated.
- How much new apartment / multifamily construction is in the pipeline within 1–3 miles? Heavy new supply (>2% of stock underway) typically softens rents 12–24 months out; light construction supports rent growth.
Investment metrics
- 1% rule
- 1.11% ✓
- Cap rate
- 8.49%
- Cash-on-cash
- 7.86%
- DSCR
- 1.35
- GRM
- 7.5
CMA / ARV
- ARV (on-the-fly)
- $313,344
- Comps found
- 3
Show comp detail 3 sales within ~0.75 mi
| Address | Dist | Beds/Ba | Sqft | Sold | Price | $/sf | Match |
|---|---|---|---|---|---|---|---|
| 1950-1952 Bairsford Dr | 0.12mi | 4/— | 2,034 (-1%) | 12mo | $310,500 | $153 | 83 |
| 1942 Bairsford Dr | 0.13mi | 5/— (+1) | 2,180 (+6%) | 8mo | $335,000 | $154 | 72 |
| 5943 Rock Glen Ct | 0.57mi | 4/— | 2,148 (+5%) | 15mo | $318,000 | $148 | 53 |
Match score weights: distance 35% · size 25% · config 20% · recency 20%. Top-matched comps best support the ARV.
Projected returns pro-forma
-3.0% appreciation · 2.36% rent growth · sell at horizon
- IRR
- -5.0%
- Equity multiple
- 0.81×
- Total profit
- $-12,776
- Equity at exit
- $36,530
- IRR
- 3.9%
- Equity multiple
- 1.27×
- Total profit
- $18,862
- Equity at exit
- $21,183
Cash invested: $68,600 (down + closing). Projections, not guarantees.
Landlord ↔ Tenant lean methodology
- Overall (STATE)
- 73 Landlord-Friendly
- State Ohio
- 73 Landlord-Friendly · R+6
- County
- — inherits STATE
- City
- — inherits STATE
ZIP-level market 43232
- Rents YoY
- 2.4%
- Active inventory
- 89
- Price-to-rent
- 15.1×
Monthly cashflow live
- Estimated rent
- $2,712 high interval (Pro) →
- Mortgage (P&I)
- −$1,285
- Tax est. 1.5%
- −$306 /mo · $3,675/yr
- Insurance
- −$102
- HOA
- −$0
- Vacancy / Maint / Mgmt
- −$570
- Net cashflow
- $449
Break-even live
2-unit breakdown (identical units grouped — click to expand)
| Units | Beds | Baths | Est. rent |
|---|---|---|---|
| 2× units | 2 | 1.5 | $2,712 |
| #1 | 2 | 1.5 | $1,356 |
| #2 | 2 | 1.5 | $1,356 |
| Total (2 units) | $2,712 | ||
UW: 25.0% down · 7.5% · 30yr · 1.5% tax · 5.0% vac · 8.0% maint · 8.0% mgmt
Financing live
Cash to close
- Down payment
- $61,250
- Closing costs
- $7,350
- Reserves months
- —
- Total cash needed
- —
Loan-product check · same deal, 3 products live
Conventional
25% down · 7.5% · 30yr
- Down + closing
- —
- Monthly P&I
- —
- Monthly cashflow
- —
- DSCR
- —
- Eligible?
- —
Personal DTI + credit; lowest rate.
DSCR
20% down · 8.5% · 30yr
- Down + closing
- —
- Monthly P&I
- —
- Monthly cashflow
- —
- DSCR
- —
- Eligible?
- —
No personal income docs; deal must DSCR.
Hard money
10% down · 12.0% · 12mo
- Down + closing
- —
- Monthly P&I
- —
- Monthly cashflow
- —
- DSCR
- —
- Eligible?
- —
Short-term bridge; refi at stabilization.
Rent comps 6 comps
| Address | Beds | Baths | Sqft | Rent | $/sqft | DOM | Units | Dist |
|---|---|---|---|---|---|---|---|---|
| 1889 Birkdale Dr Columbus, OH | 4.0 | 2.5 | 2114 | $2,145 | $1.01 | 19d | 1 | 0.38mi |
| 2705 Denmark Rd Columbus, OH | 4.0 | 2.0 | 1504 | $2,199 | $1.46 | 23d | 1 | 0.92mi |
| 4902 Dickens Dr Columbus, OH | 5.0 | 2.5 | 2034 | $2,620 | $1.29 | 7d | 1 | 1.16mi |
| 6560 Benjamin Dr Reynoldsburg, OH | 3.0 | 1.5 | 1434 | $1,895 | $1.32 | 43d | 1 | 1.35mi |
| 4728 E Livingston Ave Columbus, OH | 4.0 | 2.0 | 1638 | $1,935 | $1.18 | 43d | 1 | 1.37mi |
| 1310 Easthill Dr Columbus, OH | 3.0 | 2.0 | 1690 | $2,092 | $1.24 | 1d | 7 | 1.43mi |
Listing history 10 events
-
2026-06-18days on market $245,000 Active 15 DOM
-
2026-06-17days on market $245,000 Active 14 DOM
-
2026-06-16days on market $245,000 Active 13 DOM
-
2026-06-15days on market $245,000 Active 12 DOM
-
2026-06-13days on market $245,000 Active 10 DOM
-
2026-06-13days on market $245,000 Active 9 DOM
-
2026-06-09days on market $245,000 Active 6 DOM
-
2026-06-08days on market $245,000 Active 5 DOM
-
2026-06-07days on market $245,000 Active 4 DOM
-
2026-06-05$245,000 Active 1 DOM
ⓘ Source: listings_history table (triggers on properties + properties_extension) + one-shot
backfill from property_details.listing_events for pre-trigger history.
Climate risk First Street
- Flood 6/10 Major FEMA zone X (unshaded) · 68% chance over 30 yrs
- Wildfire 1/10 Low
- Heat 4/10 Moderate 7 d/yr ≥99°F today · 18 d/yr by 30 yrs out
- Wind 2/10 Low 100% chance of damaging wind over 30 yrs
- Air quality 2/10 Low 1 unhealthy d/yr today · 2 by 30 yrs out
Nearby sold comps map
Loading sold comps map…
Walkable amenities ~0.75 mi
Loading nearby amenities…
Taxation est. · year 1
- Rental income
- $32,544
- − Mortgage interest
- −$13,724
- − Property taxes
- −$3,675
- − Insurance
- −$1,225
- − Repairs & maintenance
- −$2,604
- − Management
- −$2,604
- − Depreciation
- −$7,127
- Taxable income
- $1,586
- Est. tax owed @ 24.0%
- −$381
- After-tax cash flow
- $5,011/yr
For passive investors: Depreciation is non-cash, so a rental often shows a tax loss while cash-flowing — sheltering income. Rental losses are passive: they offset passive income freely, and up to $25,000/yr can offset ordinary (W-2) income if you actively participate and your MAGI is under $100k (phasing out to $0 by $150k); unused losses carry forward. On sale, claimed depreciation is recaptured at up to 25%, and gains may owe capital-gains tax (a 1031 exchange can defer both). Figures are a year-1 estimate at your 24.0% rate — not tax advice; consult a CPA.
Condition & rehab AI · 2 photos
This multi-family property requires significant repairs and maintenance, including a new roof, exterior siding, and HVAC system, as well as landscaping improvements. These updates will significantly increase its resale and rental value.
Repairs flagged
- Major roof — Signs of wear and discoloration suggest significant damage and potential water damage.
- Major exterior siding — The siding is visibly worn and in need of replacement or repainting.
- Major flooring — The flooring appears old and may need replacement for durability and appearance.
- Major interior walls/paint — The walls and paint show significant wear and discoloration, indicating a need for repainting.
- Major HVAC/mechanicals — The units appear old and may need replacement or repair for optimal performance.
- Major landscaping — The landscaping is overgrown and requires trimming and maintenance to improve curb appeal and property value.
Value-add opportunities
- Resale roof replacement — A new roof will significantly improve the home's appearance and reduce the risk of water damage.
- Resale exterior siding replacement — New siding will enhance the home's curb appeal and increase its resale value.
- Both HVAC system replacement — A new HVAC system will improve comfort and energy efficiency, benefiting both resale and rental value.
- Both landscaping and curb appeal improvements — A well-maintained and aesthetically pleasing landscape will enhance the home's curb appeal and attract potential buyers or renters.
Renovation cost estimate screening
| Repair item | Severity | Est. cost |
|---|---|---|
| roof · Signs of wear and discoloration suggest significant damage and potential water damage. | Major | $15,000–50,000 |
| exterior siding · The siding is visibly worn and in need of replacement or repainting. | Major | $15,000–50,000 |
| flooring · The flooring appears old and may need replacement for durability and appearance. | Major | $15,000–50,000 |
| interior walls/paint · The walls and paint show significant wear and discoloration, indicating a need for repainting. | Major | $15,000–50,000 |
| HVAC/mechanicals · The units appear old and may need replacement or repair for optimal performance. | Major | $15,000–50,000 |
| landscaping · The landscaping is overgrown and requires trimming and maintenance to improve curb appeal and property value. | Major | $15,000–50,000 |
| Total estimated repair cost · 6 items | $90,000–300,000 |
Value-add ROI direction
- Resale roof replacement — A new roof will significantly improve the home's appearance and reduce the risk of water damage. ↑
- Resale exterior siding replacement — New siding will enhance the home's curb appeal and increase its resale value. ↑
- Both HVAC system replacement — A new HVAC system will improve comfort and energy efficiency, benefiting both resale and rental value. ↑
- Both landscaping and curb appeal improvements — A well-maintained and aesthetically pleasing landscape will enhance the home's curb appeal and attract potential buyers or renters. ↑
ⓘ Cost ranges are severity-bucket heuristics (US national rule-of-thumb). Get contractor quotes + a written scope before underwriting a rehab budget.
Schools (NCES district)
- District
- Columbus City School District
- NCES district ID
- 3904380
- Math proficiency
- 15% ▼ -17.00%
- Reading proficiency
- 26% ▼ -12.00%
- Median HH income
- $38,483
- Composite
- 17.19/100
- National rank
- #9105
- State rank
- #626 of 656 in OH
Livability — Columbus
- Score
- 81/100
- State rank
- #97
- US rank
- #1491
Category grades
Schools grade is shown separately in the Schools card above.
Census & demographics
- Census place
- Columbus, OH
- County
- Franklin County · 1,351,780 people
- City population
- 612,189
- Metro
- Columbus, OH
- Population (ZIP)
- 47,364
- Household income
- $51,417
- Rent vs Own
- Severe rent burden
- 2584.0
Population outlook (Franklin County) Hauer SSP2
- Today (2025)
- 1,456,139 people
- By 2030
- 1,556,890 · +6.9%
- By 2040
- 1,757,349 · +20.7%
- By 2050
- 1,950,539 · +34.0%
- By 2075
- 2,376,171 · +63.2%
- By 2100
- 2,636,796 · +81.1%
Race, ethnicity, and origin ACS 2023
- Neighborhood character
- Diverse neighborhood (Simpson 0.58)
- Race & ethnicity
- Black 58% White 26% Hispanic / Latino 8% Two or more races 7% Asian 1%
- Hispanic origin (detail)
- Mexican 2% Puerto Rican 1% Dominican 1%
- Common ancestry
- Swiss 1% Slovak 1% Italian 1%
- Foreign-born
- 13% · Canada, China
- Languages at home
- 86% English-only · Spanish 6% French/Haitian/Cajun 1%
Political lean MEDSL · Franklin
- 2024 margin
- Strong D (+28.4) · D 63.7% · R 35.3% · Other 1.0%
- 2008→2024 swing
- +7.7pp toward D · 2008: 20.7pp · 2024: 28.4pp
- All cycles
- 2024: D+28.4 2020: D+31.4 2016: D+25.9 2012: D+21.7 2008: D+20.7
Not yet ingested
- Civics
- —
Market trends
- HPI YoY
- ▼ -203.49%
- Current HPI
- 249.3708
- Rent YoY
- ▲ 2.36%
- Metro
- Columbus, OH
- State GDP YoY
- ▲ 1.98%
- F500 in state
- 48
Industry mix (Fortune 500 HQ in OH)
| Industry | F500 HQs | Revenue |
|---|---|---|
| Insurance | 3 | $145B |
|
||
| Industrial Machinery | 3 | $49B |
|
||
| Financial Services | 3 | $24B |
|
||
| Consumer Goods | 2 | $93B |
|
||
| Aerospace / Defense | 2 | $47B |
|
||
| Utilities | 2 | $33B |
|
||
Price history
1 event — show timeline
- 2026-06-03 Listed $245,000 CBRMLS
Cash-flow waterfall
monthlySold comps — $/sqft
last 12 mo · ≤1 miLoading sold comps…