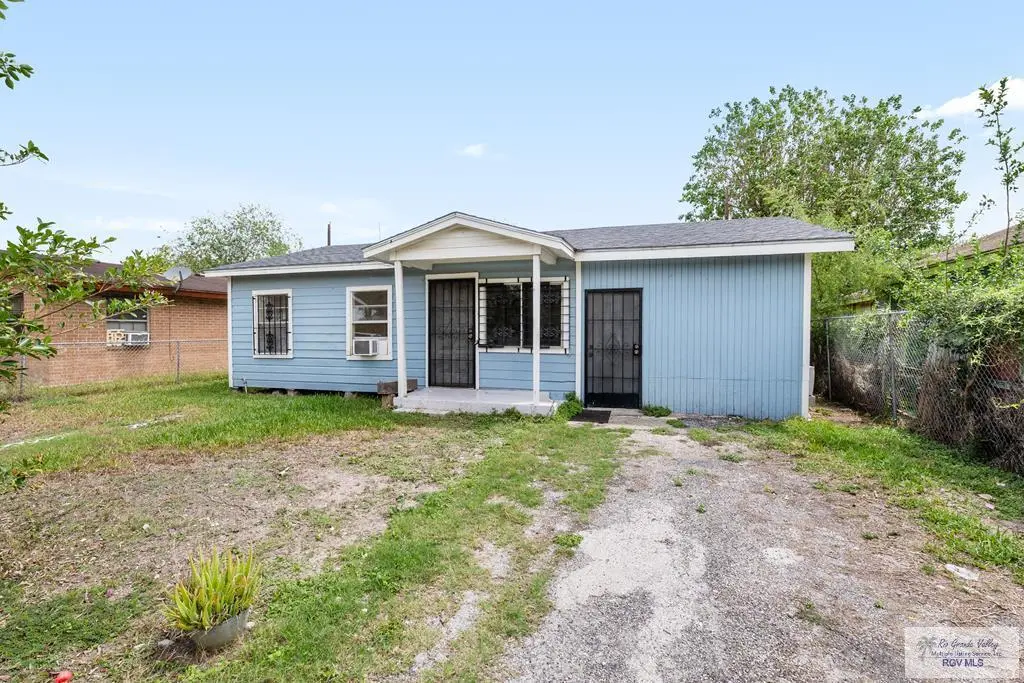
2744 E 32nd St · Brownsville, TX
Flood risk 1/10 · Minimal
- FEMA flood zone
- X (unshaded)
- Chance of flooding over 30 yrs
- 0.0%
- Est. flood insurance / yr
- $507 – $1,088
Fire risk 1/10 · Minimal
- Est. fire insurance / yr
- $1,222 – $2,270
Heat risk 9/10 · Severe
- Hot days now (above 111°F)
- 7 days/yr
- Hot days in 30 yrs
- 27 days/yr
Wind risk 9/10 · Severe
- Chance of severe wind over 30 yrs
- 99.0%
Air-quality risk 3/10 · Minor
- Unhealthy air days now
- 2 days/yr
- Unhealthy air days in 30 yrs
- 3 days/yr
Risk factors via First Street. Map © Google.
Why this score? — see what drove the C+ grade
The composite is a weighted blend of 9 inputs, each scored 0–100. Each bar is that input's sub-score; the figure is the points it added to the 100-point composite (weight × sub-score).
- Cash flow +23.2/30.0
- ARV discount +15.0/15.0
- DSCR +7.5/10.0
- 1% rule +6.0/10.0
- Rent growth +4.5/5.0
- Livability +4.0/5.0
- Condition / age +2.5/5.0
- Schools +2.2/10.0
- Appreciation +0.0/10.0
$119,000
🖨 Deal sheet 📄 Offer letter ✓ Due diligence
Listing remarks MLS
Great income-producing property or perfect for first-time buyers! Cozy 3-bed, 2-bath home with a large fenced backyard. Water heater replaced in April 2025, kitchen flooring updated at the same time with reinforced beams. Central A/C serviced in July 2025 (deep-cleaned indoor and outdoor units). Mini-split added in 2022 and a newer roof from 2020. A must see!
Key facts
- Flooring in kitchen
- New water heater
- Mini split
Tags
Neighborhood map
What this means for you Summary
Snapshot
- This is a 2-bed/2.0-bath single-family listed at $119k.
Deal economics
- At list price, monthly cash flow is $215 ($3k/yr) — positive.
- The deal already cash-flows at list — no discount required.
- Meets the 1% rule at list price ($1k rent vs $119k).
- Recommended offer: $105k (12.0% below list) — sets the bar for market timing.
- Cap rate 8.5% vs local median 5.0% in Brownsville — top-decile yield for the area; either an underpriced asset or a hidden risk that comps aren't pricing in. Stress-test before assuming the spread holds.
Location & tenants
- Location reads 79/100 on livability (#62 in TX, #2,311 nationally) — a middle-class / working-renter tenant base. Strengths: commute A+, cost of living A+, housing A+; Watch: schools C-, amenities D, crime D-.
- Brownsville ISD (urban): math 20% / reading 34% proficiency, ranked #710 of 826 in TX (top 86%) — low school quality limits family demand, transient renter base, plan for 1-2y turnover; 83% free/reduced lunch — lower-income household profile, screen leases tightly.
- Market conditions: Rents rising fast (+8.2%/yr); 365 active listings in the ZIP; 14 comparable units currently listed for rent nearby; rentals lingering (median 44d on market — plan ~5-8 weeks vacancy on turnover, expect pricing pressure); 57% of comp listings sitting > 30 days — soft ceiling on asking rent; lower-income renter base — watch delinquency; 2,326 units permitted in Cameron County in 2024 (503 in 5+ unit buildings).
- This rent runs 35% of the median local income ($45k/yr) — at the standard rent-burdened threshold; future hikes will face affordability resistance.
Forward outlook
- Local home prices are declining (-3.0%/yr); year-one equity from $823 of loan paydown is wiped out by about $4k of value loss. Plan a longer hold.
- Cameron County population projected at +3% by 2050 — modest demand growth; plan on rents tracking national, not racing it.
- At projected returns (-3.0% appreciation + 8.0% rent growth), your $33k cash investment doubles in ~8 years — after that, you're playing with house money.
Negotiation context
- It's been on market 262 days — a 12% lower offer ($105k) is reasonable based on typical stale-listing flexibility.
- 2 sale attempts; this cycle's ask has dropped $15k (11%) from the opening price — seller is motivated, your offer sets the floor, not the list.
Risks & watch-outs
- Climate carrying-cost: severe wind risk, 99% chance of damaging wind over 30y; extreme-heat days projected 7→27/yr by 2055 (HVAC capex compounding) — expect insurance premiums to compound above CPI over the hold.
Questions for the listing agent
- It's been on market 262 days. Have you received any prior offers? Is the seller open to a 12% concession, seller financing, or rate buy-down credit?
- Built in 1979 — when were the roof, HVAC, electrical panel, plumbing, and water heater last replaced?
- Why hasn't it sold? Are there any deal-killer items the seller is aware of (foundation, flood, title, zoning, code violations)?
- Is there a deadline driving the sale (1031 exchange, divorce, estate, relocation)? That informs how much negotiation room exists.
- Crime grade is D in this area — have there been break-ins, vandalism, or insurance claims at this property in the last 3 years? What carrier currently insures it and at what premium?
- What's the average days-on-market for RENTAL listings here right now (not sales)? A rising rental-DOM trend means longer vacancies and softer asking-rent achievability than the comps imply.
- What's the recent tenant-quality profile in this submarket — average credit score on applications, eviction rate, late-payment / NSF rate, and stable-employment percentage? A property-management company in the area should have these aggregated.
- How much new for-sale + rental construction is in the pipeline within 1–3 miles? Heavy new supply typically softens prices + rents 12–24 months out; constrained supply supports both.
Investment metrics
- 1% rule
- 1.10% ✓
- Cap rate
- 8.47%
- Cash-on-cash
- 7.76%
- DSCR
- 1.35
- GRM
- 7.6
CMA / ARV
- ARV (median comp)
- $145,156
- List price
- $119,000
- Delta
- -18.02%
- Verdict
- UNDERPRICED
- Comps
- 4 within 1.0 mi
Show comp detail 1 sale within ~0.75 mi
| Address | Dist | Beds/Ba | Sqft | Sold | Price | $/sf | Match |
|---|---|---|---|---|---|---|---|
| 2844 E 31st St | 0.10mi | 3/1.0 (+1) | 1,200 (+14%) | 7mo | $168,000 | $140 | 56 |
Match score weights: distance 35% · size 25% · config 20% · recency 20%. Top-matched comps best support the ARV.
Projected returns pro-forma
-3.0% appreciation · 8.0% rent growth · sell at horizon
- IRR
- 1.0%
- Equity multiple
- 1.04×
- Total profit
- $1,389
- Equity at exit
- $17,743
- IRR
- 15.2%
- Equity multiple
- 2.52×
- Total profit
- $50,501
- Equity at exit
- $10,289
Cash invested: $33,320 (down + closing). Projections, not guarantees.
Landlord ↔ Tenant lean methodology
- Overall (STATE)
- 87 Strongly Landlord-Friendly
- State Texas
- 87 Strongly Landlord-Friendly · R+5
- County
- — inherits STATE
- City
- — inherits STATE
ZIP-level market 78521
- Home prices YoY
- -26.0%
- Rents YoY
- 8.2%
- Active inventory
- 365
- Price-to-rent
- 7.6×
Monthly cashflow live
- Estimated rent
- $1,311 high interval (Pro) →
- Mortgage (P&I)
- −$624
- Tax from tax record
- −$147 /mo · $1,764/yr
- Insurance
- −$50
- HOA
- −$0
- Vacancy / Maint / Mgmt
- −$275
- Net cashflow
- $215
Break-even live
UW: 25.0% down · 7.5% · 30yr · 1.5% tax · 5.0% vac · 8.0% maint · 8.0% mgmt
Financing live
Cash to close
- Down payment
- $29,750
- Closing costs
- $3,570
- Reserves months
- —
- Total cash needed
- —
Loan-product check · same deal, 3 products live
Conventional
25% down · 7.5% · 30yr
- Down + closing
- —
- Monthly P&I
- —
- Monthly cashflow
- —
- DSCR
- —
- Eligible?
- —
Personal DTI + credit; lowest rate.
DSCR
20% down · 8.5% · 30yr
- Down + closing
- —
- Monthly P&I
- —
- Monthly cashflow
- —
- DSCR
- —
- Eligible?
- —
No personal income docs; deal must DSCR.
Hard money
10% down · 12.0% · 12mo
- Down + closing
- —
- Monthly P&I
- —
- Monthly cashflow
- —
- DSCR
- —
- Eligible?
- —
Short-term bridge; refi at stabilization.
Rent comps 14 comps
| Address | Beds | Baths | Sqft | Rent | $/sqft | DOM | Units | Dist |
|---|---|---|---|---|---|---|---|---|
| 2954 Impala Dr Brownsville, TX | 2.0 | 2.0 | 800 | $1,200 | $1.50 | 43d | 1 | 0.37mi |
| 508 Truman Dr Unit B Brownsville, TX | 3.0 | 1.0 | 960 | $975 | $1.02 | 43d | 1 | 0.60mi |
| 4318 Waco Rd Unit 1 Brownsville, TX | 3.0 | 2.0 | 1441 | $1,400 | $0.97 | 43d | 1 | 0.76mi |
| 3075 E 23rd St Brownsville, TX | 3.0 | 2.0 | 1350 | $1,375 | $1.02 | 43d | 1 | 0.79mi |
| 765 Billy Mitchell Blvd Ste 11 Brownsville, TX | 2.0 | 1.0 | 800 | $825 | $1.03 | 21d | 1 | 1.07mi |
| 4711 Morningside Rd Brownsville, TX | 2.0 | 2.0 | 1288 | $1,450 | $1.13 | 21d | 1 | 1.12mi |
| 1570 Los Alamos St Unit A Brownsville, TX | 3.0 | 2.0 | 1276 | $1,700 | $1.33 | 13d | 1 | 1.16mi |
| 3744 Boca Chica Blvd Unit 100F Brownsville, TX | 2.0 | 2.0 | 980 | $1,500 | $1.53 | 21d | 1 | 1.26mi |
| 1898 Morningside Rd Unit 4 Brownsville, TX | 2.0 | 1.0 | 756 | $800 | $1.06 | 43d | 1 | 1.26mi |
| 4995 Alexa Rd Unit B Brownsville, TX | 3.0 | 2.0 | 1063 | $1,750 | $1.65 | 43d | 1 | 1.28mi |
| 2024 E 19th St Brownsville, TX | 3.0 | 1.0 | 1259 | $2,000 | $1.59 | 21d | 1 | 1.28mi |
| 50 Galonsky St Unit 3 Brownsville, TX | 2.0 | 2.0 | 952 | $1,100 | $1.16 | 43d | 1 | 1.37mi |
| 1010 Apollo Ave Unit 13 Brownsville, TX | 2.0 | 1.0 | 800 | $795 | $0.99 | 43d | 1 | 1.39mi |
| 120 Galonsky St Unit G3 Brownsville, TX | 2.0 | 2.5 | 1224 | $1,325 | $1.08 | 21d | 1 | 1.47mi |
Listing history 23 events
-
2026-06-18days on market $119,000 Active 262 DOM
-
2026-06-17days on market $119,000 Active 261 DOM
-
2026-06-16days on market $119,000 Active 260 DOM
-
2026-06-15days on market $119,000 Active 259 DOM
-
2026-06-14days on market $119,000 Active 257 DOM
-
2026-06-13pricedays on market $119,000 Active 256 DOM
-
2026-06-10days on market $129,900 Active 254 DOM
-
2026-06-09days on market $129,900 Active 253 DOM
-
2026-06-08days on market $129,900 Active 252 DOM
-
2026-06-07days on market $129,900 Active 251 DOM
-
2026-06-05days on market $129,900 Active 248 DOM
-
2026-06-03days on market $129,900 Active 247 DOM
-
2026-06-02days on market $129,900 Active 246 DOM
-
2026-06-01days on market $129,900 Active 245 DOM
-
2026-05-31days on market $129,900 Active 244 DOM
-
2026-05-30days on market $129,900 Active 243 DOM
-
2026-04-02status Active 361-char remark
Show marketing remark (361 chars)
Great income-producing property or perfect for first-time buyers! Cozy 3-bed, 2-bath home with a large fenced backyard. Water heater replaced in April 2025, kitchen flooring updated at the same time with reinforced beams. Central A/C serviced in July 2025 (deep-cleaned indoor and outdoor units). Mini-split added in 2022 and a newer roof from 2020. A must see!
-
2026-02-13historical 361-char remark
Show marketing remark (361 chars)
Great income-producing property or perfect for first-time buyers! Cozy 3-bed, 2-bath home with a large fenced backyard. Water heater replaced in April 2025, kitchen flooring updated at the same time with reinforced beams. Central A/C serviced in July 2025 (deep-cleaned indoor and outdoor units). Mini-split added in 2022 and a newer roof from 2020. A must see!
-
2025-09-11price $129,900 361-char remark
Show marketing remark (361 chars)
Great income-producing property or perfect for first-time buyers! Cozy 3-bed, 2-bath home with a large fenced backyard. Water heater replaced in April 2025, kitchen flooring updated at the same time with reinforced beams. Central A/C serviced in July 2025 (deep-cleaned indoor and outdoor units). Mini-split added in 2022 and a newer roof from 2020. A must see!
-
2025-08-12$134,000 Active 361-char remark
Show marketing remark (361 chars)
Great income-producing property or perfect for first-time buyers! Cozy 3-bed, 2-bath home with a large fenced backyard. Water heater replaced in April 2025, kitchen flooring updated at the same time with reinforced beams. Central A/C serviced in July 2025 (deep-cleaned indoor and outdoor units). Mini-split added in 2022 and a newer roof from 2020. A must see!
-
2022-03-15soldstatus
-
2021-07-12soldstatus
-
2020-12-18soldstatus
ⓘ Source: listings_history table (triggers on properties + properties_extension) + one-shot
backfill from property_details.listing_events for pre-trigger history.
Tax reassessment forecast TX · Resets to sale price
- Current annual tax
- $1,764 · $147/mo
- Projected year-2 tax
- $2,178 · $181/mo
- Expected delta
- +$414/yr (+$35/mo · 23.5%)
ⓘ Screening estimate from a state-policy table — verify with the county assessor before closing.
Climate risk First Street
- Flood 1/10 Low FEMA zone X (unshaded) · 0% chance over 30 yrs
- Wildfire 1/10 Low
- Heat 9/10 Extreme 7 d/yr ≥111°F today · 27 d/yr by 30 yrs out
- Wind 9/10 Extreme 99% chance of damaging wind over 30 yrs
- Air quality 3/10 Moderate 2 unhealthy d/yr today · 3 by 30 yrs out
Nearby sold comps map
Loading sold comps map…
Walkable amenities ~0.75 mi
Loading nearby amenities…
Taxation est. · year 1
- Rental income
- $15,738
- − Mortgage interest
- −$6,666
- − Property taxes
- −$1,764
- − Insurance
- −$595
- − Repairs & maintenance
- −$1,259
- − Management
- −$1,259
- − Depreciation
- −$3,462
- Taxable income
- $733
- Est. tax owed @ 24.0%
- −$176
- After-tax cash flow
- $2,410/yr
For passive investors: Depreciation is non-cash, so a rental often shows a tax loss while cash-flowing — sheltering income. Rental losses are passive: they offset passive income freely, and up to $25,000/yr can offset ordinary (W-2) income if you actively participate and your MAGI is under $100k (phasing out to $0 by $150k); unused losses carry forward. On sale, claimed depreciation is recaptured at up to 25%, and gains may owe capital-gains tax (a 1031 exchange can defer both). Figures are a year-1 estimate at your 24.0% rate — not tax advice; consult a CPA.
Schools (NCES district)
- District
- Brownsville ISD
- NCES district ID
- 4811680
- Math proficiency
- 20% ▼ -36.00%
- Reading proficiency
- 34% ▼ -13.00%
- Median HH income
- $30,490
- Composite
- 21.8/100
- National rank
- #8249
- State rank
- #710 of 826 in TX
Livability — Brownsville
- Score
- 79/100
- State rank
- #62
- US rank
- #2311
Category grades
Schools grade is shown separately in the Schools card above.
Census & demographics
- Census place
- Brownsville, TX
- County
- Cameron County · 310,734 people
- City population
- 212,132
- Metro
- Brownsville-Harlingen, TX
- Population (ZIP)
- 87,380
- Household income
- $44,509
- Rent vs Own
- Severe rent burden
- 2682.0
Population outlook (Cameron County) Hauer SSP2
- Today (2025)
- 441,603 people
- By 2030
- 448,113 · +1.5%
- By 2040
- 456,385 · +3.3%
- By 2050
- 456,294 · +3.3%
- By 2075
- 423,851 · -4.0%
- By 2100
- 342,787 · -22.4%
Race, ethnicity, and origin ACS 2023
- Neighborhood character
- Predominantly Hispanic (97%)
- Race & ethnicity
- Hispanic / Latino 97% Two or more races 45% White 3%
- Hispanic origin (detail)
- Mexican 91%
- Foreign-born
- 30% · Canada
- Languages at home
- 12% English-only · Spanish 88%
Political lean MEDSL · Cameron
- 2024 margin
- Lean R (+5.8) · D 46.7% · R 52.5%
- 2008→2024 swing
- -34.6pp toward R · 2008: 28.8pp · 2024: -5.8pp
- All cycles
- 2024: R+5.8 2020: D+13.2 2016: D+32.5 2012: D+32.4 2008: D+28.8
Not yet ingested
- Civics
- —
Market trends
- HPI YoY
- ▼ -81.45%
- Current HPI
- 232.1072
- Rent YoY
- ▲ 8.19%
- Metro
- Brownsville-Harlingen, TX
- State GDP YoY
- ▲ 3.95%
- F500 in state
- 110
Industry mix (Fortune 500 HQ in TX)
| Industry | F500 HQs | Revenue |
|---|---|---|
| Energy | 16 | $1,198B |
|
||
| Technology | 5 | $198B |
|
||
| Engineering / Construction | 4 | $72B |
|
||
| Energy Services | 3 | $60B |
|
||
| Utilities | 3 | $41B |
|
||
| Healthcare | 2 | $330B |
|
||
Price history
-3.1% since first listed7 events — show timeline
- 2026-04-02 Relisted — RGVMLS
- 2026-02-13 Delisted — RGVMLS
- 2025-09-11 Price Changed $129,900 RGVMLS
- 2025-08-12 Listed $134,000 RGVMLS
- 2022-03-15 Sold (Public Records) — Public Records
- 2021-07-12 Sold (Public Records) — Public Records
- 2020-12-18 Sold (Public Records) — Public Records
Property tax history
+11.0%/yrLatest (2025): $1,764 · -10.1% YoY. Source: county tax records.
Cash-flow waterfall
monthlySold comps — $/sqft
last 12 mo · ≤1 miLoading sold comps…