405 W Elm St · Olney, TX
Flood risk 1/10 · Minimal
- FEMA flood zone
- X (unshaded)
- Chance of flooding over 30 yrs
- 0.0%
- Est. flood insurance / yr
- $507 – $1,088
Fire risk 8/10 · Major
- Est. fire insurance / yr
- $1,222 – $2,270
Heat risk 7/10 · Major
- Hot days now (above 109°F)
- 7 days/yr
- Hot days in 30 yrs
- 20 days/yr
Wind risk 4/10 · Minor
- Chance of severe wind over 30 yrs
- 11.0%
Air-quality risk 1/10 · Minimal
- Unhealthy air days now
- 0 days/yr
- Unhealthy air days in 30 yrs
- 0 days/yr
Risk factors via First Street. Map © Google.
Why this score? — see what drove the A- grade
The composite is a weighted blend of 9 inputs, each scored 0–100. Each bar is that input's sub-score; the figure is the points it added to the 100-point composite (weight × sub-score).
- Cash flow +30.0/30.0
- ARV discount +15.0/15.0
- 1% rule +10.0/10.0
- DSCR +10.0/10.0
- Schools +4.4/10.0
- Appreciation +4.0/10.0
- Livability +3.4/5.0
- Rent growth +2.5/5.0
- Condition / age +2.5/5.0
$55,000
🖨 Deal sheet (PDF) 📄 Offer letter ✓ Due diligence
Listing remarks MLS
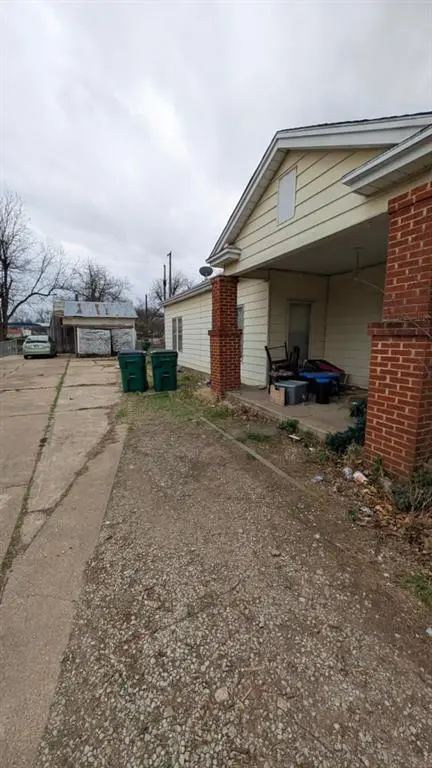
Investor special in the heart of Olney! This property offers a great opportunity for investors, flippers, or buyers looking to add value with renovations. Located at 405 W Elm St, the home sits in a convenient location within Olney ISD and is just minutes from local schools, shopping, and downtown. The property will require repairs and updates, but it has strong potential for the right buyer looking to restore or improve the home. With the right vision and work, this property could make a great rental, flip, or long-term investment. Sold as-is.
Key facts
- Strong potential
- Olney isd
- Local schools
Tags
Neighborhood map
What this means for you Summary
Snapshot
- This is a 3-bed/1.0-bath single-family listed at $55k.
Deal economics
- At list price, monthly cash flow is $584 ($7k/yr) — positive.
- The deal already cash-flows at list — no discount required.
- Meets the 1% rule at list price ($1k rent vs $55k).
- Recommended offer: $53k (3.0% below list) — sets the bar for market timing.
Location & tenants
- Location reads 67/100 on livability (#557 in TX) — a middle-class / working-renter tenant base. Strengths: crime A+, cost of living A+, housing A+; Watch: health & safety C-, amenities F, commute F.
- Olney ISD (town): math 50% / reading 56% proficiency, ranked #150 of 826 in TX (top 18%) — acceptable for families but not a draw, mixed tenant base, ~2y average lease; 60% free/reduced lunch — lower-income household profile, screen leases tightly.
- Zoned schools: Olney El (math 27% / reading 52%, grade F, #1,545 of 4,322 statewide, top 38%, 363 students, 64% FRL); Olney J H (math 62% / reading 57%, grade B, #166 of 1,662 statewide, top 11%, 159 students, 66% FRL); Olney H S (math 67% / reading 62%, grade B-, #199 of 1,632 statewide, top 14%, 207 students, 68% FRL).
- Market conditions: 30 active listings in the ZIP; 5 units permitted in Young County in 2024 (0 in 5+ unit buildings).
Forward outlook
- Local home prices are declining (-2.0%/yr); year-one equity from $380 of loan paydown is wiped out by about $1k of value loss. Plan a longer hold.
- Young County population projected to shrink 7% by 2050 — rents likely to lag national; underwrite the cash flow, not the appreciation.
- At projected returns (-2.0% appreciation + 3.0% rent growth), your $15k cash investment doubles in ~3 years — after that, you're playing with house money.
Negotiation context
- It's been on market 56 days — a 3% lower offer ($53k) is reasonable based on typical stale-listing flexibility.
Risks & watch-outs
- Watch-outs: built in 1950 — expect roof / HVAC / electrical / plumbing capex.
- Climate carrying-cost: severe wildfire risk; extreme-heat days projected 7→20/yr by 2055 (HVAC capex compounding) — expect insurance premiums to compound above CPI over the hold.
Questions for the listing agent
- It's been on market 56 days. Have you received any prior offers? Is the seller open to a 3% concession, seller financing, or rate buy-down credit?
- Built in 1950 — when were the roof, HVAC, electrical panel, plumbing, and water heater last replaced?
- Is there a deadline driving the sale (1031 exchange, divorce, estate, relocation)? That informs how much negotiation room exists.
- Schools are B-rated — typically a magnet for longer-tenancy family renters. What's the average tenant stay here, and is there a school-zone premium baked into asking?
- What's the average days-on-market for RENTAL listings here right now (not sales)? A rising rental-DOM trend means longer vacancies and softer asking-rent achievability than the comps imply.
- What's the recent tenant-quality profile in this submarket — average credit score on applications, eviction rate, late-payment / NSF rate, and stable-employment percentage? A property-management company in the area should have these aggregated.
- How much new for-sale + rental construction is in the pipeline within 1–3 miles? Heavy new supply typically softens prices + rents 12–24 months out; constrained supply supports both.
Investment metrics
- 1% rule
- 2.19% ✓
- Cap rate
- 19.03%
- Cash-on-cash
- 45.48%
- DSCR
- 3.02
- GRM
- 3.8
CMA / ARV
- ARV (median comp)
- $91,567
- List price
- $55,000
- Delta
- -39.93%
- Verdict
- UNDERPRICED
- Comps
- 20 within 1.0 mi
Show comp detail 6 sales within ~0.75 mi
| Address | Dist | Beds/Ba | Sqft | Sold | Price | $/sf | Match |
|---|---|---|---|---|---|---|---|
| 405 W Elm St | 0.00mi | 3/1.0 | 1,336 (0%) | 1mo | $55,000 | $41 | 99 |
| 602 Howard St | 0.32mi | 3/1.0 | 1,429 (+7%) | 9mo | $124,900 | $87 | 66 |
| 301 S Ave. H | 0.23mi | 3/1.0 | 1,152 (-14%) | 2mo | $89,900 | $78 | 65 |
| 304 W Hamilton St | 0.15mi | 3/2.0 | 1,492 (+12%) | 7mo | $95,000 | $64 | 64 |
| 806 W Oak | 0.31mi | 2/1.0 (-1) | 1,216 (-9%) | 6mo | $79,000 | $65 | 61 |
| 904 W Edwards St | 0.49mi | 3/2.0 | 1,374 (+3%) | 18mo | $175,000 | $127 | 54 |
Match score weights: distance 35% · size 25% · config 20% · recency 20%. Top-matched comps best support the ARV.
Projected returns pro-forma
-2.05% appreciation · 3.0% rent growth · sell at horizon
- IRR
- 43.9%
- Equity multiple
- 2.98×
- Total profit
- $30,474
- Equity at exit
- $10,547
- IRR
- 48.9%
- Equity multiple
- 5.96×
- Total profit
- $76,406
- Equity at exit
- $8,885
Cash invested: $15,400 (down + closing). Projections, not guarantees.
Landlord ↔ Tenant lean methodology
- Overall (STATE)
- 87 Strongly Landlord-Friendly
- State Texas
- 87 Strongly Landlord-Friendly · R+5
- County
- — inherits STATE
- City
- — inherits STATE
ZIP-level market 76374
- Home prices YoY
- -1.0%
- Active inventory
- 30
- Price-to-rent
- 3.8×
Monthly cashflow live
- Estimated rent
- $1,206 medium interval (Pro) →
- Mortgage (P&I)
- −$288
- Tax from tax record
- −$58 /mo · $691/yr
- Insurance
- −$23
- HOA
- −$0
- Vacancy / Maint / Mgmt
- −$253
- Net cashflow
- $584
Break-even live
Sensitivity live
| Price | -10% $615 | -5% $599 | +0% $584 | +5% $568 | +10% $552 |
|---|---|---|---|---|---|
| Rent | -10% $488 | -5% $536 | +0% $584 | +5% $631 | +10% $679 |
| Rate | -1.0pp $611 | -0.5pp $598 | base $584 | +0.5pp $569 | +1.0pp $555 |
UW: 25.0% down · 7.5% · 30yr · 1.5% tax · 5.0% vac · 8.0% maint · 8.0% mgmt
Financing live
Cash to close
- Down payment
- $13,750
- Closing costs
- $1,650
- Reserves months
- —
- Total cash needed
- —
Loan-product check · same deal, 3 products live
Conventional
25% down · 7.5% · 30yr
- Down + closing
- —
- Monthly P&I
- —
- Monthly cashflow
- —
- DSCR
- —
- Eligible?
- —
Personal DTI + credit; lowest rate.
DSCR
20% down · 8.5% · 30yr
- Down + closing
- —
- Monthly P&I
- —
- Monthly cashflow
- —
- DSCR
- —
- Eligible?
- —
No personal income docs; deal must DSCR.
Hard money
10% down · 12.0% · 12mo
- Down + closing
- —
- Monthly P&I
- —
- Monthly cashflow
- —
- DSCR
- —
- Eligible?
- —
Short-term bridge; refi at stabilization.
Listing history 12 events
-
2026-05-12status Pending 550-char remark
Show marketing remark (550 chars)
Investor special in the heart of Olney! This property offers a great opportunity for investors, flippers, or buyers looking to add value with renovations. Located at 405 W Elm St, the home sits in a convenient location within Olney ISD and is just minutes from local schools, shopping, and downtown. The property will require repairs and updates, but it has strong potential for the right buyer looking to restore or improve the home. With the right vision and work, this property could make a great rental, flip, or long-term investment. Sold as-is.
-
2026-05-08historical Active Option Contract 550-char remark
Show marketing remark (550 chars)
Investor special in the heart of Olney! This property offers a great opportunity for investors, flippers, or buyers looking to add value with renovations. Located at 405 W Elm St, the home sits in a convenient location within Olney ISD and is just minutes from local schools, shopping, and downtown. The property will require repairs and updates, but it has strong potential for the right buyer looking to restore or improve the home. With the right vision and work, this property could make a great rental, flip, or long-term investment. Sold as-is.
-
2026-04-15price $55,000 550-char remark
Show marketing remark (550 chars)
Investor special in the heart of Olney! This property offers a great opportunity for investors, flippers, or buyers looking to add value with renovations. Located at 405 W Elm St, the home sits in a convenient location within Olney ISD and is just minutes from local schools, shopping, and downtown. The property will require repairs and updates, but it has strong potential for the right buyer looking to restore or improve the home. With the right vision and work, this property could make a great rental, flip, or long-term investment. Sold as-is.
-
2026-03-10$60,000 Active 550-char remark
Show marketing remark (550 chars)
Investor special in the heart of Olney! This property offers a great opportunity for investors, flippers, or buyers looking to add value with renovations. Located at 405 W Elm St, the home sits in a convenient location within Olney ISD and is just minutes from local schools, shopping, and downtown. The property will require repairs and updates, but it has strong potential for the right buyer looking to restore or improve the home. With the right vision and work, this property could make a great rental, flip, or long-term investment. Sold as-is.
-
2021-03-10soldstatus
-
2020-03-31soldstatus
-
2015-08-24soldstatus
-
2009-07-31soldstatus
-
2001-06-04soldstatus
-
1999-12-01soldstatus
-
1995-09-01soldstatus
-
1983-05-01soldstatus
ⓘ Source: listings_history table (triggers on properties + properties_extension) + one-shot
backfill from property_details.listing_events for pre-trigger history.
Tax reassessment forecast TX · Resets to sale price
- Current annual tax
- $691 · $58/mo
- Projected year-2 tax
- $1,006 · $84/mo
- Expected delta
- +$316/yr (+$26/mo · 45.7%)
ⓘ Screening estimate from a state-policy table — verify with the county assessor before closing.
Climate risk First Street
- Flood 1/10 Low FEMA zone X (unshaded) · 0% chance over 30 yrs
- Wildfire 8/10 Severe
- Heat 7/10 Severe 7 d/yr ≥109°F today · 20 d/yr by 30 yrs out
- Wind 4/10 Moderate 11% chance of damaging wind over 30 yrs
- Air quality 1/10 Low 0 unhealthy d/yr today · 0 by 30 yrs out
Nearby sold comps map
Loading sold comps map…
Walkable amenities ~0.75 mi
Loading nearby amenities…
Taxation est. · year 1
- Rental income
- $14,469
- − Mortgage interest
- −$3,081
- − Property taxes
- −$691
- − Insurance
- −$275
- − Repairs & maintenance
- −$1,157
- − Management
- −$1,157
- − Depreciation
- −$1,600
- Taxable income
- $6,507
- Est. tax owed @ 24.0%
- −$1,562
- After-tax cash flow
- $5,442/yr
For passive investors: Depreciation is non-cash, so a rental often shows a tax loss while cash-flowing — sheltering income. Rental losses are passive: they offset passive income freely, and up to $25,000/yr can offset ordinary (W-2) income if you actively participate and your MAGI is under $100k (phasing out to $0 by $150k); unused losses carry forward. On sale, claimed depreciation is recaptured at up to 25%, and gains may owe capital-gains tax (a 1031 exchange can defer both). Figures are a year-1 estimate at your 24.0% rate — not tax advice; consult a CPA.
Schools (NCES district)
- District
- Olney ISD
- NCES district ID
- 4833630
- Math proficiency
- 50% ▼ -15.00%
- Reading proficiency
- 56% ▼ -3.00%
- Median HH income
- $37,813
- Composite
- 44.09/100
- National rank
- #2874
- State rank
- #150 of 826 in TX
Livability — Olney
- Score
- 67/100
- State rank
- #557
- US rank
- #10736
Category grades
Schools grade is shown separately in the Schools card above.
Census & demographics
- Census place
- Olney, TX
- Population (ZIP)
- 3,915
Population outlook (Young County) Hauer SSP2
- Today (2025)
- 17,860 people
- By 2030
- 17,620 · -1.3%
- By 2040
- 17,054 · -4.5%
- By 2050
- 16,551 · -7.3%
- By 2075
- 15,667 · -12.3%
- By 2100
- 14,066 · -21.2%
Race, ethnicity, and origin ACS 2023
- Neighborhood character
- Predominantly White (75%)
- Race & ethnicity
- White 75% Hispanic / Latino 20% Two or more races 7%
- Hispanic origin (detail)
- Mexican 18%
- Common ancestry
- Serbian 2% Italian 1% Slovak 1%
- Foreign-born
- 7% · Canada
- Languages at home
- 89% English-only · Spanish 9% Other Asian/Pacific 1%
Political lean MEDSL · Young
- 2024 margin
- Solid R (+76.2) · D 11.6% · R 87.8%
- 2008→2024 swing
- -12.8pp toward R · 2008: -63.5pp · 2024: -76.2pp
- All cycles
- 2024: R+76.2 2020: R+73.8 2016: R+74.6 2012: R+71.5 2008: R+63.5
Not yet ingested
- Civics
- —
Market trends
- HPI YoY
- ▼ -2.05%
- Current HPI
- 197.3031
- Rent YoY
- —
- Metro
- —
- State GDP YoY
- ▲ 3.95%
- F500 in state
- 110
Industry mix (Fortune 500 HQ in TX)
| Industry | F500 HQs | Revenue |
|---|---|---|
| Energy | 16 | $1,198B |
|
||
| Technology | 5 | $198B |
|
||
| Engineering / Construction | 4 | $72B |
|
||
| Energy Services | 3 | $60B |
|
||
| Utilities | 3 | $41B |
|
||
| Healthcare | 2 | $330B |
|
||
Price history
-8.3% since first listed12 events — show timeline
- 2026-05-12 Pending — NTREIS
- 2026-05-08 Contingent — NTREIS
- 2026-04-15 Price Changed $55,000 NTREIS
- 2026-03-10 Listed $60,000 NTREIS
- 2021-03-10 Sold (Public Records) — Public Records
- 2020-03-31 Sold (Public Records) — Public Records
- 2015-08-24 Sold (Public Records) — Public Records
- 2009-07-31 Sold (Public Records) — Public Records
- 2001-06-04 Sold (Public Records) — Public Records
- 1999-12-01 Sold (Public Records) — Public Records
- 1995-09-01 Sold (Public Records) — Public Records
- 1983-05-01 Sold (Public Records) — Public Records
Property tax history
-0.6%/yrLatest (2025): $691 · +14.2% YoY. Source: county tax records.
Cash-flow waterfall
monthlySold comps — $/sqft
last 12 mo · ≤1 miLoading sold comps…