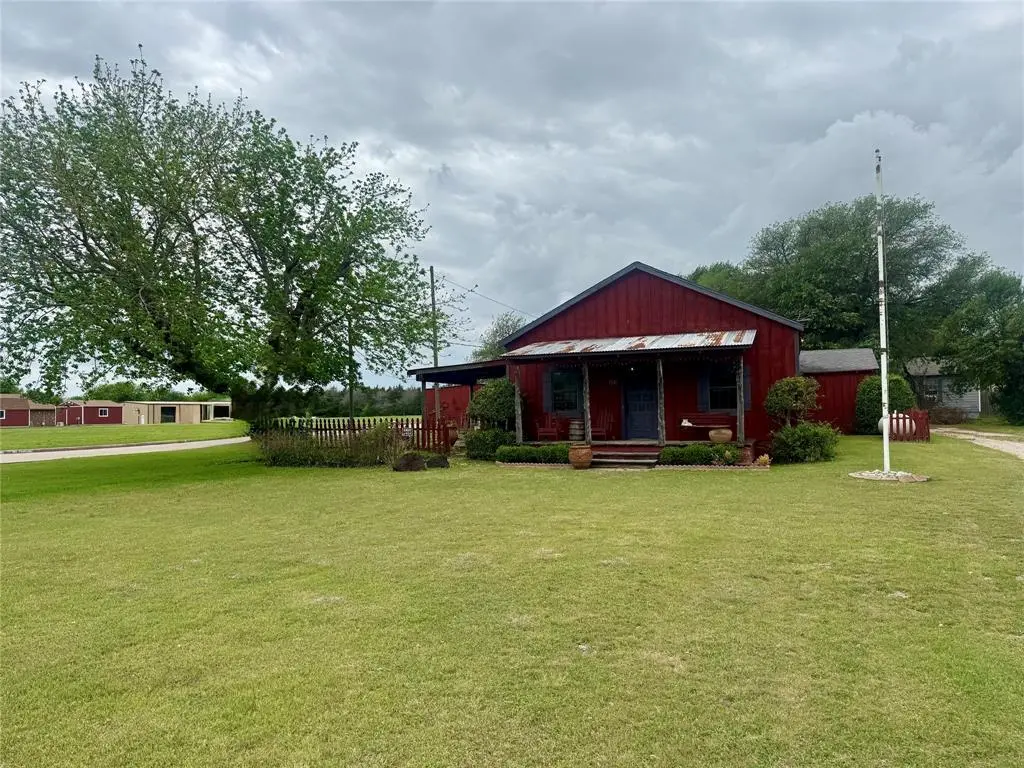
1321 Meadow St · DeSoto, TX
Flood risk 1/10 · Minimal
- FEMA flood zone
- X (unshaded)
- Chance of flooding over 30 yrs
- 0.0%
- Est. flood insurance / yr
- $507 – $1,088
Fire risk 4/10 · Minor
- Est. fire insurance / yr
- $1,222 – $2,270
Heat risk 7/10 · Major
- Hot days now (above 110°F)
- 7 days/yr
- Hot days in 30 yrs
- 24 days/yr
Wind risk 6/10 · Moderate
- Chance of severe wind over 30 yrs
- 27.0%
Air-quality risk 2/10 · Minimal
- Unhealthy air days now
- 2 days/yr
- Unhealthy air days in 30 yrs
- 2 days/yr
Risk factors via First Street. Map © Google.
Why this score? — see what drove the C+ grade
The composite is a weighted blend of 9 inputs, each scored 0–100. Each bar is that input's sub-score; the figure is the points it added to the 100-point composite (weight × sub-score).
- Cash flow +25.5/30.0
- ARV discount +15.0/15.0
- DSCR +8.4/10.0
- 1% rule +6.2/10.0
- Livability +3.3/5.0
- Condition / age +2.5/5.0
- Rent growth +1.9/5.0
- Schools +1.9/10.0
- Appreciation +0.0/10.0
$249,999
🖨 Deal sheet (PDF) 📄 Offer letter ✓ Due diligence
Listing remarks
Investor special on 1.26 acres in DeSoto with two homes on one property each with its own address! The main house offers approx. 2,051 sq ft, 1 bed 1 bath potential to add more, and the detached guest house offers approx. 1,469 sq ft 3 bed, 1 bath. Both properties require a full renovation and are being sold as-is, making this a great opportunity for investors or buyers looking to create value. Property includes barn and storage structures, shed, and patio areas. SOLD AS IS Strong after-repair value potential with options for rental income or multi generational living. Rare acreage plus dual living setup in a prime DeSoto location. Older survey is available buyer will be responsible for
Key facts
- Barn
- 1.26 acres
- Storage structures
Tags
Property features AI
Finance
- Other: Property listed as for sale, active status; Listing handled by Madera St Real Estate Group / Ultima Real Estate
- Financial info: Listing accepts Cash and Conventional financing; Loan type recorded as treat as clear; No second mortgage indicated
- HOA & community: No homeowners association
Exterior
- Parking: Additional/overflow parking available; Driveway access; Direct access parking; On-site parking (open/outside, oversized); Gravel parking
- Security: No specific security features provided
- Utilities: City water; City sewer; Not in a municipal utility district
- Home design: Single-family residence; Residential property; Built in 1957; Property is attached (per listing data)
- Construction: Year built 1957; No construction material, roof or foundation details provided
- Exterior features: Corner lot; Level lot; Acreage (about 1.26 acres); Easements present
Interior
- Kitchen: Other appliances
- Bedrooms: Four bedrooms total; Primary bedroom on level 1 (10 x 12)
- Flooring: No flooring details provided
- Bathrooms: Two full bathrooms
- Heating & cooling: No heating; No cooling
- Interior features: One-level layout; One living area; Two total rooms recorded; Other interior features
- Laundry & utility: No specific laundry or utility details provided
Neighborhood map
What this means for you Summary
Snapshot
- This is a 4-bed/3.0-bath single-family listed at $250k.
Deal economics
- At list price, monthly cash flow is $580 ($7k/yr) — positive.
- The deal already cash-flows at list — no discount required.
- Meets the 1% rule at list price ($3k rent vs $250k).
- Recommended offer: $242k (3.0% below list) — sets the bar for market timing.
- Cap rate 9.1% vs local median 3.4% in DeSoto — top-decile yield for the area; either an underpriced asset or a hidden risk that comps aren't pricing in. Stress-test before assuming the spread holds.
Location & tenants
- Location reads 66/100 on livability (#589 in TX) — a middle-class / working-renter tenant base. Strengths: cost of living A+, housing A+; Watch: amenities F, commute F, health & safety D-.
- Desoto ISD (suburban): math 14% / reading 26% proficiency, ranked #754 of 826 in TX (top 91%) — low school quality limits family demand, transient renter base, plan for 1-2y turnover; 66% free/reduced lunch — lower-income household profile, screen leases tightly.
- Zoned schools: The Meadows El (math 17% / reading 22%, grade F, #3,583 of 4,322 statewide, top 86%, 369 students, 72% FRL); Ruby Young Personalized Steam Academy (math 7% / reading 15%, grade F, #1,634 of 1,662 statewide, top 99%, 179 students, 54% FRL); Desoto H S (math 16% / reading 28%, grade F, #1,366 of 1,632 statewide, top 84%, 2,216 students, 60% FRL) — zoned schools at 62% FRL track the district average.
- Market conditions: Rents soft (-2.6%/yr); 475 active listings in the ZIP; 11 comparable units currently listed for rent nearby; rentals leasing fast (median 9d on market — plan ~1-2 weeks tenant-placement turnaround); solid renter incomes; 12,577 units permitted in Dallas County in 2024 (6,829 in 5+ unit buildings).
- This rent runs 41% of the median local income ($83k/yr) — at the standard rent-burdened threshold; future hikes will face affordability resistance.
Forward outlook
- Local home prices are declining (-3.0%/yr); year-one equity from $2k of loan paydown is wiped out by about $8k of value loss. Plan a longer hold.
- Dallas County population projected at +35% by 2050 — long-run rental-demand tailwind backs the buy-and-hold thesis.
Negotiation context
- It's been on market 45 days — a 3% lower offer ($242k) is reasonable based on typical stale-listing flexibility.
Risks & watch-outs
- Watch-outs: built in 1957 — expect roof / HVAC / electrical / plumbing capex.
- Climate carrying-cost: major wind risk, 27% chance of damaging wind over 30y; extreme-heat days projected 7→24/yr by 2055 (HVAC capex compounding) — expect insurance premiums to compound above CPI over the hold.
Questions for the listing agent
- It's been on market 45 days. Have you received any prior offers? Is the seller open to a 3% concession, seller financing, or rate buy-down credit?
- Built in 1957 — when were the roof, HVAC, electrical panel, plumbing, and water heater last replaced?
- Is there a deadline driving the sale (1031 exchange, divorce, estate, relocation)? That informs how much negotiation room exists.
- Schools are D-rated, which usually means shorter tenancies and higher turnover. Who's the typical renter profile here, and what's been the actual vacancy rate?
- What's the average days-on-market for RENTAL listings here right now (not sales)? A rising rental-DOM trend means longer vacancies and softer asking-rent achievability than the comps imply.
- What's the recent tenant-quality profile in this submarket — average credit score on applications, eviction rate, late-payment / NSF rate, and stable-employment percentage? A property-management company in the area should have these aggregated.
- How much new for-sale + rental construction is in the pipeline within 1–3 miles? Heavy new supply typically softens prices + rents 12–24 months out; constrained supply supports both.
Investment metrics
- 1% rule
- 1.12% ✓
- Cap rate
- 9.08%
- Cash-on-cash
- 9.94%
- DSCR
- 1.44
- GRM
- 7.4
CMA / ARV
- ARV (median comp)
- $350,292
- List price
- $249,999
- Delta
- -28.63%
- Verdict
- UNDERPRICED
- Comps
- 20 within 1.0 mi
Show comp detail 2 sales within ~0.75 mi
| Address | Dist | Beds/Ba | Sqft | Sold | Price | $/sf | Match |
|---|---|---|---|---|---|---|---|
| 904 Blue Quail Run | 0.67mi | 4/3.5 | 2,876 (-2%) | 14mo | $337,500 | $117 | 51 |
| 1408 Bobwhite Trl | 0.45mi | 5/3.0 (+1) | 2,703 (-8%) | 20mo | $360,000 | $133 | 44 |
Match score weights: distance 35% · size 25% · config 20% · recency 20%. Top-matched comps best support the ARV.
Projected returns pro-forma
-3.0% appreciation · 0.0% rent growth · sell at horizon
- IRR
- -4.7%
- Equity multiple
- 0.83×
- Total profit
- $-11,836
- Equity at exit
- $37,276
- IRR
- 1.2%
- Equity multiple
- 1.08×
- Total profit
- $5,348
- Equity at exit
- $21,615
Cash invested: $70,000 (down + closing). Projections, not guarantees.
Landlord ↔ Tenant lean methodology
- Overall (STATE)
- 87 Strongly Landlord-Friendly
- State Texas
- 87 Strongly Landlord-Friendly · R+5
- County
- — inherits STATE
- City
- — inherits STATE
ZIP-level market 75115
- Rents YoY
- -2.6%
- Active inventory
- 475
- Price-to-rent
- 7.4×
Monthly cashflow live
- Estimated rent
- $2,812 high interval (Pro) →
- Mortgage (P&I)
- −$1,311
- Tax from tax record
- −$227 /mo · $2,722/yr
- Insurance
- −$104
- HOA
- −$0
- Vacancy / Maint / Mgmt
- −$591
- Net cashflow
- $580
Break-even live
Sensitivity live
| Price | -10% $721 | -5% $651 | +0% $580 | +5% $509 | +10% $438 |
|---|---|---|---|---|---|
| Rent | -10% $358 | -5% $469 | +0% $580 | +5% $691 | +10% $802 |
| Rate | -1.0pp $706 | -0.5pp $643 | base $580 | +0.5pp $515 | +1.0pp $449 |
UW: 25.0% down · 7.5% · 30yr · 1.5% tax · 5.0% vac · 8.0% maint · 8.0% mgmt
Financing live
Cash to close
- Down payment
- $62,500
- Closing costs
- $7,500
- Reserves months
- —
- Total cash needed
- —
Loan-product check · same deal, 3 products live
Conventional
25% down · 7.5% · 30yr
- Down + closing
- —
- Monthly P&I
- —
- Monthly cashflow
- —
- DSCR
- —
- Eligible?
- —
Personal DTI + credit; lowest rate.
DSCR
20% down · 8.5% · 30yr
- Down + closing
- —
- Monthly P&I
- —
- Monthly cashflow
- —
- DSCR
- —
- Eligible?
- —
No personal income docs; deal must DSCR.
Hard money
10% down · 12.0% · 12mo
- Down + closing
- —
- Monthly P&I
- —
- Monthly cashflow
- —
- DSCR
- —
- Eligible?
- —
Short-term bridge; refi at stabilization.
Rent comps 11 comps
| Address | Beds | Baths | Sqft | Rent | $/sqft | DOM | Units | Dist |
|---|---|---|---|---|---|---|---|---|
| 1112 E Hidden Lakes Dr Desoto, TX | 5.0 | 3.5 | 2735 | $3,500 | $1.28 | 0d | 1 | 0.92mi |
| 1114 Fleming Ct Glenn Heights, TX | 5.0 | 3.5 | 3655 | $3,465 | $0.95 | 0d | 1 | 0.96mi |
| 2002 Bentwood Dr Glenn Heights, TX | 4.0 | 2.5 | 3168 | $2,720 | $0.86 | 12d | 1 | 1.12mi |
| 604 Trillium Ln Desoto, TX | 5.0 | 3.0 | 3750 | $2,795 | $0.75 | 1d | 1 | 1.21mi |
| 604 Snowy Orchid Ln Desoto, TX | 3.0 | 2.5 | 2929 | $2,730 | $0.93 | 1d | 1 | 1.23mi |
| 1117 Beeblossom Dr Desoto, TX | 3.0 | 2.0 | 2136 | $2,300 | $1.08 | 45d | 1 | 1.26mi |
| 624 Canyon Pl Desoto, TX | 4.0 | 3.0 | 2691 | $2,595 | $0.96 | 9d | 1 | 1.28mi |
| 737 Eldorado Dr Desoto, TX | 4.0 | 2.5 | 2262 | $2,345 | $1.04 | 1d | 1 | 1.31mi |
| 521 E Robin Ct Unit 1056455P DeSoto, TX | 5.0 | 2.0 | 2174 | $11,330 | $5.21 | 23d | 1 | 1.35mi |
| 708 Azalea Dr Unit 1310919P DeSoto, TX | 5.0 | 2.5 | 2378 | $17,002 | $7.15 | 26d | 1 | 1.35mi |
| 708 Azalea Dr Desoto, TX | 5.0 | 2.5 | 2380 | $8,750 | $3.68 | 45d | 1 | 1.35mi |
Listing history 16 events
-
2026-06-17status $249,999 Pending 45 DOM
-
2026-06-17days on market $249,999 Active 45 DOM
-
2026-06-16days on market $249,999 Active 44 DOM
-
2026-06-15days on market $249,999 Active 43 DOM
-
2026-06-13days on market $249,999 Active 41 DOM
-
2026-06-13days on market $249,999 Active 40 DOM
-
2026-06-09days on market $249,999 Active 37 DOM
-
2026-06-08days on market $249,999 Active 36 DOM
-
2026-06-07days on market $249,999 Active 35 DOM
-
2026-06-04days on market $249,999 Active 32 DOM
-
2026-06-03days on market $249,999 Active 31 DOM
-
2026-06-02days on market $249,999 Active 30 DOM
-
2026-06-02price $249,999 Active 29 DOM
-
2026-06-01days on market $270,000 Active 29 DOM
-
2026-05-31days on market $270,000 Active 28 DOM
-
2026-05-03$290,900 Active 757-char remark
ⓘ Source: listings_history table (triggers on properties + properties_extension) + one-shot
backfill from property_details.listing_events for pre-trigger history.
Tax reassessment forecast TX · Resets to sale price
- Current annual tax
- $2,722 · $227/mo
- Projected year-2 tax
- $4,575 · $381/mo
- Expected delta
- +$1,853/yr (+$154/mo · 68.1%)
ⓘ Screening estimate from a state-policy table — verify with the county assessor before closing.
Climate risk First Street
- Flood 1/10 Low FEMA zone X (unshaded) · 0% chance over 30 yrs
- Wildfire 4/10 Moderate
- Heat 7/10 Severe 7 d/yr ≥110°F today · 24 d/yr by 30 yrs out
- Wind 6/10 Major 27% chance of damaging wind over 30 yrs
- Air quality 2/10 Low 2 unhealthy d/yr today · 2 by 30 yrs out
Nearby sold comps map
Loading sold comps map…
Walkable amenities ~0.75 mi
Loading nearby amenities…
Taxation est. · year 1
- Rental income
- $33,749
- − Mortgage interest
- −$14,004
- − Property taxes
- −$2,722
- − Insurance
- −$1,250
- − Repairs & maintenance
- −$2,700
- − Management
- −$2,700
- − Depreciation
- −$7,273
- Taxable income
- $3,100
- Est. tax owed @ 24.0%
- −$744
- After-tax cash flow
- $6,213/yr
For passive investors: Depreciation is non-cash, so a rental often shows a tax loss while cash-flowing — sheltering income. Rental losses are passive: they offset passive income freely, and up to $25,000/yr can offset ordinary (W-2) income if you actively participate and your MAGI is under $100k (phasing out to $0 by $150k); unused losses carry forward. On sale, claimed depreciation is recaptured at up to 25%, and gains may owe capital-gains tax (a 1031 exchange can defer both). Figures are a year-1 estimate at your 24.0% rate — not tax advice; consult a CPA.
Schools (NCES district)
- District
- Desoto ISD
- NCES district ID
- 4816860
- Math proficiency
- 14% ▼ -19.00%
- Reading proficiency
- 26% ▼ -8.00%
- Median HH income
- $61,556
- Composite
- 18.98/100
- National rank
- #8851
- State rank
- #754 of 826 in TX
Livability — DeSoto
- Score
- 66/100
- State rank
- #589
- US rank
- #11236
Category grades
Schools grade is shown separately in the Schools card above.
Census & demographics
- Census place
- DeSoto, TX
- County
- Dallas County · 2,612,404 people
- City population
- 56,211
- Metro
- Dallas-Fort Worth-Arlington, TX
- Population (ZIP)
- 56,211
- Household income
- $82,782
- Rent vs Own
- Severe rent burden
- 1867.0
Population outlook (Dallas County) Hauer SSP2
- Today (2025)
- 2,979,839 people
- By 2030
- 3,191,823 · +7.1%
- By 2040
- 3,619,611 · +21.5%
- By 2050
- 4,026,915 · +35.1%
- By 2075
- 4,957,073 · +66.4%
- By 2100
- 5,508,725 · +84.9%
Race, ethnicity, and origin ACS 2023
- Neighborhood character
- Predominantly Black (68%)
- Race & ethnicity
- Black 68% Hispanic / Latino 19% Two or more races 11% White 8%
- Hispanic origin (detail)
- Mexican 17%
- Common ancestry
- Swedish 1%
- Foreign-born
- 9% · Canada, Dominican Republic
- Languages at home
- 83% English-only · Spanish 15% French/Haitian/Cajun 1%
Political lean MEDSL · Dallas
- 2024 margin
- Strong D (+22.2) · D 60.2% · R 38.0% · Other 1.8%
- 2008→2024 swing
- +6.9pp toward D · 2008: 15.3pp · 2024: 22.2pp
- All cycles
- 2024: D+22.2 2020: D+31.6 2016: D+26.2 2012: D+15.4 2008: D+15.3
Not yet ingested
- Civics
- —
Market trends
- HPI YoY
- ▼ -170.49%
- Current HPI
- 272.1565
- Rent YoY
- ▼ -2.60%
- Metro
- Dallas-Fort Worth-Arlington, TX
- State GDP YoY
- ▲ 3.95%
- F500 in state
- 110
Industry mix (Fortune 500 HQ in TX)
| Industry | F500 HQs | Revenue |
|---|---|---|
| Energy | 16 | $1,198B |
|
||
| Technology | 5 | $198B |
|
||
| Engineering / Construction | 4 | $72B |
|
||
| Energy Services | 3 | $60B |
|
||
| Utilities | 3 | $41B |
|
||
| Healthcare | 2 | $330B |
|
||
Price history
-14.1% since first listed4 events — show timeline
- 2026-06-17 Pending — NTREIS
- 2026-06-01 Price Changed $249,999 NTREIS
- 2026-05-24 Price Changed $270,000 NTREIS
- 2026-05-03 Listed $290,900 NTREIS
Property tax history
+5.3%/yrLatest (2025): $2,722 · +7.1% YoY. Source: county tax records.
Cash-flow waterfall
monthlySold comps — $/sqft
last 12 mo · ≤1 miLoading sold comps…