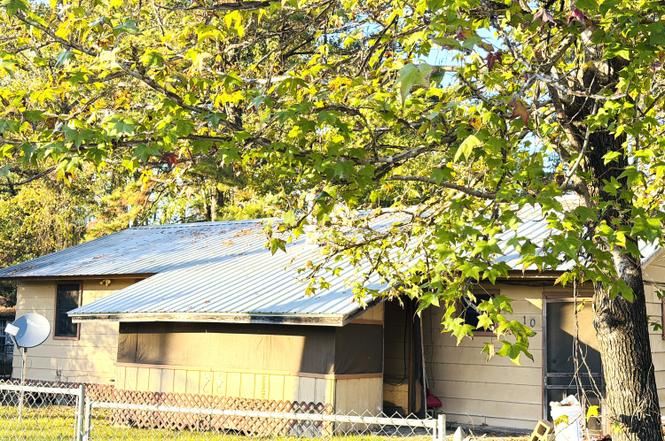
10 Jolly Rogers Dr · South Toledo Bend, TX
Flood risk 1/10 · Minimal
- FEMA flood zone
- X
- Chance of flooding over 30 yrs
- 0.0%
- Est. flood insurance / yr
- $507 – $1,088
Fire risk 5/10 · Moderate
- Est. fire insurance / yr
- $1,269 – $2,357
Heat risk 8/10 · Major
- Hot days now (above 110°F)
- 7 days/yr
- Hot days in 30 yrs
- 22 days/yr
Wind risk 8/10 · Major
- Chance of severe wind over 30 yrs
- 98.0%
Air-quality risk 1/10 · Minimal
- Unhealthy air days now
- 0 days/yr
- Unhealthy air days in 30 yrs
- 0 days/yr
Risk factors via First Street. Map © Google.
Why this score? — see what drove the B- grade
The composite is a weighted blend of 9 inputs, each scored 0–100. Each bar is that input's sub-score; the figure is the points it added to the 100-point composite (weight × sub-score).
- Cash flow +30.0/30.0
- 1% rule +10.0/10.0
- DSCR +10.0/10.0
- ARV discount +7.5/15.0
- Schools +2.7/10.0
- Livability +2.7/5.0
- Rent growth +2.5/5.0
- Condition / age +2.5/5.0
- Appreciation +0.0/10.0
$88,000
🖨 Deal sheet 📄 Offer letter ✓ Due diligence
Listing remarks
With a little TLC, this property offers endless possibilities! Nestled in the Pirates Cove Subdivision near Toledo Bend, this double-lot home is a hidden gem waiting for the right vision. Inside, you'll find materials already on-site, ready to complete the remodel -- saving time and effort for the next owner. Whether you're looking for a smart investment opportunity or a peaceful retreat for your family, the setting is ideal. The spacious lots provide room to expand, enjoy outdoor living, or create the perfect weekend getaway. Imagine relaxing evenings by the lake, family gatherings, or transforming this space into a rental that generates steady income. With its prime location and versatile
Key facts
- Double-lot home
- Spacious lots
- Prime location
Tags
Property features AI
Exterior
- Home design: Single-family residence; One story; Residential zoning
- Construction: Residential property type
- Exterior features: Metal roof; Irregular lot
Interior
- Bathrooms: 2 full bathrooms
- Interior features: 9 total rooms
Neighborhood map
What this means for you Summary
Snapshot
- This is a 3-bed/2.0-bath single-family listed at $88k.
Deal economics
- At list price, monthly cash flow is $682 ($8k/yr) — positive.
- The deal already cash-flows at list — no discount required.
- Meets the 1% rule at list price ($2k rent vs $88k).
- Recommended offer: $77k (12.0% below list) — sets the bar for market timing.
- Cap rate 15.6% vs local median 2.4% in South Toledo Bend — top-decile yield for the area; either an underpriced asset or a hidden risk that comps aren't pricing in. Stress-test before assuming the spread holds.
Location & tenants
- Location reads 53/100 on livability (#1,431 in TX) — a working-class tenant base; expect higher turnover. Strengths: cost of living A+, crime A; Watch: health & safety C-, housing D, schools F.
- Sabine Parish (rural): math 27% / reading 39% proficiency, ranked #40 of 98 in LA (top 41%) — families likely to look elsewhere, expect single-tenant / working-renter base with shorter leases; 64% free/reduced lunch — lower-income household profile, screen leases tightly.
- Market conditions: 49 units permitted in Sabine Parish in 2024 (0 in 5+ unit buildings).
Forward outlook
- Local home prices are declining (-3.0%/yr); year-one equity from $608 of loan paydown is wiped out by about $3k of value loss. Plan a longer hold.
- Sabine County population projected to shrink 7% by 2050 — rents likely to lag national; underwrite the cash flow, not the appreciation.
- At projected returns (-3.0% appreciation + 3.0% rent growth), your $25k cash investment doubles in ~4 years — after that, you're playing with house money.
Negotiation context
- It's been on market 173 days — a 12% lower offer ($77k) is reasonable based on typical stale-listing flexibility.
- 3 sale attempts since 7y ago with the ask held roughly flat each time — persistent listings suggest the price (not the market) is what's stuck; bring a comps-based counter.
- Current owner paid $11k; list at $88k implies a 696% gain — meaningful room to come down on a strong offer.
Risks & watch-outs
- Climate carrying-cost: severe wind risk, 98% chance of damaging wind over 30y; moderate wildfire risk; extreme-heat days projected 7→22/yr by 2055 (HVAC capex compounding) — expect insurance premiums to compound above CPI over the hold.
Questions for the listing agent
- It's been on market 173 days. Have you received any prior offers? Is the seller open to a 12% concession, seller financing, or rate buy-down credit?
- Built in 1970 — when were the roof, HVAC, electrical panel, plumbing, and water heater last replaced?
- Why hasn't it sold? Are there any deal-killer items the seller is aware of (foundation, flood, title, zoning, code violations)?
- Is there a deadline driving the sale (1031 exchange, divorce, estate, relocation)? That informs how much negotiation room exists.
- Schools are F-rated, which usually means shorter tenancies and higher turnover. Who's the typical renter profile here, and what's been the actual vacancy rate?
- What's the average days-on-market for RENTAL listings here right now (not sales)? A rising rental-DOM trend means longer vacancies and softer asking-rent achievability than the comps imply.
- What's the recent tenant-quality profile in this submarket — average credit score on applications, eviction rate, late-payment / NSF rate, and stable-employment percentage? A property-management company in the area should have these aggregated.
- How much new for-sale + rental construction is in the pipeline within 1–3 miles? Heavy new supply typically softens prices + rents 12–24 months out; constrained supply supports both.
Investment metrics
- 1% rule
- 1.77% ✓
- Cap rate
- 15.59%
- Cash-on-cash
- 33.20%
- DSCR
- 2.48
- GRM
- 4.7
CMA / ARV
No comps found within radius.
Projected returns pro-forma
-3.0% appreciation · 3.0% rent growth · sell at horizon
- IRR
- 28.4%
- Equity multiple
- 2.18×
- Total profit
- $29,149
- Equity at exit
- $13,121
- IRR
- 35.8%
- Equity multiple
- 4.30×
- Total profit
- $81,244
- Equity at exit
- $7,609
Cash invested: $24,640 (down + closing). Projections, not guarantees.
Landlord ↔ Tenant lean methodology
- Overall (STATE)
- 87 Strongly Landlord-Friendly
- State Texas
- 87 Strongly Landlord-Friendly · R+5
- County
- — inherits STATE
- City
- — inherits STATE
ZIP-level market 71429
- Home prices YoY
- -29.9%
- Price-to-rent
- 4.7×
Monthly cashflow live
- Estimated rent
- $1,558 medium interval (Pro) →
- Mortgage (P&I)
- −$461
- Tax from tax record
- −$51 /mo · $613/yr
- Insurance
- −$37
- HOA
- −$0
- Vacancy / Maint / Mgmt
- −$327
- Net cashflow
- $682
Break-even live
UW: 25.0% down · 7.5% · 30yr · 1.5% tax · 5.0% vac · 8.0% maint · 8.0% mgmt
Financing live
Cash to close
- Down payment
- $22,000
- Closing costs
- $2,640
- Reserves months
- —
- Total cash needed
- —
Loan-product check · same deal, 3 products live
Conventional
25% down · 7.5% · 30yr
- Down + closing
- —
- Monthly P&I
- —
- Monthly cashflow
- —
- DSCR
- —
- Eligible?
- —
Personal DTI + credit; lowest rate.
DSCR
20% down · 8.5% · 30yr
- Down + closing
- —
- Monthly P&I
- —
- Monthly cashflow
- —
- DSCR
- —
- Eligible?
- —
No personal income docs; deal must DSCR.
Hard money
10% down · 12.0% · 12mo
- Down + closing
- —
- Monthly P&I
- —
- Monthly cashflow
- —
- DSCR
- —
- Eligible?
- —
Short-term bridge; refi at stabilization.
Listing history 16 events
-
2026-06-19days on market $88,000 Active 173 DOM
-
2026-06-18days on market $88,000 Active 172 DOM
-
2026-06-17days on market $88,000 Active 171 DOM
-
2026-06-16days on market $88,000 Active 170 DOM
-
2026-06-15days on market $88,000 Active 169 DOM
-
2026-06-14days on market $88,000 Active 167 DOM
-
2026-06-12days on market $88,000 Active 166 DOM
-
2026-06-09days on market $88,000 Active 163 DOM
-
2026-06-08days on market $88,000 Active 162 DOM
-
2026-06-07days on market $88,000 Active 161 DOM
-
2026-06-07days on market $88,000 Active 160 DOM
-
2026-06-04days on market $88,000 Active 157 DOM
-
2026-06-02days on market $88,000 Active 156 DOM
-
2026-06-01days on market $88,000 Active 155 DOM
-
2026-05-31remarks 699-char remark
-
2026-05-31$88,000 Active 154 DOM
ⓘ Source: listings_history table (triggers on properties + properties_extension) + one-shot
backfill from property_details.listing_events for pre-trigger history.
Tax reassessment forecast TX · Resets to sale price
- Current annual tax
- $613 · $51/mo
- Projected year-2 tax
- $1,610 · $134/mo
- Expected delta
- +$997/yr (+$83/mo · 162.7%)
ⓘ Screening estimate from a state-policy table — verify with the county assessor before closing.
Climate risk First Street
- Flood 1/10 Low FEMA zone X · 0% chance over 30 yrs
- Wildfire 5/10 Major
- Heat 8/10 Severe 7 d/yr ≥110°F today · 22 d/yr by 30 yrs out
- Wind 8/10 Severe 98% chance of damaging wind over 30 yrs
- Air quality 1/10 Low 0 unhealthy d/yr today · 0 by 30 yrs out
Nearby sold comps map
Loading sold comps map…
Walkable amenities ~0.75 mi
Loading nearby amenities…
Taxation est. · year 1
- Rental income
- $18,699
- − Mortgage interest
- −$4,929
- − Property taxes
- −$613
- − Insurance
- −$440
- − Repairs & maintenance
- −$1,496
- − Management
- −$1,496
- − Depreciation
- −$2,560
- Taxable income
- $7,165
- Est. tax owed @ 24.0%
- −$1,719
- After-tax cash flow
- $6,462/yr
For passive investors: Depreciation is non-cash, so a rental often shows a tax loss while cash-flowing — sheltering income. Rental losses are passive: they offset passive income freely, and up to $25,000/yr can offset ordinary (W-2) income if you actively participate and your MAGI is under $100k (phasing out to $0 by $150k); unused losses carry forward. On sale, claimed depreciation is recaptured at up to 25%, and gains may owe capital-gains tax (a 1031 exchange can defer both). Figures are a year-1 estimate at your 24.0% rate — not tax advice; consult a CPA.
Schools (NCES district)
- District
- Sabine Parish
- NCES district ID
- 2201380
- Math proficiency
- 27% ▼ -38.00%
- Reading proficiency
- 39% ▼ -35.00%
- Median HH income
- $37,017
- Composite
- 27.41/100
- National rank
- #6970
- State rank
- #40 of 98 in LA
Livability — South Toledo Bend
- Score
- 53/100
- State rank
- #1431
- US rank
- #24460
Category grades
Schools grade is shown separately in the Schools card above.
Census & demographics
- Population (ZIP)
- 3,101
Population outlook (Sabine County) Hauer SSP2
- Today (2025)
- 23,820 people
- By 2030
- 23,505 · -1.3%
- By 2040
- 22,885 · -3.9%
- By 2050
- 22,235 · -6.7%
- By 2075
- 20,257 · -15.0%
- By 2100
- 17,348 · -27.2%
Race, ethnicity, and origin ACS 2023
- Neighborhood character
- Predominantly White (88%)
- Race & ethnicity
- White 88% Black 7% Hispanic / Latino 2%
- Common ancestry
- Lithuanian 4% Slovak 1% Iranian 1%
- Foreign-born
- 1%
- Languages at home
- 99% English-only · Spanish 1%
Political lean MEDSL · Sabine
- 2024 margin
- Solid R (+70.1) · D 14.6% · R 84.7%
- 2008→2024 swing
- -18.5pp toward R · 2008: -51.6pp · 2024: -70.1pp
- All cycles
- 2024: R+70.1 2020: R+66.5 2016: R+63.1 2012: R+55.1 2008: R+51.6
Not yet ingested
- Civics
- —
Market trends
- HPI YoY
- ▼ -62.68%
- Current HPI
- 146.6056
- Rent YoY
- —
- Metro
- —
- State GDP YoY
- ▲ 3.95%
- F500 in state
- 110
Industry mix (Fortune 500 HQ in TX)
| Industry | F500 HQs | Revenue |
|---|---|---|
| Energy | 16 | $1,198B |
|
||
| Technology | 5 | $198B |
|
||
| Engineering / Construction | 4 | $72B |
|
||
| Energy Services | 3 | $60B |
|
||
| Utilities | 3 | $41B |
|
||
| Healthcare | 2 | $330B |
|
||
Price history
+696.0% since first listed6 events — show timeline
- 2026-05-31 Relisted — GFPAR
- 2026-05-01 Delisted — GFPAR
- 2026-01-03 Price Changed $88,000 GFPAR
- 2025-11-28 Listed $92,000 GFPAR
- 2019-05-22 Listed $105,000 AcadianaMLS
- 2000-04-07 Sold (Public Records) $11,055 Public Records
Property tax history
+8.4%/yrLatest (2025): $613 · -6.2% YoY. Source: county tax records.
Cash-flow waterfall
monthlySold comps — $/sqft
last 12 mo · ≤1 miLoading sold comps…