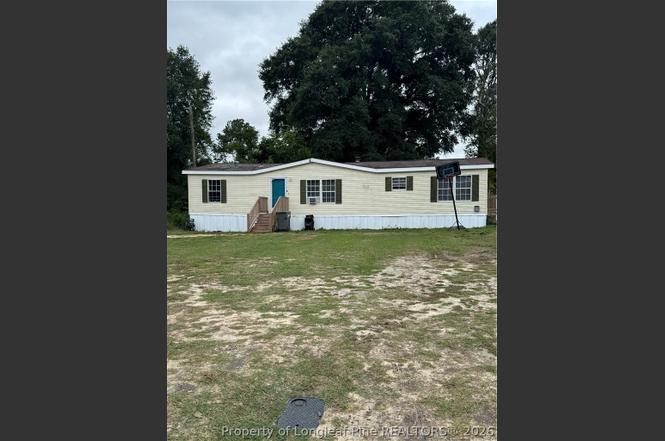
5769 Holland St · Fayetteville, NC
Flood risk 1/10 · Minimal
- FEMA flood zone
- X (unshaded)
- Chance of flooding over 30 yrs
- 0.0%
- Est. flood insurance / yr
- $507 – $1,088
Fire risk 4/10 · Minor
- Est. fire insurance / yr
- $906 – $1,684
Heat risk 7/10 · Major
- Hot days now (above 106°F)
- 7 days/yr
- Hot days in 30 yrs
- 16 days/yr
Wind risk 6/10 · Moderate
- Chance of severe wind over 30 yrs
- 74.0%
Air-quality risk 2/10 · Minimal
- Unhealthy air days now
- 0 days/yr
- Unhealthy air days in 30 yrs
- 1 days/yr
Risk factors via First Street. Map © Google.
Why this score? — see what drove the C grade
The composite is a weighted blend of 9 inputs, each scored 0–100. Each bar is that input's sub-score; the figure is the points it added to the 100-point composite (weight × sub-score).
- Cash flow +25.1/30.0
- DSCR +8.2/10.0
- ARV discount +7.5/15.0
- 1% rule +6.0/10.0
- Livability +3.8/5.0
- Rent growth +3.2/5.0
- Schools +3.1/10.0
- Condition / age +2.5/5.0
- Appreciation +0.0/10.0
$140,000
🖨 Deal sheet 📄 Offer letter ✓ Due diligence
Listing remarks
Income-producing property in a highly convenient Fayetteville location, currently occupied with a lease in place through October 2026 at $1,500 per month, making it an attractive opportunity for investors seeking immediate cash flow. The home features three bedrooms and two full bathrooms with a split-bedroom layout, offering privacy between the primary suite and secondary bedrooms. The primary suite includes generous closet space and a private bath with a soaking tub and separate walk-in shower, while the additional bedrooms share a full hallway bath. The kitchen is designed in a functional galley style and includes one refrigerator (gift), with washer and dryer connections nearby. Outside
Key facts
- Oversized yard
- Private bath
- Soaking tub
Tags
Property features AI
Exterior
- Parking: No garage
- Utilities: Public water; Holding tank or septic tank for sewer
- Home design: Manufactured home (residential); Zoned R6A - Residential District
- Construction: Vinyl siding
- Exterior features: Front porch; Rear porch; Porch
Interior
- Kitchen: Dishwasher; Electric oven; Refrigerator
- Flooring: Laminate flooring; Carpet
- Bathrooms: 2 full bathrooms
- Heating & cooling: Electric heating; Heat pump; Central air conditioning
- Interior features: Dishwasher; Electric oven; Refrigerator; Therapeutic whirlpool; One factory-built fireplace located in the den
Neighborhood map
What this means for you Summary
Snapshot
- This is a 3-bed/2.0-bath other listed at $140k.
Deal economics
- At list price, monthly cash flow is $309 ($4k/yr) — positive.
- The deal already cash-flows at list — no discount required.
- Meets the 1% rule at list price ($2k rent vs $140k).
- Cap rate 8.9% vs local median 4.9% in Fayetteville — top-decile yield for the area; either an underpriced asset or a hidden risk that comps aren't pricing in. Stress-test before assuming the spread holds.
Location & tenants
- Location reads 75/100 on livability (#45 in NC, #4,031 nationally) — a middle-class / working-renter tenant base. Strengths: commute A+, cost of living A+, housing A+; Watch: crime F, employment D-.
- Cumberland County Schools (urban): math 32% / reading 41% proficiency, ranked #126 of 178 in NC (top 71%) — families likely to look elsewhere, expect single-tenant / working-renter base with shorter leases.
- Zoned schools: Spring Lake Middle (math 15% / reading 31%, grade F, #406 of 475 statewide, top 86%, 512 students, 99% FRL); Pine Forest High (math 73% / reading 51%, grade B-, #184 of 535 statewide, top 37%, 1,572 students, 62% FRL) — zoned schools average 81% FRL vs 55% district-wide (26 pts higher); higher-poverty schools than district average — tighter screening recommended.
- Market conditions: Rents rising (+2.8%/yr); 360 active listings in the ZIP; 19 comparable units currently listed for rent nearby; rentals at typical pace (median 24d on market — plan ~3-4 weeks tenant-placement turnaround); 1,125 units permitted in Cumberland County in 2024 (104 in 5+ unit buildings).
Forward outlook
- Local home prices are declining (-3.0%/yr); year-one equity from $968 of loan paydown is wiped out by about $4k of value loss. Plan a longer hold.
Negotiation context
- Only 2 days on market — expect competitive offers; lowballing is unlikely to land.
- 10 sale attempts since 4y ago; this cycle's ask has dropped $10k (7%) from the opening price — seller is motivated, your offer sets the floor, not the list.
- Current owner paid $103k; 36% above their basis — modest negotiation headroom, anchor on the comps not their cost.
Risks & watch-outs
- Climate carrying-cost: major wind risk, 74% chance of damaging wind over 30y; extreme-heat days projected 7→16/yr by 2055 (HVAC capex compounding) — expect insurance premiums to compound above CPI over the hold.
Questions for the listing agent
- Is there a deadline driving the sale (1031 exchange, divorce, estate, relocation)? That informs how much negotiation room exists.
- Crime grade is F in this area — have there been break-ins, vandalism, or insurance claims at this property in the last 3 years? What carrier currently insures it and at what premium?
- What's the average days-on-market for RENTAL listings here right now (not sales)? A rising rental-DOM trend means longer vacancies and softer asking-rent achievability than the comps imply.
- What's the recent tenant-quality profile in this submarket — average credit score on applications, eviction rate, late-payment / NSF rate, and stable-employment percentage? A property-management company in the area should have these aggregated.
- How much new for-sale + rental construction is in the pipeline within 1–3 miles? Heavy new supply typically softens prices + rents 12–24 months out; constrained supply supports both.
Investment metrics
- 1% rule
- 1.10% ✓
- Cap rate
- 8.94%
- Cash-on-cash
- 9.46%
- DSCR
- 1.42
- GRM
- 7.5
CMA / ARV
No comps found within radius.
Projected returns pro-forma
-3.0% appreciation · 2.82% rent growth · sell at horizon
- IRR
- -2.2%
- Equity multiple
- 0.92×
- Total profit
- $-3,293
- Equity at exit
- $20,874
- IRR
- 7.3%
- Equity multiple
- 1.54×
- Total profit
- $21,291
- Equity at exit
- $12,105
Cash invested: $39,200 (down + closing). Projections, not guarantees.
Landlord ↔ Tenant lean methodology
- Overall (STATE)
- 85 Strongly Landlord-Friendly
- State North Carolina
- 85 Strongly Landlord-Friendly · R+3
- County
- — inherits STATE
- City
- — inherits STATE
ZIP-level market 28311
- Home prices YoY
- -18.4%
- Rents YoY
- 2.8%
- Active inventory
- 360
- Price-to-rent
- 7.5×
Monthly cashflow live
- Estimated rent
- $1,545 high interval (Pro) →
- Mortgage (P&I)
- −$734
- Tax from tax record
- −$119 /mo · $1,431/yr
- Insurance
- −$58
- HOA
- −$0
- Vacancy / Maint / Mgmt
- −$325
- Net cashflow
- $309
Break-even live
UW: 25.0% down · 7.5% · 30yr · 1.5% tax · 5.0% vac · 8.0% maint · 8.0% mgmt
Financing live
Cash to close
- Down payment
- $35,000
- Closing costs
- $4,200
- Reserves months
- —
- Total cash needed
- —
Loan-product check · same deal, 3 products live
Conventional
25% down · 7.5% · 30yr
- Down + closing
- —
- Monthly P&I
- —
- Monthly cashflow
- —
- DSCR
- —
- Eligible?
- —
Personal DTI + credit; lowest rate.
DSCR
20% down · 8.5% · 30yr
- Down + closing
- —
- Monthly P&I
- —
- Monthly cashflow
- —
- DSCR
- —
- Eligible?
- —
No personal income docs; deal must DSCR.
Hard money
10% down · 12.0% · 12mo
- Down + closing
- —
- Monthly P&I
- —
- Monthly cashflow
- —
- DSCR
- —
- Eligible?
- —
Short-term bridge; refi at stabilization.
Rent comps 19 comps
| Address | Beds | Baths | Sqft | Rent | $/sqft | DOM | Units | Dist |
|---|---|---|---|---|---|---|---|---|
| 5745 Holland St Fayetteville, NC | 3.0 | 1.0 | 1140 | $1,650 | $1.45 | 23d | 1 | 0.04mi |
| 1350 Shaw Rd Fayetteville, NC | 3.0 | 2.0 | 1339 | $1,399 | $1.04 | 14d | 1 | 0.17mi |
| 1404 Hibiscus Rd Fayetteville, NC | 3.0 | 1.5 | 1418 | $1,350 | $0.95 | 21d | 1 | 0.25mi |
| 5523 Livingston Dr Fayetteville, NC | 4.0 | 1.5 | 1305 | $1,600 | $1.23 | 23d | 1 | 0.73mi |
| 1526 Trevino Dr Fayetteville, NC | 3.0 | 2.0 | 1629 | $1,800 | $1.10 | 23d | 1 | 1.20mi |
| 1907 Eichelberger Dr Fayetteville, NC | 3.0 | 2.0 | 1463 | $1,650 | $1.13 | 23d | 1 | 1.21mi |
| 1882 Tryon Dr #4 Fayetteville, NC | 2.0 | 2.0 | 1063 | $1,100 | $1.03 | 14d | 1 | 1.24mi |
| 1808 Tryon Dr Fayetteville, NC | 2.0 | 2.0 | 1066 | $995 | $0.93 | 23d | 1 | 1.28mi |
| 1861 Tryon Dr Unit 3 Fayetteville, NC | 2.0 | 2.0 | 1050 | $995 | $0.95 | 23d | 1 | 1.30mi |
| 1733 Swann St Fayetteville, NC | 4.0 | 2.5 | 1894 | $1,850 | $0.98 | 23d | 1 | 1.31mi |
| 1909 Tryon Dr #7 Fayetteville, NC | 2.0 | 2.0 | 1060 | $1,050 | $0.99 | 23d | 1 | 1.32mi |
| 1849 Tryon Dr Fayetteville, NC | 2.0 | 2.0 | 1061 | $998 | $0.94 | 23d | 2 | 1.35mi |
| 4310 Coolidge St Fayetteville, NC | 3.0 | 1.5 | 1212 | $1,250 | $1.03 | 14d | 1 | 1.35mi |
| 1937 Sardonyx Rd Fayetteville, NC | 2.0 | 2.0 | 1200 | $1,150 | $0.96 | 23d | 1 | 1.36mi |
| 1712 Scampton Dr Unit NA Fayetteville, NC | 3.0 | 2.0 | 1814 | $1,900 | $1.05 | 14d | 1 | 1.41mi |
| 1712 Scampton Dr Fayetteville, NC | 3.0 | 1.5 | 1814 | $2,000 | $1.10 | 23d | 1 | 1.41mi |
| 1130 Annondale Way Fayetteville, NC | 1.0–3.0 | 1.0–2.5 | 1180 | $2,495 | $2.11 | 14d | 6 | 1.43mi |
| 1276 N Forest Dr Fayetteville, NC | 2.0 | 2.5 | 1200 | $1,295 | $1.08 | 23d | 1 | 1.46mi |
| 1615 Morehead Ave Fayetteville, NC | 3.0 | 2.0 | 1073 | $1,400 | $1.30 | 23d | 1 | 1.47mi |
Listing history 50 events
-
2026-06-18days on market $140,000 Active 2 DOM
-
2026-06-17pricedays on market $140,000 Active 1 DOM
-
2026-05-31days on market $144,000 Active 120 DOM
-
2026-05-30days on market $144,000 Active 119 DOM
-
2026-05-13price $144,000
-
2026-05-01status Active
-
2026-04-13price $145,000
-
2026-04-03price $146,000
-
2026-03-24price $147,000
-
2026-03-05price $148,000
-
2026-02-17price $149,000
-
2026-01-30$150,000 Active
-
2025-09-22$150,000 Active
-
2025-02-27soldstatus $103,000
-
2025-02-25historical $1,500
-
2025-02-21$1,500
-
2025-02-19historical
-
2025-02-05price $135,000
-
2025-01-31price $125,000
-
2025-01-28price $135,000
-
2024-12-02price $145,000
-
2024-12-02price $145,000
-
2024-10-30price $155,000
-
2024-10-30price $155,000
-
2024-09-30price $165,000
-
2024-09-30price $165,000
-
2024-09-13price $145,000
-
2024-09-13price $145,000
-
2024-08-28price $150,000
-
2024-08-28price $150,000
-
2024-08-21price $160,000
-
2024-08-21price $160,000
-
2024-08-06price $165,000
-
2024-08-06price $165,000
-
2024-08-01price $125,000
-
2024-08-01price $125,000
-
2024-07-27price $129,900
-
2024-07-27price $129,900
-
2024-07-20price $142,900
-
2024-07-20price $142,900
-
2024-07-16price $135,000
-
2024-07-16price $135,000
-
2024-07-11price $145,000
-
2024-07-11price $145,000
-
2024-07-02price $151,900
-
2024-07-02price $151,900
-
2024-06-07price $140,000
-
2024-06-07price $140,000
-
2024-05-27price $150,000
-
2024-05-27price $150,000
ⓘ Source: listings_history table (triggers on properties + properties_extension) + one-shot
backfill from property_details.listing_events for pre-trigger history.
Tax reassessment forecast NC · Resets to sale price
- Current annual tax
- $1,431 · $119/mo
- Projected year-2 tax
- $1,431 · $119/mo
- Expected delta
- $0/yr ($0/mo · 0.0%)
ⓘ Screening estimate from a state-policy table — verify with the county assessor before closing.
Climate risk First Street
- Flood 1/10 Low FEMA zone X (unshaded) · 0% chance over 30 yrs
- Wildfire 4/10 Moderate
- Heat 7/10 Severe 7 d/yr ≥106°F today · 16 d/yr by 30 yrs out
- Wind 6/10 Major 74% chance of damaging wind over 30 yrs
- Air quality 2/10 Low 0 unhealthy d/yr today · 1 by 30 yrs out
Nearby sold comps map
Loading sold comps map…
Walkable amenities ~0.75 mi
Loading nearby amenities…
Taxation est. · year 1
- Rental income
- $18,544
- − Mortgage interest
- −$7,842
- − Property taxes
- −$1,431
- − Insurance
- −$700
- − Repairs & maintenance
- −$1,483
- − Management
- −$1,483
- − Depreciation
- −$4,073
- Taxable income
- $1,531
- Est. tax owed @ 24.0%
- −$367
- After-tax cash flow
- $3,341/yr
For passive investors: Depreciation is non-cash, so a rental often shows a tax loss while cash-flowing — sheltering income. Rental losses are passive: they offset passive income freely, and up to $25,000/yr can offset ordinary (W-2) income if you actively participate and your MAGI is under $100k (phasing out to $0 by $150k); unused losses carry forward. On sale, claimed depreciation is recaptured at up to 25%, and gains may owe capital-gains tax (a 1031 exchange can defer both). Figures are a year-1 estimate at your 24.0% rate — not tax advice; consult a CPA.
Schools (NCES district)
- District
- Cumberland County Schools
- NCES district ID
- 3700011
- Math proficiency
- 32% ▼ -2.00%
- Reading proficiency
- 41% ▼ -1.00%
- Median HH income
- $44,168
- Composite
- 31.0/100
- National rank
- #6096
- State rank
- #126 of 178 in NC
Livability — Fayetteville
- Score
- 75/100
- State rank
- #45
- US rank
- #4031
Category grades
Schools grade is shown separately in the Schools card above.
Census & demographics
- County
- Cumberland County · 265,314 people
- City population
- 226,118
- Metro
- Fayetteville, NC
- Population (ZIP)
- 36,629
- Household income
- $62,170
- Rent vs Own
- Severe rent burden
- 1645.0
Population outlook (Cumberland County) Hauer SSP2
- Today (2025)
- 330,855 people
- By 2030
- 333,523 · +0.8%
- By 2040
- 335,583 · +1.4%
- By 2050
- 335,325 · +1.4%
- By 2075
- 342,853 · +3.6%
- By 2100
- 340,698 · +3.0%
Race, ethnicity, and origin ACS 2023
- Neighborhood character
- Diverse neighborhood (Simpson 0.67)
- Race & ethnicity
- Black 42% White 38% Hispanic / Latino 9% Two or more races 8% Asian 3% Native American 1%
- Hispanic origin (detail)
- Mexican 3% Puerto Rican 4%
- Common ancestry
- Slovak 1% Lithuanian 1% Italian 1%
- Foreign-born
- 7% · Canada, South Korea, Jamaica
- Languages at home
- 89% English-only · Spanish 6% German/W. Germanic 1% Other Indo-European 1%
Political lean MEDSL · Cumberland
- 2024 margin
- D (+13.4) · D 56.1% · R 42.7% · Other 1.2%
- 2008→2024 swing
- -4.3pp toward R · 2008: 17.7pp · 2024: 13.4pp
- All cycles
- 2024: D+13.4 2020: D+16.6 2016: D+16.0 2012: D+19.7 2008: D+17.7
Not yet ingested
- Civics
- —
Market trends
- HPI YoY
- ▼ -45.88%
- Current HPI
- 203.0731
- Rent YoY
- ▲ 2.82%
- Metro
- Fayetteville, NC
- State GDP YoY
- ▲ 3.28%
- F500 in state
- 26
Industry mix (Fortune 500 HQ in NC)
| Industry | F500 HQs | Revenue |
|---|---|---|
| Financial Services | 2 | $213B |
|
||
| Retail | 2 | $95B |
|
||
| Industrial Conglomerate | 1 | $38B |
|
||
| Metals / Steel | 1 | $35B |
|
||
| Utilities | 1 | $30B |
|
||
| Industrial Machinery | 1 | $19B |
|
||
Price history
+800.0% since first listed65 events — show timeline
- 2026-05-13 Price Changed $144,000 LPRMLS
- 2026-05-01 Relisted — LPRMLS
- 2026-04-13 Price Changed $145,000 LPRMLS
- 2026-04-03 Price Changed $146,000 LPRMLS
- 2026-03-24 Price Changed $147,000 LPRMLS
- 2026-03-05 Price Changed $148,000 LPRMLS
- 2026-02-17 Price Changed $149,000 LPRMLS
- 2026-01-30 Listed $150,000 LPRMLS
- 2025-09-22 Listed $150,000 LPRMLS
- 2025-02-27 Sold (Public Records) $103,000 Public Records
- 2025-02-25 Rental Removed $1,500 TMLS
- 2025-02-21 Listed for Rent $1,500 TMLS
- 2025-02-19 Listing Removed — Hive MLS
- 2025-02-05 Price Changed $135,000 Hive MLS
- 2025-01-31 Price Changed $125,000 Hive MLS
- 2025-01-28 Price Changed $135,000 LPRMLS
- 2024-12-02 Price Changed $145,000 LPRMLS
- 2024-12-02 Price Changed $145,000 Hive MLS
- 2024-10-30 Price Changed $155,000 LPRMLS
- 2024-10-30 Price Changed $155,000 Hive MLS
- 2024-09-30 Price Changed $165,000 Hive MLS
- 2024-09-30 Price Changed $165,000 LPRMLS
- 2024-09-13 Price Changed $145,000 LPRMLS
- 2024-09-13 Price Changed $145,000 Hive MLS
- 2024-08-28 Price Changed $150,000 LPRMLS
- 2024-08-28 Price Changed $150,000 Hive MLS
- 2024-08-21 Price Changed $160,000 LPRMLS
- 2024-08-21 Price Changed $160,000 Hive MLS
- 2024-08-06 Price Changed $165,000 LPRMLS
- 2024-08-06 Price Changed $165,000 Hive MLS
- 2024-08-01 Price Changed $125,000 LPRMLS
- 2024-08-01 Price Changed $125,000 Hive MLS
- 2024-07-27 Price Changed $129,900 LPRMLS
- 2024-07-27 Price Changed $129,900 Hive MLS
- 2024-07-20 Price Changed $142,900 LPRMLS
- 2024-07-20 Price Changed $142,900 Hive MLS
- 2024-07-16 Price Changed $135,000 Hive MLS
- 2024-07-16 Price Changed $135,000 LPRMLS
- 2024-07-11 Price Changed $145,000 LPRMLS
- 2024-07-11 Price Changed $145,000 Hive MLS
- 2024-07-02 Price Changed $151,900 LPRMLS
- 2024-07-02 Price Changed $151,900 Hive MLS
- 2024-06-07 Price Changed $140,000 Hive MLS
- 2024-06-07 Price Changed $140,000 LPRMLS
- 2024-05-27 Price Changed $150,000 LPRMLS
- 2024-05-27 Price Changed $150,000 Hive MLS
- 2024-05-27 Price Changed $160,000 Hive MLS
- 2024-05-21 Price Changed $160,000 LPRMLS
- 2024-05-13 Price Changed $170,000 LPRMLS
- 2024-05-13 Price Changed $170,000 Hive MLS
- 2024-05-07 Price Changed $175,000 LPRMLS
- 2024-05-06 Listed $175,000 Hive MLS
- 2024-05-05 Listed $180,000 LPRMLS
- 2023-05-09 Sold (Public Records) $8,000 Public Records
- 2023-05-09 Sold (MLS) $8,000 AMLSNC
- 2023-05-09 Sold (MLS) $8,000 TMLS
- 2023-04-27 Pending — TMLS
- 2022-11-11 Relisted — TMLS
- 2022-10-25 Pending — TMLS
- 2022-09-13 Listed $11,500 AMLSNC
- 2022-09-13 Listed $11,500 TMLS
- 2022-09-06 Listing Removed — TMLS
- 2022-06-04 Listed $13,000 TMLS
- 2014-09-03 Sold (Public Records) $20,000 Public Records
- 2006-07-12 Sold (Public Records) $16,000 Public Records
Property tax history
+148.6%/yrLatest (2025): $1,431 · +3718.6% YoY. Source: county tax records.
Cash-flow waterfall
monthlySold comps — $/sqft
last 12 mo · ≤1 miLoading sold comps…