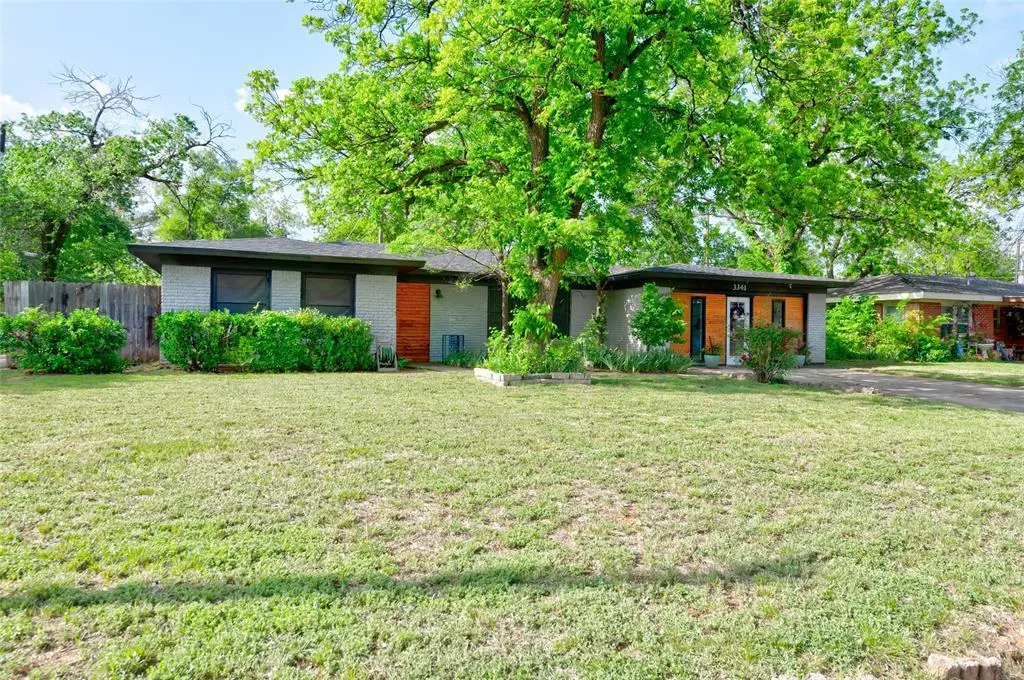
3341 Rosedale Dr · Abilene, TX
Flood risk 1/10 · Minimal
- FEMA flood zone
- AE
- Chance of flooding over 30 yrs
- 0.0%
- Est. flood insurance / yr
- $1,737 – $8,500
Fire risk 1/10 · Minimal
- Est. fire insurance / yr
- $1,222 – $2,270
Heat risk 7/10 · Major
- Hot days now (above 103°F)
- 7 days/yr
- Hot days in 30 yrs
- 23 days/yr
Wind risk 4/10 · Minor
- Chance of severe wind over 30 yrs
- 11.0%
Air-quality risk 1/10 · Minimal
- Unhealthy air days now
- 0 days/yr
- Unhealthy air days in 30 yrs
- 0 days/yr
Risk factors via First Street. Map © Google.
Why this score? — see what drove the D grade
The composite is a weighted blend of 9 inputs, each scored 0–100. Each bar is that input's sub-score; the figure is the points it added to the 100-point composite (weight × sub-score).
- Cash flow +16.0/30.0
- DSCR +5.0/10.0
- Rent growth +5.0/5.0
- ARV discount +4.8/15.0
- 1% rule +4.2/10.0
- Livability +3.8/5.0
- Schools +2.8/10.0
- Condition / age +2.5/5.0
- Appreciation +0.0/10.0
$282,000
🖨 Deal sheet 📄 Offer letter ✓ Due diligence
Listing remarks MLS
Spacious home with 3 bedrooms, 1.5 baths and 2 living areas. Needs some updating - but PRICE IS RIGHT! Located on lovely quite street, lot has mature landscaping. Home has large covered patio and storage shed.
Key facts
- Outstanding location
- 8,276 sq ft lot
- Built 1956
Tags
Property features AI
Finance
- Other: Exclusions: trampoline, washer and dryer; Possession typically 30–60 days or negotiable
- Financial info: Listing terms include Cash, Conventional, FHA, and VA loan; No second mortgage reported
- HOA & community: No association (no HOA)
Exterior
- Parking: Driveway parking; Other parking features; No garage or carport spaces
- Security: Carbon monoxide detector(s)
- Utilities: City water; City sewer; No municipal utility district
- Home design: Single-family residence; Residential property; Attached property
- Construction: Built in 1956; Composition roof
- Exterior features: Lot under 0.5 acre (approximately 0.19 acres); Subdivision: Wychwood; Directions: Exit off of Winters Freeway on South 14th; head east on S 14th, right into Willis Street, right onto S 20th St., right onto Ivanhoe Lane, left onto Rosedale Drive
Interior
- Kitchen: Breakfast bar; Built-in cabinets; Dishwasher; Disposal
- Bedrooms: 4 bedrooms (all on main level)
- Flooring: Vinyl flooring
- Bathrooms: 2 full bathrooms
- Heating & cooling: Central heating; Central air; Ceiling fan(s)
- Interior features: Built-in features; High-speed internet available; 6 total rooms; 1 living area; 1 dining area; One-level layout
- Laundry & utility: Washer hookup (washer/dryer excluded from sale)
Neighborhood map
What this means for you Summary
Snapshot
- This is a 3-bed/2.0-bath single-family listed at $282k.
Deal economics
- At list price, monthly cash flow is $-285 ($-3k/yr) — negative.
- To cash-flow at today's rent, offer at most $232k (17.8% below list).
- To meet the 1% rule (rent ≥ 1% of price), the offer needs to be $258k (8.4% below list).
- Recommended offer: $232k (17.8% below list) — sets the bar for cash-flow.
Location & tenants
- Location reads 75/100 on livability (#142 in TX, #4,037 nationally) — a middle-class / working-renter tenant base. Strengths: cost of living A+, housing A+, health & safety A+; Watch: crime D, commute F.
- Abilene ISD (urban): math 32% / reading 34% proficiency, ranked #575 of 826 in TX (top 70%) — families likely to look elsewhere, expect single-tenant / working-renter base with shorter leases.
- Zoned schools: Austin El (math 48% / reading 49%, grade D, #950 of 4,322 statewide, top 22%, 724 students, 60% FRL) — zoned schools at 60% FRL track the district average.
- Zoned-school proficiency averages 48% at this address vs 33% district-wide (+16 pts) — the actual schools serving this property are materially stronger than the Abilene ISD average implies; a family-tenant draw the district grade alone would hide.
- Market conditions: Rents rising fast (+32.1%/yr); 109 active listings in the ZIP; 9 comparable units currently listed for rent nearby; rentals at typical pace (median 21d on market — plan ~3-4 weeks tenant-placement turnaround); 508 units permitted in Taylor County in 2024 (0 in 5+ unit buildings).
- At $2,585/mo this rent would consume 49% of the median local household income ($63k/yr) (locally 1096% of renters already pay >50% of income on rent) — very limited rent-growth headroom before tenants either downsize or default.
Forward outlook
- Local home prices are declining (-3.0%/yr); year-one equity from $2k of loan paydown is wiped out by about $8k of value loss. Plan a longer hold.
- Taylor County population projected at +16% by 2050 — long-run rental-demand tailwind backs the buy-and-hold thesis.
Negotiation context
- Only 14 days on market — expect competitive offers; lowballing is unlikely to land.
- 3 sale attempts since 17y ago with the ask held roughly flat each time — persistent listings suggest the price (not the market) is what's stuck; bring a comps-based counter.
Risks & watch-outs
- Watch-outs: flood insurance adds $427/mo; built in 1956 — expect roof / HVAC / electrical / plumbing capex.
- Climate carrying-cost: in FEMA flood zone AE (mandatory federal flood insurance); extreme-heat days projected 7→23/yr by 2055 (HVAC capex compounding) — expect insurance premiums to compound above CPI over the hold.
Questions for the listing agent
- What do current leases actually rent for vs. the listed asking? Can we see a recent rent roll and the last 12 months of T-12 income?
- Built in 1956 — when were the roof, HVAC, electrical panel, plumbing, and water heater last replaced?
- What's the actual annual flood-insurance premium (NFIP or private), and is the property in a SFHA with mandatory coverage?
- Is there a deadline driving the sale (1031 exchange, divorce, estate, relocation)? That informs how much negotiation room exists.
- Schools are D-rated, which usually means shorter tenancies and higher turnover. Who's the typical renter profile here, and what's been the actual vacancy rate?
- Crime grade is D in this area — have there been break-ins, vandalism, or insurance claims at this property in the last 3 years? What carrier currently insures it and at what premium?
- The area grade is low — what's the realistic commute time and amenity access for the typical tenant pool here? Any planned neighborhood developments (good or bad) we should know about?
- What's the average days-on-market for RENTAL listings here right now (not sales)? A rising rental-DOM trend means longer vacancies and softer asking-rent achievability than the comps imply.
- What's the recent tenant-quality profile in this submarket — average credit score on applications, eviction rate, late-payment / NSF rate, and stable-employment percentage? A property-management company in the area should have these aggregated.
- How much new for-sale + rental construction is in the pipeline within 1–3 miles? Heavy new supply typically softens prices + rents 12–24 months out; constrained supply supports both.
Investment metrics
- 1% rule
- 0.92% ✗
- Cap rate
- 6.90%
- Cash-on-cash
- 2.15%
- DSCR
- 1.10
- GRM
- 9.1
CMA / ARV
- ARV (on-the-fly)
- $266,062
- Comps found
- 12
Show comp detail 12 sales within ~0.75 mi
| Address | Dist | Beds/Ba | Sqft | Sold | Price | $/sf | Match |
|---|---|---|---|---|---|---|---|
| 3340 S 21st St | 0.09mi | 3/2.0 | 1,728 (-2%) | 2mo | $225,000 | $130 | 91 |
| 3309 S 21st St | 0.14mi | 3/2.0 | 1,650 (-6%) | 3mo | $249,000 | $151 | 80 |
| 2117 Regent Dr | 0.35mi | 3/2.0 | 1,859 (+6%) | 1mo | $295,000 | $159 | 74 |
| 125 Circle Of Holly | 0.36mi | 3/2.5 | 1,845 (+5%) | 4mo | $305,000 | $165 | 70 |
| 3617 S 20th St | 0.37mi | 4/2.0 (+1) | 1,622 (-8%) | 3mo | $210,000 | $129 | 61 |
| 2502 Marshall St | 0.72mi | 3/3.0 | 1,763 (+0%) | 2mo | $269,900 | $153 | 61 |
| 2833 Shepherd St | 0.73mi | 3/2.0 | 1,704 (-3%) | 0mo | $239,900 | $141 | 60 |
| 3610 Brook Hollow Dr | 0.65mi | 3/2.0 | 1,665 (-6%) | 1mo | $263,900 | $158 | 60 |
| 2926 S 23rd St | 0.53mi | 4/1.0 (+1) | 1,624 (-8%) | 0mo | $189,900 | $117 | 53 |
| 2234 Brentwood Dr | 0.68mi | 3/2.0 | 1,920 (+9%) | 1mo | $199,900 | $104 | 52 |
| 1358 Marshall St | 0.74mi | 3/2.5 | 1,680 (-5%) | 4mo | $257,000 | $153 | 52 |
| 1326 Glenwood Dr | 0.51mi | 2/2.0 (-1) | 1,524 (-14%) | 3mo | $224,900 | $148 | 46 |
Match score weights: distance 35% · size 25% · config 20% · recency 20%. Top-matched comps best support the ARV.
Projected returns pro-forma
-3.0% appreciation · 8.0% rent growth · sell at horizon
- IRR
- -17.0%
- Equity multiple
- 0.37×
- Total profit
- $-49,907
- Equity at exit
- $42,047
- IRR
- -0.5%
- Equity multiple
- 0.96×
- Total profit
- $-3,550
- Equity at exit
- $24,382
Cash invested: $78,960 (down + closing). Projections, not guarantees.
Landlord ↔ Tenant lean methodology
- Overall (STATE)
- 87 Strongly Landlord-Friendly
- State Texas
- 87 Strongly Landlord-Friendly · R+5
- County
- — inherits STATE
- City
- — inherits STATE
ZIP-level market 79605
- Rents YoY
- 32.1%
- Active inventory
- 109
- Price-to-rent
- 9.1×
Monthly cashflow live
- Estimated rent
- $2,585 high interval (Pro) →
- Mortgage (P&I)
- −$1,479
- Tax from tax record
- −$304 /mo · $3,645/yr
- Insurance
- −$118
- Flood insurance flood zone
- −$427 /mo · $5,118/yr
- HOA
- −$0
- Vacancy / Maint / Mgmt
- −$543
- Net cashflow
- $-285
Break-even live
UW: 25.0% down · 7.5% · 30yr · 1.5% tax · 5.0% vac · 8.0% maint · 8.0% mgmt
Financing live
Cash to close
- Down payment
- $70,500
- Closing costs
- $8,460
- Reserves months
- —
- Total cash needed
- —
Loan-product check · same deal, 3 products live
Conventional
25% down · 7.5% · 30yr
- Down + closing
- —
- Monthly P&I
- —
- Monthly cashflow
- —
- DSCR
- —
- Eligible?
- —
Personal DTI + credit; lowest rate.
DSCR
20% down · 8.5% · 30yr
- Down + closing
- —
- Monthly P&I
- —
- Monthly cashflow
- —
- DSCR
- —
- Eligible?
- —
No personal income docs; deal must DSCR.
Hard money
10% down · 12.0% · 12mo
- Down + closing
- —
- Monthly P&I
- —
- Monthly cashflow
- —
- DSCR
- —
- Eligible?
- —
Short-term bridge; refi at stabilization.
Rent comps 9 comps
| Address | Beds | Baths | Sqft | Rent | $/sqft | DOM | Units | Dist |
|---|---|---|---|---|---|---|---|---|
| 3173 Hunt St Abilene, TX | 3.0 | 1.5 | 1300 | $2,250 | $1.73 | 43d | 1 | 0.27mi |
| 3373 S 27th St Abilene, TX | 2.0 | 2.0 | 1436 | $1,700 | $1.18 | 43d | 1 | 0.59mi |
| 2301 Post Oak Rd Abilene, TX | 3.0 | 2.0 | 1915 | $3,295 | $1.72 | 20d | 1 | 0.72mi |
| 2402 S 20th St Abilene, TX | 2.0 | 1.0 | 2040 | $1,400 | $0.69 | 20d | 1 | 0.76mi |
| 3409 High Meadows Dr Abilene, TX | 3.0 | 2.0 | 1987 | $2,995 | $1.51 | 20d | 1 | 0.82mi |
| 25 Juniper Cir Abilene, TX | 4.0 | 3.0 | 2557 | $3,500 | $1.37 | 43d | 1 | 0.84mi |
| 2601 Edgemont Dr Abilene, TX | 2.0 | 2.0 | 1624 | $2,495 | $1.54 | 20d | 1 | 1.02mi |
| 1349 Meander St Abilene, TX | 3.0 | 1.0 | 1532 | $3,800 | $2.48 | 13d | 1 | 1.25mi |
| 2929 Sayles Blvd Abilene, TX | 4.0 | 2.0 | 2384 | $6,000 | $2.52 | 13d | 1 | 1.27mi |
Listing history 13 events
-
2026-05-01status Pending
-
2026-04-21historical Active Option Contract
-
2026-04-11$282,000 Active
-
2021-08-25soldstatus
-
2020-08-21soldstatus
-
2020-03-30historical
-
2020-01-27$164,900 Active
-
2009-07-26soldstatus 210-char remark
Show marketing remark (210 chars)
Spacious home with 3 bedrooms, 1.5 baths and 2 living areas. Needs some updating - but PRICE IS RIGHT! Located on lovely quite street, lot has mature landscaping. Home has large covered patio and storage shed.
-
2009-07-08historical 210-char remark
Show marketing remark (210 chars)
Spacious home with 3 bedrooms, 1.5 baths and 2 living areas. Needs some updating - but PRICE IS RIGHT! Located on lovely quite street, lot has mature landscaping. Home has large covered patio and storage shed.
-
2009-07-06soldstatus
-
2009-06-25$79,900 210-char remark
Show marketing remark (210 chars)
Spacious home with 3 bedrooms, 1.5 baths and 2 living areas. Needs some updating - but PRICE IS RIGHT! Located on lovely quite street, lot has mature landscaping. Home has large covered patio and storage shed.
-
2005-09-19soldstatus
-
2001-05-18soldstatus
ⓘ Source: listings_history table (triggers on properties + properties_extension) + one-shot
backfill from property_details.listing_events for pre-trigger history.
Tax reassessment forecast TX · Resets to sale price
- Current annual tax
- $3,645 · $304/mo
- Projected year-2 tax
- $5,161 · $430/mo
- Expected delta
- +$1,516/yr (+$126/mo · 41.6%)
ⓘ Screening estimate from a state-policy table — verify with the county assessor before closing.
Climate risk First Street
- Flood 1/10 Low FEMA zone AE · 0% chance over 30 yrs
- Wildfire 1/10 Low
- Heat 7/10 Severe 7 d/yr ≥103°F today · 23 d/yr by 30 yrs out
- Wind 4/10 Moderate 11% chance of damaging wind over 30 yrs
- Air quality 1/10 Low 0 unhealthy d/yr today · 0 by 30 yrs out
Nearby sold comps map
Loading sold comps map…
Walkable amenities ~0.75 mi
Loading nearby amenities…
Taxation est. · year 1
- Rental income
- $31,014
- − Mortgage interest
- −$15,796
- − Property taxes
- −$3,645
- − Insurance
- −$6,529
- − Repairs & maintenance
- −$2,481
- − Management
- −$2,481
- − Depreciation
- −$8,204
- Taxable loss
- −$8,121
- Est. tax savings @ 24.0%
- +$1,949
- After-tax cash flow
- $-1,469/yr
For passive investors: Depreciation is non-cash, so a rental often shows a tax loss while cash-flowing — sheltering income. Rental losses are passive: they offset passive income freely, and up to $25,000/yr can offset ordinary (W-2) income if you actively participate and your MAGI is under $100k (phasing out to $0 by $150k); unused losses carry forward. On sale, claimed depreciation is recaptured at up to 25%, and gains may owe capital-gains tax (a 1031 exchange can defer both). Figures are a year-1 estimate at your 24.0% rate — not tax advice; consult a CPA.
Schools (NCES district)
- District
- Abilene ISD
- NCES district ID
- 4807440
- Math proficiency
- 32% ▼ -11.00%
- Reading proficiency
- 34% ▼ -5.00%
- Median HH income
- $39,782
- Composite
- 27.71/100
- National rank
- #6909
- State rank
- #575 of 826 in TX
Livability — Abilene
- Score
- 75/100
- State rank
- #142
- US rank
- #4037
Category grades
Schools grade is shown separately in the Schools card above.
Census & demographics
- Census place
- Abilene, TX
- County
- Taylor County · 136,672 people
- City population
- 136,672
- Metro
- Abilene, TX
- Population (ZIP)
- 28,467
- Household income
- $62,929
- Rent vs Own
- Severe rent burden
- 1096.0
Population outlook (Taylor County) Hauer SSP2
- Today (2025)
- 145,270 people
- By 2030
- 150,050 · +3.3%
- By 2040
- 159,417 · +9.7%
- By 2050
- 168,883 · +16.3%
- By 2075
- 194,436 · +33.8%
- By 2100
- 203,163 · +39.9%
Race, ethnicity, and origin ACS 2023
- Neighborhood character
- Majority White (63%)
- Race & ethnicity
- White 63% Hispanic / Latino 22% Two or more races 12% Black 8% Asian 2%
- Hispanic origin (detail)
- Mexican 19%
- Common ancestry
- Slovak 2% Lithuanian 1% Serbian 1%
- Foreign-born
- 6% · Canada
- Languages at home
- 84% English-only · Spanish 14% German/W. Germanic 1% Other Asian/Pacific 0%
Political lean MEDSL · Taylor
- 2024 margin
- Solid R (+49.8) · D 24.6% · R 74.4% · Other 1.0%
- 2008→2024 swing
- -4.2pp toward R · 2008: -45.6pp · 2024: -49.8pp
- All cycles
- 2024: R+49.8 2020: R+45.3 2016: R+51.1 2012: R+53.6 2008: R+45.6
Not yet ingested
- Civics
- —
Market trends
- HPI YoY
- ▼ -181.75%
- Current HPI
- 201.2341
- Rent YoY
- ▲ 32.08%
- Metro
- Abilene, TX
- State GDP YoY
- ▲ 3.95%
- F500 in state
- 110
Industry mix (Fortune 500 HQ in TX)
| Industry | F500 HQs | Revenue |
|---|---|---|
| Energy | 16 | $1,198B |
|
||
| Technology | 5 | $198B |
|
||
| Engineering / Construction | 4 | $72B |
|
||
| Energy Services | 3 | $60B |
|
||
| Utilities | 3 | $41B |
|
||
| Healthcare | 2 | $330B |
|
||
Price history
+252.9% since first listed13 events — show timeline
- 2026-05-01 Pending — NTREIS
- 2026-04-21 Contingent — NTREIS
- 2026-04-11 Listed $282,000 NTREIS
- 2021-08-25 Sold (Public Records) — Public Records
- 2020-08-21 Sold (Public Records) — Public Records
- 2020-03-30 Listing Removed — NTREIS
- 2020-01-27 Listed $164,900 NTREIS
- 2009-07-26 Sold (MLS) — NTREIS
- 2009-07-08 Listing Removed — NTREIS
- 2009-07-06 Sold (Public Records) — Public Records
- 2009-06-25 Listed $79,900 NTREIS
- 2005-09-19 Sold (Public Records) — Public Records
- 2001-05-18 Sold (Public Records) — Public Records
Property tax history
+5.0%/yrLatest (2025): $3,645 · +8.3% YoY. Source: county tax records.
Cash-flow waterfall
monthlySold comps — $/sqft
last 12 mo · ≤1 miLoading sold comps…