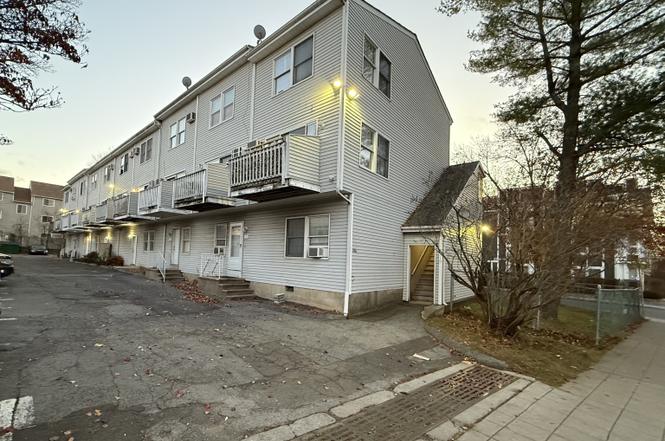
186 Stillwater Ave Apt 129 · Stamford, CT
Flood risk No data
- FEMA flood zone
- —
- Chance of flooding over 30 yrs
- —
- Est. flood insurance / yr
- —
Fire risk No data
- Est. fire insurance / yr
- —
Heat risk No data
- Hot days now (above threshold)
- —
- Hot days in 30 yrs
- —
Wind risk No data
- Chance of severe wind over 30 yrs
- —
Air-quality risk No data
- Unhealthy air days now
- —
- Unhealthy air days in 30 yrs
- —
Risk factors via First Street. Map © Google.
Why this score? — see what drove the B- grade
The composite is a weighted blend of 9 inputs, each scored 0–100. Each bar is that input's sub-score; the figure is the points it added to the 100-point composite (weight × sub-score).
- Cash flow +27.3/30.0
- DSCR +9.5/10.0
- 1% rule +9.1/10.0
- ARV discount +7.5/15.0
- Schools +3.5/10.0
- Livability +3.5/5.0
- Rent growth +3.0/5.0
- Condition / age +2.5/5.0
- Appreciation +0.0/10.0
$212,000
🖨 Deal sheet 📄 Offer letter ✓ Due diligence
Listing remarks
Opportunity awaits in this Liberty Square 2-bedroom apartment located in western Stamford. This unit is a fixer-upper, offering great potential for buyers looking to renovate and add value. With a functional layout, spacious rooms, and excellent proximity to shopping, public transportation, Downtown Stamford, and major highways, the location adds tremendous appeal. This property is being sold as-is and is subject to short sale approval, making it an ideal opportunity for investors or handy buyers ready to bring their vision to life.
Key facts
- Spacious rooms
- Excellent proximity
- Shopping
Tags
Neighborhood map
What this means for you Summary
Snapshot
- This is a 2-bed/1.5-bath condo listed at $212k.
Deal economics
- At list price, monthly cash flow is $613 ($7k/yr) — positive.
- The deal already cash-flows at list — no discount required.
- Meets the 1% rule at list price ($3k rent vs $212k).
- Cap rate 9.8% vs local median 3.0% in Stamford — top-decile yield for the area; either an underpriced asset or a hidden risk that comps aren't pricing in. Stress-test before assuming the spread holds.
Location & tenants
- Location reads 70/100 on livability (#98 in CT) — a middle-class / working-renter tenant base. Strengths: employment A+, health & safety A+, crime A-; Watch: amenities F, commute F, cost of living F.
- Stamford School District (urban): math 32% / reading 43% proficiency, ranked #103 of 153 in CT (top 67%) — families likely to look elsewhere, expect single-tenant / working-renter base with shorter leases.
- Market conditions: Rents rising (+1.9%/yr); 188 active listings in the ZIP; 40 comparable units currently listed for rent nearby; rentals at typical pace (median 15d on market — plan ~3-4 weeks tenant-placement turnaround); solid renter incomes; 1,151 units permitted in Western Connecticut Planning Region in 2024 (714 in 5+ unit buildings).
- This rent runs 38% of the median local income ($95k/yr) — at the standard rent-burdened threshold; future hikes will face affordability resistance.
Forward outlook
- Local home prices are declining (-3.0%/yr); year-one equity from $1k of loan paydown is wiped out by about $6k of value loss. Plan a longer hold.
Negotiation context
- Only 4 days on market — expect competitive offers; lowballing is unlikely to land.
- Current owner paid $140k; list at $212k implies a 52% gain — meaningful room to come down on a strong offer.
Questions for the listing agent
- What does the HOA fee cover, when was the last increase, and are there any pending special assessments or reserve-fund shortfalls?
- Any open or pending special assessments — roof, HVAC, plumbing, elevator, façade? What's the per-unit balance and payoff schedule, and is the seller paying it off at close or rolling it to the buyer?
- Is there a deadline driving the sale (1031 exchange, divorce, estate, relocation)? That informs how much negotiation room exists.
- Schools are B-rated — typically a magnet for longer-tenancy family renters. What's the average tenant stay here, and is there a school-zone premium baked into asking?
- What's the average days-on-market for RENTAL listings here right now (not sales)? A rising rental-DOM trend means longer vacancies and softer asking-rent achievability than the comps imply.
- What's the recent tenant-quality profile in this submarket — average credit score on applications, eviction rate, late-payment / NSF rate, and stable-employment percentage? A property-management company in the area should have these aggregated.
- How much new apartment / multifamily construction is in the pipeline within 1–3 miles? Heavy new supply (>2% of stock underway) typically softens rents 12–24 months out; light construction supports rent growth.
Investment metrics
- 1% rule
- 1.41% ✓
- Cap rate
- 9.76%
- Cash-on-cash
- 12.39%
- DSCR
- 1.55
- GRM
- 5.9
CMA / ARV
No comps found within radius.
Projected returns pro-forma
-3.0% appreciation · 1.95% rent growth · sell at horizon
- IRR
- 0.8%
- Equity multiple
- 1.03×
- Total profit
- $1,781
- Equity at exit
- $31,610
- IRR
- 9.3%
- Equity multiple
- 1.68×
- Total profit
- $40,155
- Equity at exit
- $18,330
Cash invested: $59,360 (down + closing). Projections, not guarantees.
Landlord ↔ Tenant lean methodology
- Overall (STATE)
- 27 Tenant-Leaning
- State Connecticut
- 27 Tenant-Leaning · D+7
- County
- — inherits STATE
- City
- — inherits STATE
ZIP-level market 06902
- Rents YoY
- 1.9%
- Active inventory
- 188
- Price-to-rent
- 5.9×
Monthly cashflow live
- Estimated rent
- $2,990 high interval (Pro) →
- Mortgage (P&I)
- −$1,112
- Tax from tax record
- −$249 /mo · $2,988/yr
- Insurance
- −$88
- HOA
- −$300
- Vacancy / Maint / Mgmt
- −$628
- Net cashflow
- $613
Break-even live
UW: 25.0% down · 7.5% · 30yr · 1.5% tax · 5.0% vac · 8.0% maint · 8.0% mgmt
Financing live
Cash to close
- Down payment
- $53,000
- Closing costs
- $6,360
- Reserves months
- —
- Total cash needed
- —
Loan-product check · same deal, 3 products live
Conventional
25% down · 7.5% · 30yr
- Down + closing
- —
- Monthly P&I
- —
- Monthly cashflow
- —
- DSCR
- —
- Eligible?
- —
Personal DTI + credit; lowest rate.
DSCR
20% down · 8.5% · 30yr
- Down + closing
- —
- Monthly P&I
- —
- Monthly cashflow
- —
- DSCR
- —
- Eligible?
- —
No personal income docs; deal must DSCR.
Hard money
10% down · 12.0% · 12mo
- Down + closing
- —
- Monthly P&I
- —
- Monthly cashflow
- —
- DSCR
- —
- Eligible?
- —
Short-term bridge; refi at stabilization.
Rent comps 40 comps
| Address | Beds | Baths | Sqft | Rent | $/sqft | DOM | Units | Dist |
|---|---|---|---|---|---|---|---|---|
| 22 Leslie St #3 Stamford, CT | 2.0 | 1.0 | 700 | $2,600 | $3.71 | 43d | 1 | 0.15mi |
| 1 Birch Dr Unit 38 Stamford, CT | 1.0 | 1.0 | 675 | $2,295 | $3.40 | 43d | 1 | 0.31mi |
| 29 Wilson St Unit 3 Stamford, CT | 1.0 | 1.0 | 600 | $1,900 | $3.17 | 19d | 1 | 0.35mi |
| 37 Rose Park Ave Stamford, CT | 2.0 | 1.0 | 900 | $2,100 | $2.33 | 14d | 1 | 0.38mi |
| 9 W Main St Stamford, CT | 2.0 | 1.0–2.0 | 739 | $3,439 | $4.65 | 3d | 1 | 0.40mi |
| 105 Richmond Hill Ave #2 Stamford, CT | 2.0 | 1.5 | 810 | $2,800 | $3.46 | 43d | 1 | 0.41mi |
| 37 Greenwich Ave Unit 2-6 Stamford, CT | 2.0 | 1.0 | 1115 | $2,600 | $2.33 | 43d | 1 | 0.42mi |
| 25 Main St Apt 3 Stamford, CT | 1.0 | 1.0 | 525 | $1,850 | $3.52 | 23d | 1 | 0.47mi |
| 75 Tresser Blvd Stamford, CT | 2.0 | 1.0–2.0 | 870 | $4,271 | $4.91 | 2d | 21 | 0.55mi |
| 81 Tresser Blvd Unit 1547625P Stamford, CT | 1.0 | 1.0 | 850 | $6,099 | $7.18 | 14d | 1 | 0.56mi |
| 74 Myano Ln Unit 1 Stamford, CT | 2.0 | 1.0 | 1000 | $2,500 | $2.50 | 23d | 1 | 0.57mi |
| 14 Relay Pl Unit R3 Stamford, CT | 2.0 | 1.0 | 1100 | $2,450 | $2.23 | 43d | 1 | 0.57mi |
| 14 Southwood Dr Stamford, CT | 1.0–2.0 | 1.0–2.0 | 801 | $2,800 | $3.49 | 3d | 4 | 0.59mi |
| 47 Whitmore Ln Apt 1 Stamford, CT | 2.0 | 1.0 | 1080 | $2,400 | $2.22 | 23d | 1 | 0.59mi |
| 1011 Washington Blvd Stamford, CT | 2.0 | 1.0–2.0 | 883 | $4,351 | $4.92 | 3d | 20 | 0.61mi |
| 100 Tresser Blvd Stamford, CT | 3.0 | 1.0–2.0 | 1090 | $7,230 | $6.63 | 1d | 11 | 0.63mi |
| 15 Renwick St #2 Stamford, CT | 2.0 | 1.5 | 1064 | $2,750 | $2.58 | 43d | 1 | 0.63mi |
| 66 Summer St Stamford, CT | 1.0–2.0 | 1.0–2.0 | 889 | $4,254 | $4.78 | 3d | 15 | 0.67mi |
| 1340 Washington Blvd Stamford, CT | 1.0–2.0 | 1.0–2.0 | 969 | $3,789 | $3.91 | 11d | 11 | 0.68mi |
| 20 North St Unit 11-2 Stamford, CT | 1.0 | 1.0 | 596 | $2,000 | $3.36 | 14d | 1 | 0.68mi |
| 140 Summer St Unit 1A Stamford, CT | 1.0 | 1.0 | 816 | $2,350 | $2.88 | 43d | 1 | 0.70mi |
| 184 Summer St Stamford, CT | 2.0 | 1.0–2.5 | 901 | $4,434 | $4.92 | 2d | 18 | 0.70mi |
| 184 Summer St Stamford, CT | 3.0 | 1.0–2.5 | 1138 | $3,588 | $3.15 | 43d | 18 | 0.70mi |
| 1450 Washington Blvd Stamford, CT | 3.0 | 1.0–2.5 | 1188 | $3,600 | $3.03 | 23d | 1 | 0.70mi |
| 405 Atlantic St Stamford, CT | 2.0 | 1.0–2.0 | 818 | $4,739 | $5.79 | 2d | 18 | 0.71mi |
| 191 Summer St Unit 3 Stamford, CT | 1.0 | 1.0 | 700 | $2,500 | $3.57 | 43d | 1 | 0.73mi |
| 51 Bank St Unit 2C Stamford, CT | 1.0 | 1.0 | 750 | $2,095 | $2.79 | 3d | 1 | 0.73mi |
| 22 Orchard St Unit 1 Stamford, CT | 2.0 | 1.0 | 725 | $2,400 | $3.31 | 3d | 1 | 0.74mi |
| 355 Atlantic St Stamford, CT | 2.0 | 1.0–2.0 | 840 | $4,479 | $5.33 | 3d | 13 | 0.75mi |
| 460 Summer St Ste 310 Stamford, CT | 1.0 | 1.0 | 550 | $2,400 | $4.36 | 3d | 1 | 0.76mi |
| 460 Summer St Unit 500 Stamford, CT | 1.0 | 1.0 | 550 | $2,425 | $4.41 | 14d | 1 | 0.76mi |
| 401 Atlantic St Unit 17f Stamford, CT | 1.0 | 1.0 | 754 | $2,497 | $3.31 | 43d | 1 | 0.76mi |
| 1455 Washington Blvd Stamford, CT | 1.0–2.0 | 1.0–2.0 | 1041 | $4,047 | $3.89 | 3d | 8 | 0.77mi |
| 1 Atlantic St Unit 609 Stamford, CT | 1.0 | 1.0 | 600 | $2,284 | $3.81 | 43d | 1 | 0.78mi |
| 104 North St #604 Stamford, CT | 2.0 | 2.0 | 1116 | $2,950 | $2.64 | 43d | 1 | 0.78mi |
| 104 North St #604 Stamford, CT | 2.0 | 2.0 | 1116 | $3,000 | $2.69 | 14d | 1 | 0.78mi |
| 1525 E Putnam Ave #407 Old Greenwich, CT | 1.0 | 1.0 | 676 | $2,590 | $3.83 | 11d | 1 | 0.79mi |
| 485 Summer St Unit 307 Stamford, CT | 1.0 | 1.0 | 619 | $2,200 | $3.55 | 23d | 1 | 0.80mi |
| 700 Summer St Stamford, CT | 1.0 | 1.0 | 739 | $2,300 | $3.11 | 3d | 3 | 0.82mi |
| 700 Summer St Unit 6C Stamford, CT | 1.0 | 1.0 | 900 | $2,950 | $3.28 | 43d | 1 | 0.82mi |
HOA detail condo
- Monthly dues
- $300 · $3,600/yr
- Assessments
- None detected in remarks — confirm with the listing agent.
Listing history 3 events
-
2025-12-13status Under Contract
-
2025-12-08$212,000 Active
-
1987-06-17soldstatus $139,900
ⓘ Source: listings_history table (triggers on properties + properties_extension) + one-shot
backfill from property_details.listing_events for pre-trigger history.
Tax reassessment forecast CT · Partial reset (capped growth)
- Current annual tax
- $2,988 · $249/mo
- Projected year-2 tax
- $3,762 · $314/mo
- Expected delta
- +$774/yr (+$65/mo · 25.9%)
ⓘ Screening estimate from a state-policy table — verify with the county assessor before closing.
Nearby sold comps map
Loading sold comps map…
Walkable amenities ~0.75 mi
Loading nearby amenities…
Taxation est. · year 1
- Rental income
- $35,879
- − Mortgage interest
- −$11,875
- − Property taxes
- −$2,988
- − Insurance
- −$1,060
- − Repairs & maintenance
- −$2,870
- − Management
- −$2,870
- − HOA
- −$3,600
- − Depreciation
- −$6,167
- Taxable income
- $4,448
- Est. tax owed @ 24.0%
- −$1,068
- After-tax cash flow
- $6,288/yr
For passive investors: Depreciation is non-cash, so a rental often shows a tax loss while cash-flowing — sheltering income. Rental losses are passive: they offset passive income freely, and up to $25,000/yr can offset ordinary (W-2) income if you actively participate and your MAGI is under $100k (phasing out to $0 by $150k); unused losses carry forward. On sale, claimed depreciation is recaptured at up to 25%, and gains may owe capital-gains tax (a 1031 exchange can defer both). Figures are a year-1 estimate at your 24.0% rate — not tax advice; consult a CPA.
Schools (NCES district)
- District
- Stamford School District
- NCES district ID
- 0904320
- Math proficiency
- 32% ▼ -10.00%
- Reading proficiency
- 43% ▼ -7.00%
- Median HH income
- $78,843
- Composite
- 35.14/100
- National rank
- #5010
- State rank
- #103 of 153 in CT
Livability — Stamford
- Score
- 70/100
- State rank
- #98
- US rank
- #7716
Category grades
Schools grade is shown separately in the Schools card above.
Census & demographics
- Census place
- Stamford, CT
- County
- Fairfield County · 765,532 people
- City population
- 123,058
- Metro
- Bridgeport-Stamford-Norwalk, CT
- Population (ZIP)
- 73,392
- Household income
- $94,843
- Rent vs Own
- Severe rent burden
- 4139.0
Population outlook (Western Connecticut County) Hauer SSP2
- By 2040
- 685,031
Race, ethnicity, and origin ACS 2023
- Neighborhood character
- Highly diverse neighborhood (Simpson 0.71)
- Race & ethnicity
- Hispanic / Latino 35% White 32% Black 23% Two or more races 13% Asian 7%
- Hispanic origin (detail)
- Mexican 3% Puerto Rican 4% Dominican 3%
- Common ancestry
- Hispanic 5% Romanian 3% Scotch-Irish 1%
- Foreign-born
- 36% · Canada, Jamaica, China
- Languages at home
- 51% English-only · Spanish 30% French/Haitian/Cajun 6% Other Indo-European 4%
Political lean MEDSL · Western Connecticut
- 2024 margin
- D (+19.1) · D 58.8% · R 39.7% · Other 1.6%
- All cycles
- 2024: D+19.1
Not yet ingested
- Civics
- —
Market trends
- HPI YoY
- ▼ -450.67%
- Current HPI
- 173.4108
- Rent YoY
- ▲ 1.95%
- Metro
- Bridgeport-Stamford-Norwalk, CT
- State GDP YoY
- ▲ 1.06%
- F500 in state
- 38
Industry mix (Fortune 500 HQ in CT)
| Industry | F500 HQs | Revenue |
|---|---|---|
| Industrial Machinery | 4 | $38B |
|
||
| Insurance | 3 | $71B |
|
||
| Financial Services | 2 | $25B |
|
||
| Transportation / Logistics | 2 | $18B |
|
||
| Healthcare | 1 | $247B |
|
||
| Telecommunications | 1 | $55B |
|
||
Price history
+51.5% since first listed3 events — show timeline
- 2025-12-13 Pending — Smart MLS
- 2025-12-08 Listed $212,000 Smart MLS
- 1987-06-17 Sold (Public Records) $139,900 Public Records
Property tax history
+1.8%/yrLatest (2022): $2,988 · +0.8% YoY. Source: county tax records.
Cash-flow waterfall
monthlySold comps — $/sqft
last 12 mo · ≤1 miLoading sold comps…