2608 Goldfinch Dr · Denton, TX
Flood risk No data
- FEMA flood zone
- —
- Chance of flooding over 30 yrs
- —
- Est. flood insurance / yr
- —
Fire risk No data
- Est. fire insurance / yr
- —
Heat risk No data
- Hot days now (above threshold)
- —
- Hot days in 30 yrs
- —
Wind risk No data
- Chance of severe wind over 30 yrs
- —
Air-quality risk No data
- Unhealthy air days now
- —
- Unhealthy air days in 30 yrs
- —
Risk factors via First Street. Map © Google.
Why this score? — see what drove the F grade
The composite is a weighted blend of 9 inputs, each scored 0–100. Each bar is that input's sub-score; the figure is the points it added to the 100-point composite (weight × sub-score).
- Cash flow +4.6/30.0
- Livability +4.4/5.0
- Schools +3.5/10.0
- Condition / age +2.5/5.0
- Rent growth +1.7/5.0
- ARV discount +1.4/15.0
- 1% rule +0.7/10.0
- DSCR +0.0/10.0
- Appreciation +0.0/10.0
$442,285
🖨 Deal sheet (PDF) 📄 Offer letter ✓ Due diligence
Listing remarks MLS
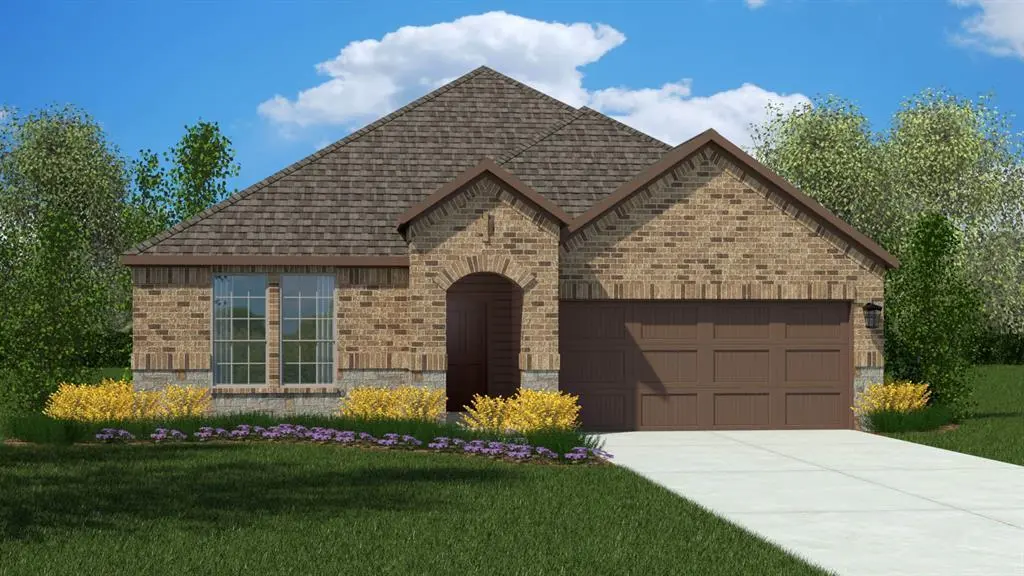
D.R. Horton is now selling in the new phase at their fabulous community of Eagle Creek in Denton and Denton ISD!! Gorgeous open concept single Story 4 bedroom, 2.5 bath Kingbird Floorplan-Elevation E, on North facing lot, with an estimated Summer completion. Large Chef's Kitchen with seating Island, Quartz countertops, Pendant lights, abundant Cabinets, tiled Backsplash, built-in stainless steel Appliances and wide Pantry. Spacious Living and luxurious main Bedroom at the rear of the Home with dual sink Vanity, over sized Shower, Linen Closet and walk-in Closet. Quartz Countertops in Kitchen and vanities in both Baths. Home includes America's Smart Home Technology bas package. High-efficiency SEER HVAC System, Tankless Water Heater, covered back Patio, full gutters, front Coach Lights, 6 foot fenced backyard, landscape Pkg with full Sprinkler System and more! Community Playground, Club House and Pool. Close proximity to Downtown Denton, UNT, TWU, The Square, Rayzor Ranch Town Center and Restaurants, I-35E & I-35W.
Key facts
- 6,512 sq ft lot
- 2 garage spots
- Community pool
Neighborhood map
What this means for you Summary
Snapshot
- This is a 4-bed/2.5-bath land listed at $442k.
Deal economics
- At list price, monthly cash flow is $-1k ($-14k/yr) — negative.
- To cash-flow at today's rent, offer at most $279k (36.9% below list).
- To meet the 1% rule (rent ≥ 1% of price), the offer needs to be $252k (42.9% below list).
- Recommended offer: $252k (42.9% below list) — sets the bar for 1% rule.
Location & tenants
- Location reads 88/100 on livability (#2 in TX, #210 nationally) — a professional / high-income tenant draw. Strengths: amenities A+, commute A+, housing A+.
- Denton ISD (urban): math 36% / reading 43% proficiency, ranked #383 of 826 in TX (top 46%) — families likely to look elsewhere, expect single-tenant / working-renter base with shorter leases.
- Market conditions: Rents falling (-3.4%/yr); 172 active listings in the ZIP; 25 comparable units currently listed for rent nearby; rentals at typical pace (median 27d on market — plan ~3-4 weeks tenant-placement turnaround); 44% of comp listings sitting > 30 days — soft ceiling on asking rent; 10,531 units permitted in Denton County in 2024 (2,713 in 5+ unit buildings).
- This rent runs 44% of the median local income ($69k/yr) — at the standard rent-burdened threshold; future hikes will face affordability resistance.
Forward outlook
- Local home prices are declining (-3.0%/yr); year-one equity from $3k of loan paydown is wiped out by about $13k of value loss. Plan a longer hold.
- Denton County population projected at +66% by 2050 — long-run rental-demand tailwind backs the buy-and-hold thesis.
Negotiation context
- It's been on market 87 days — a 6% lower offer ($416k) is reasonable based on typical stale-listing flexibility.
Questions for the listing agent
- What do current leases actually rent for vs. the listed asking? Can we see a recent rent roll and the last 12 months of T-12 income?
- It's been on market 87 days. Have you received any prior offers? Is the seller open to a 43% concession, seller financing, or rate buy-down credit?
- What does the HOA fee cover, when was the last increase, and are there any pending special assessments or reserve-fund shortfalls?
- Why hasn't it sold? Are there any deal-killer items the seller is aware of (foundation, flood, title, zoning, code violations)?
- Is there a deadline driving the sale (1031 exchange, divorce, estate, relocation)? That informs how much negotiation room exists.
- Schools are B-rated — typically a magnet for longer-tenancy family renters. What's the average tenant stay here, and is there a school-zone premium baked into asking?
- The area grade is low — what's the realistic commute time and amenity access for the typical tenant pool here? Any planned neighborhood developments (good or bad) we should know about?
- What's the average days-on-market for RENTAL listings here right now (not sales)? A rising rental-DOM trend means longer vacancies and softer asking-rent achievability than the comps imply.
- What's the recent tenant-quality profile in this submarket — average credit score on applications, eviction rate, late-payment / NSF rate, and stable-employment percentage? A property-management company in the area should have these aggregated.
- How much new for-sale + rental construction is in the pipeline within 1–3 miles? Heavy new supply typically softens prices + rents 12–24 months out; constrained supply supports both.
Investment metrics
- 1% rule
- 0.57% ✗
- Cap rate
- 3.23%
- Cash-on-cash
- -10.94%
- DSCR
- 0.51
- GRM
- 14.6
CMA / ARV
- ARV (median comp)
- $389,685
- List price
- $442,285
- Delta
- 13.50%
- Verdict
- OVERPRICED
- Comps
- 20 within 1.0 mi
Projected returns pro-forma
-3.0% appreciation · 0.0% rent growth · sell at horizon
- IRR
- -39.6%
- Equity multiple
- -0.22×
- Total profit
- $-150,901
- Equity at exit
- $65,946
- IRR
- -85.2%
- Equity multiple
- -1.04×
- Total profit
- $-252,271
- Equity at exit
- $38,241
Cash invested: $123,840 (down + closing). Projections, not guarantees.
Landlord ↔ Tenant lean methodology
- Overall (STATE)
- 87 Strongly Landlord-Friendly
- State Texas
- 87 Strongly Landlord-Friendly · R+5
- County
- — inherits STATE
- City
- — inherits STATE
ZIP-level market 76205
- Home prices YoY
- -25.8%
- Rents YoY
- -3.4%
- Active inventory
- 172
- Price-to-rent
- 14.6×
Monthly cashflow live
- Estimated rent
- $2,525 high interval (Pro) →
- Mortgage (P&I)
- −$2,319
- Tax est. 1.5%
- −$553 /mo · $6,634/yr
- Insurance
- −$184
- HOA
- −$67
- Vacancy / Maint / Mgmt
- −$530
- Net cashflow
- $-1,129
Break-even live
Sensitivity live
| Price | -10% $-823 | -5% $-976 | +0% $-1,129 | +5% $-1,282 | +10% $-1,435 |
|---|---|---|---|---|---|
| Rent | -10% $-1,329 | -5% $-1,229 | +0% $-1,129 | +5% $-1,029 | +10% $-930 |
| Rate | -1.0pp $-906 | -0.5pp $-1,017 | base $-1,129 | +0.5pp $-1,244 | +1.0pp $-1,360 |
UW: 25.0% down · 7.5% · 30yr · 1.5% tax · 5.0% vac · 8.0% maint · 8.0% mgmt
Financing live
Cash to close
- Down payment
- $110,571
- Closing costs
- $13,269
- Reserves months
- —
- Total cash needed
- —
Loan-product check · same deal, 3 products live
Conventional
25% down · 7.5% · 30yr
- Down + closing
- —
- Monthly P&I
- —
- Monthly cashflow
- —
- DSCR
- —
- Eligible?
- —
Personal DTI + credit; lowest rate.
DSCR
20% down · 8.5% · 30yr
- Down + closing
- —
- Monthly P&I
- —
- Monthly cashflow
- —
- DSCR
- —
- Eligible?
- —
No personal income docs; deal must DSCR.
Hard money
10% down · 12.0% · 12mo
- Down + closing
- —
- Monthly P&I
- —
- Monthly cashflow
- —
- DSCR
- —
- Eligible?
- —
Short-term bridge; refi at stabilization.
Rent comps 25 comps
| Address | Beds | Baths | Sqft | Rent | $/sqft | DOM | Units | Dist |
|---|---|---|---|---|---|---|---|---|
| 1513 Woodpecker St Denton, TX | 4.0 | 3.0 | 2733 | $3,500 | $1.28 | 12d | 1 | 0.31mi |
| 1709 Sparrow St Denton, TX | 5.0 | 4.0 | 2922 | $3,300 | $1.13 | 0d | 1 | 0.35mi |
| 2201 Yellowhammer Rd Denton, TX | 4.0 | 3.0 | 2874 | $3,150 | $1.10 | 26d | 1 | 0.36mi |
| 2301 Ruff Rd Denton, TX | 4.0 | 2.0 | 1914 | $2,700 | $1.41 | 26d | 1 | 0.42mi |
| 2605 Starling St Denton, TX | 5.0 | 3.0 | 2150 | $2,850 | $1.33 | 0d | 1 | 0.46mi |
| 2704 Donella Dr Denton, TX | 4.0 | 2.0 | 1901 | $2,500 | $1.32 | 45d | 1 | 0.80mi |
| 2200 Laurel St Denton, TX | 3.0 | 2.0 | 1444 | $2,195 | $1.52 | 45d | 1 | 0.80mi |
| 1403 Kendolph Dr Denton, TX | 3.0 | 2.0 | 1967 | $2,975 | $1.51 | 4d | 1 | 0.96mi |
| 1324 Norman St Denton, TX | 4.0 | 2.0 | 1600 | $1,895 | $1.18 | 45d | 1 | 0.98mi |
| 1105 Neff St Denton, TX | 4.0 | 2.0 | 1400 | $2,099 | $1.50 | 45d | 1 | 1.09mi |
| 1007 W Collins St Denton, TX | 4.0 | 2.0 | 1696 | $1,850 | $1.09 | 20d | 1 | 1.10mi |
| 1103 Neff St Denton, TX | 4.0 | 2.0 | 1600 | $2,099 | $1.31 | 45d | 1 | 1.10mi |
| 101 Daugherty St Denton, TX | 4.0 | 4.0 | 1458 | $694 | $0.48 | 45d | 1 | 1.17mi |
| 3108 Spenrock Ct Denton, TX | 4.0 | 2.5 | 2124 | $2,200 | $1.04 | 46d | 1 | 1.18mi |
| 3117 Kappwood Ct Denton, TX | 4.0 | 2.5 | 1887 | $2,125 | $1.13 | 18d | 1 | 1.20mi |
| 3117 Kappwood Ct Denton, TX | 4.0 | 2.5 | 1887 | $2,125 | $1.13 | 4d | 1 | 1.20mi |
| 2016 Pembrooke Pl Denton, TX | 4.0 | 3.5 | 2820 | $3,250 | $1.15 | 6d | 1 | 1.30mi |
| 1112 Beechwood Dr Denton, TX | 4.0 | 2.5 | 1606 | $2,405 | $1.50 | 45d | 1 | 1.36mi |
| 3100 Hornbeam St Argyle, TX | 3.0 | 2.5 | 2572 | $2,550 | $0.99 | 45d | 1 | 1.38mi |
| 1029 Beechwood Dr Denton, TX | 4.0 | 2.5 | 2105 | $2,200 | $1.05 | 45d | 1 | 1.39mi |
| 1120 Springcreek Dr Denton, TX | 4.0 | 2.5 | 2698 | $2,370 | $0.88 | 14d | 1 | 1.41mi |
| 3121 Hornbeam St Argyle, TX | 3.0 | 2.0 | 1852 | $2,399 | $1.30 | 4d | 1 | 1.43mi |
| 1009 Springcreek Dr Denton, TX | 4.0 | 2.0 | 1467 | $1,970 | $1.34 | 22d | 1 | 1.45mi |
| 1001 Springcreek Dr Denton, TX | 4.0 | 2.0 | 1515 | $2,235 | $1.48 | 1d | 1 | 1.45mi |
| 4512 Remuda Ln Argyle, TX | 3.0 | 2.0 | 1737 | $2,300 | $1.32 | 45d | 1 | 1.46mi |
HOA detail
- Monthly dues
- $67 · $804/yr
- Likely covers
- waterpool
Listing history 15 events
-
2026-06-21days on market $442,285 Active 87 DOM
-
2026-06-18days on market $442,285 Active 84 DOM
-
2026-06-17days on market $442,285 Active 83 DOM
-
2026-06-16days on market $442,285 Active 82 DOM
-
2026-06-15days on market $442,285 Active 81 DOM
-
2026-06-13days on market $442,285 Active 79 DOM
-
2026-06-09days on market $442,285 Active 75 DOM
-
2026-06-08days on market $442,285 Active 74 DOM
-
2026-06-07days on market $442,285 Active 73 DOM
-
2026-06-04days on market $442,285 Active 70 DOM
-
2026-06-03days on market $442,285 Active 69 DOM
-
2026-06-02days on market $442,285 Active 68 DOM
-
2026-06-01days on market $442,285 Active 67 DOM
-
2026-05-31days on market $442,285 Active 66 DOM
-
2026-03-26$442,285 Active 1033-char remark
Show marketing remark (1033 chars)
D.R. Horton is now selling in the new phase at their fabulous community of Eagle Creek in Denton and Denton ISD!! Gorgeous open concept single Story 4 bedroom, 2.5 bath Kingbird Floorplan-Elevation E, on North facing lot, with an estimated Summer completion. Large Chef's Kitchen with seating Island, Quartz countertops, Pendant lights, abundant Cabinets, tiled Backsplash, built-in stainless steel Appliances and wide Pantry. Spacious Living and luxurious main Bedroom at the rear of the Home with dual sink Vanity, over sized Shower, Linen Closet and walk-in Closet. Quartz Countertops in Kitchen and vanities in both Baths. Home includes America's Smart Home Technology bas package. High-efficiency SEER HVAC System, Tankless Water Heater, covered back Patio, full gutters, front Coach Lights, 6 foot fenced backyard, landscape Pkg with full Sprinkler System and more! Community Playground, Club House and Pool. Close proximity to Downtown Denton, UNT, TWU, The Square, Rayzor Ranch Town Center and Restaurants, I-35E & I-35W.
ⓘ Source: listings_history table (triggers on properties + properties_extension) + one-shot
backfill from property_details.listing_events for pre-trigger history.
Nearby sold comps map
Loading sold comps map…
Walkable amenities ~0.75 mi
Loading nearby amenities…
Taxation est. · year 1
- Rental income
- $30,295
- − Mortgage interest
- −$24,775
- − Property taxes
- −$6,634
- − Insurance
- −$2,211
- − Repairs & maintenance
- −$2,424
- − Management
- −$2,424
- − HOA
- −$804
- − Depreciation
- −$12,866
- Taxable loss
- −$21,843
- Est. tax savings @ 24.0%
- +$5,242
- After-tax cash flow
- $-8,307/yr
For passive investors: Depreciation is non-cash, so a rental often shows a tax loss while cash-flowing — sheltering income. Rental losses are passive: they offset passive income freely, and up to $25,000/yr can offset ordinary (W-2) income if you actively participate and your MAGI is under $100k (phasing out to $0 by $150k); unused losses carry forward. On sale, claimed depreciation is recaptured at up to 25%, and gains may owe capital-gains tax (a 1031 exchange can defer both). Figures are a year-1 estimate at your 24.0% rate — not tax advice; consult a CPA.
Schools (NCES district)
- District
- Denton ISD
- NCES district ID
- 4816740
- Math proficiency
- 36% ▼ -18.00%
- Reading proficiency
- 43% ▼ -9.00%
- Median HH income
- $58,913
- Composite
- 34.91/100
- National rank
- #5075
- State rank
- #383 of 826 in TX
Livability — Denton
- Score
- 88/100
- State rank
- #2
- US rank
- #210
Category grades
Schools grade is shown separately in the Schools card above.
Census & demographics
- Census place
- Denton, TX
- County
- Denton County · 901,654 people
- City population
- 127,990
- Metro
- Dallas-Fort Worth-Arlington, TX
- Population (ZIP)
- 18,978
- Household income
- $68,600
- Rent vs Own
- Severe rent burden
- 1268.0
Population outlook (Denton County) Hauer SSP2
- Today (2025)
- 1,053,010 people
- By 2030
- 1,192,269 · +13.2%
- By 2040
- 1,472,920 · +39.9%
- By 2050
- 1,746,506 · +65.9%
- By 2075
- 2,358,497 · +124.0%
- By 2100
- 2,779,183 · +163.9%
Race, ethnicity, and origin ACS 2023
- Neighborhood character
- Diverse neighborhood (Simpson 0.67)
- Race & ethnicity
- White 49% Hispanic / Latino 26% Two or more races 18% Black 17% Asian 2%
- Hispanic origin (detail)
- Mexican 24%
- Common ancestry
- Italian 3% Slovak 2% Lithuanian 2%
- Foreign-born
- 17% · Canada, China
- Languages at home
- 76% English-only · Spanish 18% Arabic 3% Other Indo-European 1%
Political lean MEDSL · Denton
- 2024 margin
- R (+13.2) · D 42.7% · R 55.8% · Other 1.5%
- 2008→2024 swing
- +11.0pp toward D · 2008: -24.2pp · 2024: -13.2pp
- All cycles
- 2024: R+13.2 2020: R+8.1 2016: R+20.2 2012: R+31.7 2008: R+24.2
Not yet ingested
- Civics
- —
Market trends
- HPI YoY
- ▼ -101.13%
- Current HPI
- 290.7883
- Rent YoY
- ▼ -3.40%
- Metro
- Dallas-Fort Worth-Arlington, TX
- State GDP YoY
- ▲ 3.95%
- F500 in state
- 110
Industry mix (Fortune 500 HQ in TX)
| Industry | F500 HQs | Revenue |
|---|---|---|
| Energy | 16 | $1,198B |
|
||
| Technology | 5 | $198B |
|
||
| Engineering / Construction | 4 | $72B |
|
||
| Energy Services | 3 | $60B |
|
||
| Utilities | 3 | $41B |
|
||
| Healthcare | 2 | $330B |
|
||
Price history
1 event — show timeline
- 2026-03-26 Listed $442,285 NTREIS
Property tax history
-13.4%/yrLatest (2025): $307 · +23.6% YoY. Source: county tax records.
Cash-flow waterfall
monthlySold comps — $/sqft
last 12 mo · ≤1 miLoading sold comps…