 Multi-family
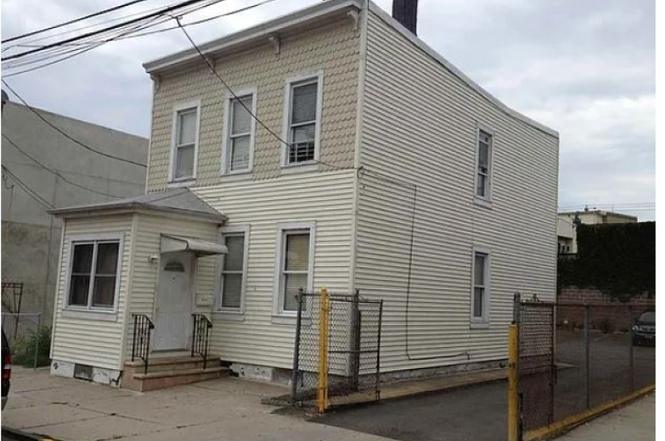
6115 Buchanan Pl #2 · West New York, NJ
Flood risk 6/10 · Moderate
- FEMA flood zone
- X (unshaded)
- Chance of flooding over 30 yrs
- 0.68%
- Est. flood insurance / yr
- $507 – $1,088
Fire risk 1/10 · Minimal
- Est. fire insurance / yr
- $526 – $976
Heat risk 7/10 · Major
- Hot days now (above 99°F)
- 7 days/yr
- Hot days in 30 yrs
- 15 days/yr
Wind risk 6/10 · Moderate
- Chance of severe wind over 30 yrs
- 27.0%
Air-quality risk 4/10 · Minor
- Unhealthy air days now
- 5 days/yr
- Unhealthy air days in 30 yrs
- 6 days/yr
Risk factors via First Street. Map © Google.
Why this score? — see what drove the C- grade
The composite is a weighted blend of 9 inputs, each scored 0–100. Each bar is that input's sub-score; the figure is the points it added to the 100-point composite (weight × sub-score).
- Cash flow +17.0/30.0
- ARV discount +7.5/15.0
- DSCR +5.3/10.0
- Appreciation +5.0/10.0
- 1% rule +4.6/10.0
- Livability +3.9/5.0
- Rent growth +2.5/5.0
- Condition / age +2.5/5.0
- Schools +1.9/10.0
$969,000
🖨 Deal sheet 📄 Offer letter ✓ Due diligence
Multi-family units
County records classify this as Multi-Family (2-4 Unit). Listing-text estimate: 1 unit. estimate disagrees with records
Listing remarks
Property offers 10"15 parking spaces, making it a strong investment or redevelopment opportunity. Prime Hudson County location just minutes from NYC with direct bus access and close proximity to the Lincoln Tunnel. Surrounded by active redevelopment and rising property values, with strong rental and condo demand from NYC commuters. Walkable to Bergenline Avenue retail, dining, and transit. Area transitioning from low-rise to higher-density growth. Rear tenant pays $5,000 per month for parking and requires 30"60 days to relocate vehicles. Located in the heart of West New York and surrounded by mid/high-rise projects, 6115 Buchanan Place offers exceptional upside potential and long-
Key facts
- Strong rental demand
- Direct bus access
- Active redevelopment
Tags
Property features AI
Finance
- Financial info: 2 total units; Reported gross operating income: 11,400,000; Reported total operating expenses: 300; Net operating income reported as 0; Expenses include hot and cold water; Unit 1 rent: 1500 with $3,000 security deposit; Unit 2 rent: 3000 with $6,000 security deposit
Exterior
- Parking: Approximately 15 parking spaces; Blacktop surface parking lot (exclusive)
- Security: Carbon monoxide detectors and smoke detectors in units
- Utilities: Electric service; Natural gas; Public water; Public sewer
- Home design: Two-story building; Beige exterior color; Flat roof
- Construction: Aluminum and vinyl siding; Has home warranty
- Exterior features: Metal fence, partially fenced yard; Sidewalk
Interior
- Kitchen: Unit 1: Dishwasher, Electric range/oven, Gas range/oven, Refrigerator; Unit 2: Dishwasher, Microwave, Electric range/oven, Gas range/oven, Refrigerator
- Bedrooms: Unit 1: 2 bedrooms; Unit 2: 1 bedroom
- Flooring: Vinyl/linoleum floors
- Bathrooms: 2 full bathrooms; 1 half bathroom; Unit 1: 1 bathroom; Unit 2: 1 bathroom; Unit 3: 1 half bathroom
- Heating & cooling: Two heating units (natural gas); Two cooling units
- Interior features: Blinds; Carbon monoxide detector; Fire extinguisher; Smoke detector; Vinyl/linoleum floors; Walk-in closet; Electric and gas water heaters; Basement with Bilco-style door (unfinished)
- Laundry & utility: Unit 2: Laundry room; Tenant pays electric, gas, and heat for each unit
Neighborhood map
What this means for you Summary
Snapshot
- This is a 3-bed/2.5-bath multifamily listed at $969k.
Deal economics
- At list price, monthly cash flow is $650 ($8k/yr) — positive.
- The deal already cash-flows at list — no discount required.
- To meet the 1% rule (rent ≥ 1% of price), the offer needs to be $930k (4.0% below list).
- Recommended offer: $882k (9.0% below list) — sets the bar for market timing.
- Cap rate 7.1% vs local median 1.5% in West New York — top-decile yield for the area; either an underpriced asset or a hidden risk that comps aren't pricing in. Stress-test before assuming the spread holds.
Location & tenants
- Location reads 77/100 on livability (#119 in NJ, #3,034 nationally) — a middle-class / working-renter tenant base. Strengths: amenities A+, commute A+, health & safety A; Watch: cost of living F.
- West New York Board Of Education (suburban): math 10% / reading 34% proficiency, ranked #420 of 472 in NJ (top 89%) — low school quality limits family demand, transient renter base, plan for 1-2y turnover; 75% free/reduced lunch — lower-income household profile, screen leases tightly.
- Zoned schools: Memorial High School (math 15% / reading 43%, grade F, #298 of 399 statewide, top 75%, 2,251 students, 80% FRL).
- Market conditions: 1 active listings in the ZIP; 1 comparable units currently listed for rent nearby; 5,310 units permitted in Hudson County in 2024 (4,154 in 5+ unit buildings).
Forward outlook
- In year one you build about $36k of equity ($7k loan paydown + $29k appreciation (3.0% local appreciation)).
- Hudson County population projected at +29% by 2050 — long-run rental-demand tailwind backs the buy-and-hold thesis.
- At projected returns (3.0% appreciation + 3.0% rent growth), your $271k cash investment doubles in ~6 years — after that, you're playing with house money.
- By year 2, paydown + projected appreciation supports a ~$58k cash-out refi (75% LTV) — recoverable capital for the next deal without selling this one.
Negotiation context
- It's been on market 116 days — a 9% lower offer ($882k) is reasonable based on typical stale-listing flexibility.
Risks & watch-outs
- Watch-outs: built in 1909 — expect roof / HVAC / electrical / plumbing capex.
- Climate carrying-cost: major flood risk; major wind risk, 27% chance of damaging wind over 30y; extreme-heat days projected 7→15/yr by 2055 (HVAC capex compounding) — expect insurance premiums to compound above CPI over the hold.
Questions for the listing agent
- It's been on market 116 days. Have you received any prior offers? Is the seller open to a 9% concession, seller financing, or rate buy-down credit?
- Built in 1909 — when were the roof, HVAC, electrical panel, plumbing, and water heater last replaced?
- Why hasn't it sold? Are there any deal-killer items the seller is aware of (foundation, flood, title, zoning, code violations)?
- Is there a deadline driving the sale (1031 exchange, divorce, estate, relocation)? That informs how much negotiation room exists.
- Schools are D-rated, which usually means shorter tenancies and higher turnover. Who's the typical renter profile here, and what's been the actual vacancy rate?
- What's the average days-on-market for RENTAL listings here right now (not sales)? A rising rental-DOM trend means longer vacancies and softer asking-rent achievability than the comps imply.
- What's the recent tenant-quality profile in this submarket — average credit score on applications, eviction rate, late-payment / NSF rate, and stable-employment percentage? A property-management company in the area should have these aggregated.
- How much new apartment / multifamily construction is in the pipeline within 1–3 miles? Heavy new supply (>2% of stock underway) typically softens rents 12–24 months out; light construction supports rent growth.
Investment metrics
- 1% rule
- 0.96% ✗
- Cap rate
- 7.10%
- Cash-on-cash
- 2.87%
- DSCR
- 1.13
- GRM
- 8.7
CMA / ARV
No comps found within radius.
Projected returns pro-forma
3.0% appreciation · 3.0% rent growth · sell at horizon
- IRR
- 10.2%
- Equity multiple
- 1.58×
- Total profit
- $158,248
- Equity at exit
- $435,704
- IRR
- 12.5%
- Equity multiple
- 2.86×
- Total profit
- $505,703
- Equity at exit
- $671,472
Cash invested: $271,320 (down + closing). Projections, not guarantees.
Landlord ↔ Tenant lean methodology
- Overall (STATE)
- 21 Tenant-Leaning
- State New Jersey
- 21 Tenant-Leaning · D+6
- County
- — inherits STATE
- City
- — inherits STATE
ZIP-level market 07093-2914
- Active inventory
- 1
- Price-to-rent
- 17.4×
Monthly cashflow live
- Estimated rent
- $9,299 high interval (Pro) →
- Mortgage (P&I)
- −$5,082
- Tax est. 1.5%
- −$1,211 /mo · $14,535/yr
- Insurance
- −$404
- HOA
- −$0
- Vacancy / Maint / Mgmt
- −$1,953
- Net cashflow
- $650
Break-even live
2-unit breakdown (identical units grouped — click to expand)
| Units | Beds | Baths | Est. rent |
|---|---|---|---|
| 2× units | 3 | 1.5 | $9,300 |
| #1 | 3 | 1.5 | $4,650 |
| #2 | 3 | 1.5 | $4,650 |
| Total (2 units) | $9,299 | ||
UW: 25.0% down · 7.5% · 30yr · 1.5% tax · 5.0% vac · 8.0% maint · 8.0% mgmt
Financing live
Cash to close
- Down payment
- $242,250
- Closing costs
- $29,070
- Reserves months
- —
- Total cash needed
- —
Loan-product check · same deal, 3 products live
Conventional
25% down · 7.5% · 30yr
- Down + closing
- —
- Monthly P&I
- —
- Monthly cashflow
- —
- DSCR
- —
- Eligible?
- —
Personal DTI + credit; lowest rate.
DSCR
20% down · 8.5% · 30yr
- Down + closing
- —
- Monthly P&I
- —
- Monthly cashflow
- —
- DSCR
- —
- Eligible?
- —
No personal income docs; deal must DSCR.
Hard money
10% down · 12.0% · 12mo
- Down + closing
- —
- Monthly P&I
- —
- Monthly cashflow
- —
- DSCR
- —
- Eligible?
- —
Short-term bridge; refi at stabilization.
Rent comps 1 comps
| Address | Beds | Baths | Sqft | Rent | $/sqft | DOM | Units | Dist |
|---|---|---|---|---|---|---|---|---|
| 470 Buffalo Ct West New York, NJ | 3.0 | 3.5 | 2800 | $12,000 | $4.29 | 22d | 1 | 0.47mi |
Listing history 15 events
-
2026-06-18days on market $969,000 Active 116 DOM
-
2026-06-17days on market $969,000 Active 115 DOM
-
2026-06-16days on market $969,000 Active 114 DOM
-
2026-06-15days on market $969,000 Active 113 DOM
-
2026-06-13days on market $969,000 Active 111 DOM
-
2026-06-13days on market $969,000 Active 110 DOM
-
2026-06-09days on market $969,000 Active 107 DOM
-
2026-06-08days on market $969,000 Active 106 DOM
-
2026-06-07days on market $969,000 Active 105 DOM
-
2026-06-04days on market $969,000 Active 102 DOM
-
2026-06-03days on market $969,000 Active 101 DOM
-
2026-06-02days on market $969,000 Active 100 DOM
-
2026-06-01days on market $969,000 Active 99 DOM
-
2026-05-31days on market $969,000 Active 98 DOM
-
2026-02-22$969,000 Active
ⓘ Source: listings_history table (triggers on properties + properties_extension) + one-shot
backfill from property_details.listing_events for pre-trigger history.
Climate risk First Street
- Flood 6/10 Major FEMA zone X (unshaded) · 68% chance over 30 yrs
- Wildfire 1/10 Low
- Heat 7/10 Severe 7 d/yr ≥99°F today · 15 d/yr by 30 yrs out
- Wind 6/10 Major 27% chance of damaging wind over 30 yrs
- Air quality 4/10 Moderate 5 unhealthy d/yr today · 6 by 30 yrs out
Nearby sold comps map
Loading sold comps map…
Walkable amenities ~0.75 mi
Loading nearby amenities…
Taxation est. · year 1
- Rental income
- $111,588
- − Mortgage interest
- −$54,279
- − Property taxes
- −$14,535
- − Insurance
- −$4,845
- − Repairs & maintenance
- −$8,927
- − Management
- −$8,927
- − Depreciation
- −$28,189
- Taxable loss
- −$8,114
- Est. tax savings @ 24.0%
- +$1,947
- After-tax cash flow
- $9,743/yr
For passive investors: Depreciation is non-cash, so a rental often shows a tax loss while cash-flowing — sheltering income. Rental losses are passive: they offset passive income freely, and up to $25,000/yr can offset ordinary (W-2) income if you actively participate and your MAGI is under $100k (phasing out to $0 by $150k); unused losses carry forward. On sale, claimed depreciation is recaptured at up to 25%, and gains may owe capital-gains tax (a 1031 exchange can defer both). Figures are a year-1 estimate at your 24.0% rate — not tax advice; consult a CPA.
Schools (NCES district)
- District
- West New York Board Of Education
- NCES district ID
- 3417580
- Math proficiency
- 10% ▼ -19.00%
- Reading proficiency
- 34% ▼ -9.00%
- Median HH income
- $46,745
- Composite
- 19.16/100
- National rank
- #8824
- State rank
- #420 of 472 in NJ
Livability — West New York
- Score
- 77/100
- State rank
- #119
- US rank
- #3034
Category grades
Schools grade is shown separately in the Schools card above.
Census & demographics
- Census place
- West New York, NJ
Population outlook (Hudson County) Hauer SSP2
- Today (2025)
- 771,834 people
- By 2030
- 818,028 · +6.0%
- By 2040
- 907,866 · +17.6%
- By 2050
- 994,480 · +28.8%
- By 2075
- 1,163,301 · +50.7%
- By 2100
- 1,254,703 · +62.6%
Not yet ingested
- Political lean
- —
- Race & ethnicity
- —
- Common origin
- —
- Civics
- —
Market trends
- HPI YoY
- —
- Current HPI
- —
- Rent YoY
- —
- Metro
- —
- State GDP YoY
- ▲ 2.05%
- F500 in state
- 34
Industry mix (Fortune 500 HQ in NJ)
| Industry | F500 HQs | Revenue |
|---|---|---|
| Consumer Goods | 3 | $31B |
|
||
| Pharmaceuticals | 2 | $153B |
|
||
| Technology | 2 | $21B |
|
||
| Insurance | 2 | $20B |
|
||
| Healthcare | 2 | $19B |
|
||
| Financial Services | 1 | $70B |
|
||
Price history
1 event — show timeline
- 2026-02-22 Listed $969,000 GSMLS
Cash-flow waterfall
monthlySold comps — $/sqft
last 12 mo · ≤1 miLoading sold comps…