 Multi-family
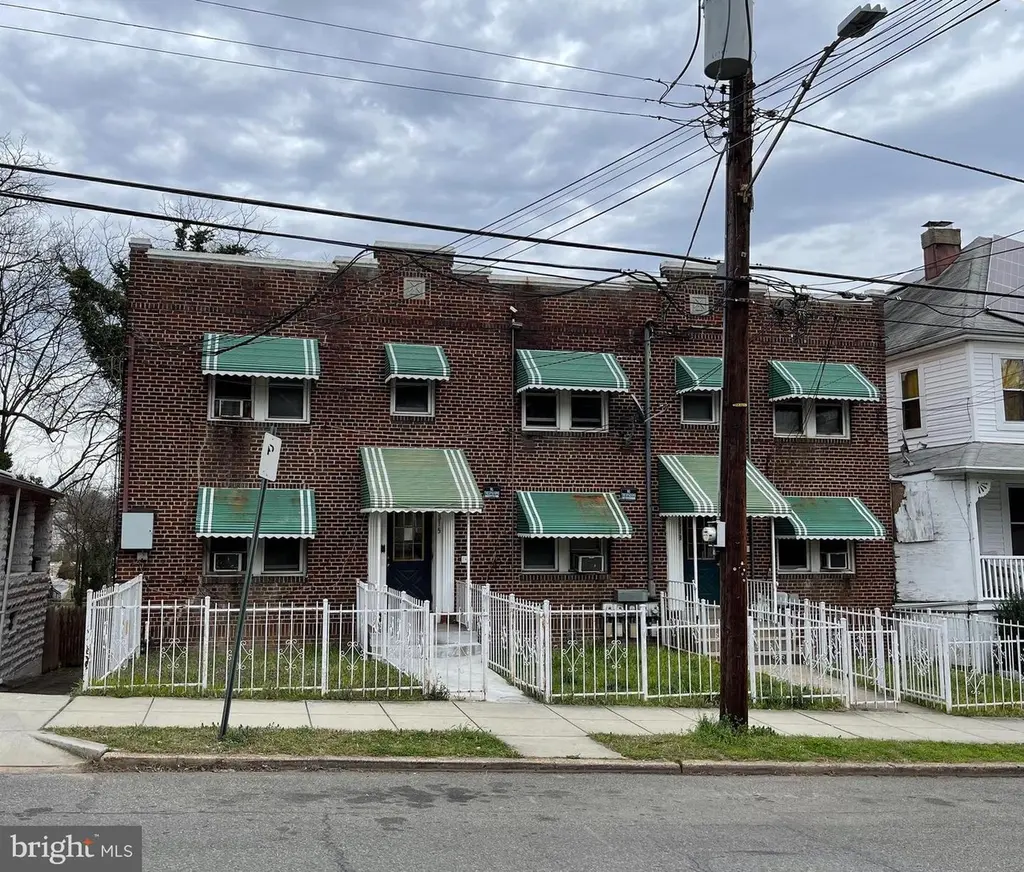
2513-15 22nd St NE · Washington, DC
Flood risk 1/10 · Minimal
- FEMA flood zone
- X (unshaded)
- Chance of flooding over 30 yrs
- 0.0%
- Est. flood insurance / yr
- $507 – $1,088
Fire risk 1/10 · Minimal
- Est. fire insurance / yr
- $631 – $1,173
Heat risk 7/10 · Major
- Hot days now (above 105°F)
- 7 days/yr
- Hot days in 30 yrs
- 15 days/yr
Wind risk 4/10 · Minor
- Chance of severe wind over 30 yrs
- 20.0%
Air-quality risk 4/10 · Minor
- Unhealthy air days now
- 4 days/yr
- Unhealthy air days in 30 yrs
- 5 days/yr
Risk factors via First Street. Map © Google.
Why this score? — see what drove the B- grade
The composite is a weighted blend of 9 inputs, each scored 0–100. Each bar is that input's sub-score; the figure is the points it added to the 100-point composite (weight × sub-score).
- Cash flow +30.0/30.0
- DSCR +10.0/10.0
- 1% rule +9.8/10.0
- ARV discount +7.5/15.0
- Livability +3.7/5.0
- Schools +3.6/10.0
- Rent growth +2.5/5.0
- Condition / age +2.5/5.0
- Appreciation +0.0/10.0
$800,000
🖨 Deal sheet 📄 Offer letter ✓ Due diligence
Multi-family units
County records classify this as Multi-Family (2-4 Unit). Listing-text estimate: 1 unit. estimate disagrees with records
Listing remarks
Value-add opportunity in Woodridge. 2513 22nd St NE (2 units) and 2515 22nd St NE (4 units) are being sold together for a total price of $800,000. All 6 units across both buildings are configured as one bedroom + den / one bath apartments but it is possible to add bedrooms in all units. The buildings have large unfinished basements that can be converted into living space. There are currently 2 vacant unit, the other 4 are occupied. In-place rents range between $1,000/month and $1,384/month. Units are in good condition but dated. Electric and gas are separately metered. The lot is large and deep, measuring 7,500 SF. Zoning for both parcels is R-1B. Contact us today with any questions!
Key facts
- 3,750 sq ft lot
- Built 1941
- Listed 43 days
Property features AI
Finance
- Financial info: Two total units (multi-family); Assessor improvement and land values reported
Exterior
- Parking: On-street parking
- Utilities: Public water; Public sewer
- Home design: Semi-detached property; Fee simple ownership
- Construction: Brick construction; Brick/mortar foundation; Assessor-reported year built source
- Exterior features: No tidal water on the property; Above-grade and below-grade structures noted
Interior
- Bedrooms: Two one-bedroom units (multi-unit property)
- Heating & cooling: Hot water heating; Natural gas heating fuel; Electric cooling fuel
- Interior features: Assessor-reported living area source
Neighborhood map
What this means for you Summary
Snapshot
- This is a 2-bed/2.0-bath multifamily listed at $800k.
Deal economics
- At list price, monthly cash flow is $4k ($54k/yr) — positive.
- The deal already cash-flows at list — no discount required.
- Meets the 1% rule at list price ($12k rent vs $800k).
- Recommended offer: $776k (3.0% below list) — sets the bar for market timing.
- Cap rate 13.0% vs local median 2.5% in Washington — top-decile yield for the area; either an underpriced asset or a hidden risk that comps aren't pricing in. Stress-test before assuming the spread holds.
Location & tenants
- Location reads 73/100 on livability (#1 in DC) — a middle-class / working-renter tenant base. Strengths: amenities A+, commute A+, employment A+; Watch: crime F, cost of living F.
- District Of Columbia Public Schools (urban): math 33% / reading 40% proficiency, ranked #8 of 32 in DC (top 25%) — families likely to look elsewhere, expect single-tenant / working-renter base with shorter leases; 65% free/reduced lunch — lower-income household profile, screen leases tightly.
- Market conditions: Rents flat; 114 active listings in the ZIP; 40 comparable units currently listed for rent nearby; rentals at typical pace (median 25d on market — plan ~3-4 weeks tenant-placement turnaround); solid renter incomes; 1,737 units permitted in District of Columbia in 2024 (1,506 in 5+ unit buildings).
- At $11,871/mo this rent would consume 157% of the median local household income ($91k/yr) (locally 919% of renters already pay >50% of income on rent) — very limited rent-growth headroom before tenants either downsize or default.
Forward outlook
- Local home prices are declining (-3.0%/yr); year-one equity from $6k of loan paydown is wiped out by about $24k of value loss. Plan a longer hold.
- District of Columbia County population projected at +50% by 2050 — long-run rental-demand tailwind backs the buy-and-hold thesis.
- At projected returns (-3.0% appreciation + 0.1% rent growth), your $224k cash investment doubles in ~6 years — after that, you're playing with house money.
Negotiation context
- It's been on market 43 days — a 3% lower offer ($776k) is reasonable based on typical stale-listing flexibility.
- 5 sale attempts since 2y ago with the ask held roughly flat each time — persistent listings suggest the price (not the market) is what's stuck; bring a comps-based counter.
Risks & watch-outs
- Watch-outs: built in 1941 — expect roof / HVAC / electrical / plumbing capex.
- Climate carrying-cost: extreme-heat days projected 7→15/yr by 2055 (HVAC capex compounding) — expect insurance premiums to compound above CPI over the hold.
Questions for the listing agent
- It's been on market 43 days. Have you received any prior offers? Is the seller open to a 3% concession, seller financing, or rate buy-down credit?
- Built in 1941 — when were the roof, HVAC, electrical panel, plumbing, and water heater last replaced?
- Is there a deadline driving the sale (1031 exchange, divorce, estate, relocation)? That informs how much negotiation room exists.
- Crime grade is F in this area — have there been break-ins, vandalism, or insurance claims at this property in the last 3 years? What carrier currently insures it and at what premium?
- What's the average days-on-market for RENTAL listings here right now (not sales)? A rising rental-DOM trend means longer vacancies and softer asking-rent achievability than the comps imply.
- What's the recent tenant-quality profile in this submarket — average credit score on applications, eviction rate, late-payment / NSF rate, and stable-employment percentage? A property-management company in the area should have these aggregated.
- How much new apartment / multifamily construction is in the pipeline within 1–3 miles? Heavy new supply (>2% of stock underway) typically softens rents 12–24 months out; light construction supports rent growth.
Investment metrics
- 1% rule
- 1.48% ✓
- Cap rate
- 13.03%
- Cash-on-cash
- 24.07%
- DSCR
- 2.07
- GRM
- 5.6
CMA / ARV
No comps found within radius.
Projected returns pro-forma
-3.0% appreciation · 0.06% rent growth · sell at horizon
- IRR
- 14.1%
- Equity multiple
- 1.55×
- Total profit
- $122,207
- Equity at exit
- $119,283
- IRR
- 20.7%
- Equity multiple
- 2.53×
- Total profit
- $342,035
- Equity at exit
- $69,169
Cash invested: $224,000 (down + closing). Projections, not guarantees.
Landlord ↔ Tenant lean methodology
- Overall (CITY)
- 0 Strongly Tenant-Friendly
- State District of Columbia
- 12 Strongly Tenant-Friendly · D+43
- County
- — inherits STATE
- City Washington
- 0 Strongly Tenant-Friendly · D+43
ZIP-level market 20018
- Rents YoY
- 0.1%
- Active inventory
- 114
- Price-to-rent
- 33.7×
Monthly cashflow live
- Estimated rent
- $11,871 high interval (Pro) →
- Mortgage (P&I)
- −$4,195
- Tax from tax record
- −$356 /mo · $4,276/yr
- Insurance
- −$333
- HOA
- −$0
- Vacancy / Maint / Mgmt
- −$2,493
- Net cashflow
- $4,493
Break-even live
6-unit breakdown (identical units grouped — click to expand)
| Units | Beds | Baths | Est. rent |
|---|---|---|---|
| 6× units | 1 | 1 | $11,868 |
| #1 | 1 | 1 | $1,978 |
| #2 | 1 | 1 | $1,978 |
| #3 | 1 | 1 | $1,978 |
| #4 | 1 | 1 | $1,978 |
| #5 | 1 | 1 | $1,978 |
| #6 | 1 | 1 | $1,978 |
| Total (6 units) | $11,871 | ||
UW: 25.0% down · 7.5% · 30yr · 1.5% tax · 5.0% vac · 8.0% maint · 8.0% mgmt
Financing live
Cash to close
- Down payment
- $200,000
- Closing costs
- $24,000
- Reserves months
- —
- Total cash needed
- —
Loan-product check · same deal, 3 products live
Conventional
25% down · 7.5% · 30yr
- Down + closing
- —
- Monthly P&I
- —
- Monthly cashflow
- —
- DSCR
- —
- Eligible?
- —
Personal DTI + credit; lowest rate.
DSCR
20% down · 8.5% · 30yr
- Down + closing
- —
- Monthly P&I
- —
- Monthly cashflow
- —
- DSCR
- —
- Eligible?
- —
No personal income docs; deal must DSCR.
Hard money
10% down · 12.0% · 12mo
- Down + closing
- —
- Monthly P&I
- —
- Monthly cashflow
- —
- DSCR
- —
- Eligible?
- —
Short-term bridge; refi at stabilization.
Rent comps 40 comps
| Address | Beds | Baths | Sqft | Rent | $/sqft | DOM | Units | Dist |
|---|---|---|---|---|---|---|---|---|
| 2425 20th St NE Unit 18 Washington, DC | 2.0 | 2.0 | 900 | $2,400 | $2.67 | 7d | 1 | 0.12mi |
| 1816 Bryant St NE #1816 Washington, DC | 3.0 | 1.5 | 1026 | $3,000 | $2.92 | 24d | 1 | 0.23mi |
| 2414 Hamlin Pl NE Washington, DC | 3.0 | 1.5 | 1500 | $2,550 | $1.70 | 18d | 1 | 0.32mi |
| 3011 20th St NE Washington, DC | 3.0 | 2.0 | 1103 | $5,600 | $5.08 | 24d | 1 | 0.39mi |
| 2324 15th St NE Washington, DC | 3.0 | 2.5 | 1398 | $3,880 | $2.78 | 24d | 1 | 0.50mi |
| 2206 15th St NE Washington, DC | 3.0 | 2.0 | 1184 | $2,500 | $2.11 | 24d | 1 | 0.51mi |
| 3026 Channing St NE Washington, DC | 2.0 | 1.0 | 1224 | $2,399 | $1.96 | 24d | 1 | 0.52mi |
| 2413 14th St NE Washington, DC | 1.0–5.0 | 1.0–2.0 | 1121 | $1,842 | $1.64 | 3d | 46 | 0.55mi |
| 1835 24th St NE Washington, DC | 1.0–2.0 | 1.0 | 800 | $2,518 | $3.15 | 1d | 4 | 0.56mi |
| 3119 S Dakota Ave NE Unit A Washington, DC | 2.0 | 1.0 | 1676 | $1,900 | $1.13 | 24d | 1 | 0.57mi |
| 3119 S Dakota Ave NE Unit B Washington, DC | 2.0 | 1.0 | 1676 | $1,800 | $1.07 | 24d | 1 | 0.57mi |
| 1334 Downing St NE Washington, DC | 3.0 | 1.0 | 1408 | $3,000 | $2.13 | 24d | 1 | 0.68mi |
| 1401 New York Ave NE Washington, DC | 3.0 | 1.0–3.0 | 846 | $2,848 | $3.37 | 1d | 34 | 0.75mi |
| 2417 Otis St NE Washington, DC | 3.0 | 2.5 | 1854 | $3,899 | $2.10 | 7d | 1 | 0.84mi |
| 1929 Gallaudet St NE Washington, DC | 3.0 | 2.0 | 1200 | $3,395 | $2.83 | 24d | 1 | 0.89mi |
| 3467 Summit Ct NE Washington, DC | 2.0 | 1.0 | 982 | $2,600 | $2.65 | 24d | 1 | 0.94mi |
| 1916 W Virginia Ave NE Unit 2 Washington, DC | 3.0 | 2.0 | 1800 | $2,900 | $1.61 | 20d | 1 | 0.95mi |
| 3018 12th St NE #2 Washington, DC | 2.0 | 2.0 | 880 | $3,000 | $3.41 | 24d | 1 | 0.97mi |
| 1495 Gallaudet St NE Unit 1495B Washington, DC | 3.0 | 2.5 | 1586 | $4,141 | $2.61 | 24d | 1 | 0.99mi |
| 1858 Kendall St NE #2 Washington, DC | 3.0 | 2.0 | 1150 | $3,000 | $2.61 | 24d | 1 | 1.00mi |
| 1838 Capitol Ave NE Washington, DC | 3.0 | 2.5 | 1230 | $2,550 | $2.07 | 24d | 1 | 1.01mi |
| 3421 Eastern Ave Mount Rainier, MD | 1.0 | 1.0 | 1000 | $1,700 | $1.70 | 43d | 1 | 1.01mi |
| 2720 10th St NE Washington, DC | 3.0 | 1.5 | 1400 | $1,580 | $1.13 | 7d | 1 | 1.02mi |
| 2726 10th St NE Washington, DC | 3.0 | 2.5 | 1400 | $4,000 | $2.86 | 24d | 1 | 1.02mi |
| 1809 Kendall St NE Washington, DC | 3.0 | 3.0 | 1376 | $3,695 | $2.69 | 24d | 1 | 1.02mi |
| 2607 Reed St NE Washington, DC | 2.0 | 1.0–2.0 | 704 | $2,936 | $4.17 | 2d | 19 | 1.05mi |
| 806 Channing Pl NE Washington, DC | 2.0 | 1.0–2.0 | 726 | $2,763 | $3.81 | 1d | 28 | 1.10mi |
| 1728 Montello Ave NE Washington, DC | 1.0 | 1.0 | 1504 | $1,200 | $0.80 | 24d | 1 | 1.11mi |
| 1269 Simms Pl NE Unit 3 Washington, DC | 2.0 | 1.0 | 995 | $2,540 | $2.55 | 5d | 1 | 1.12mi |
| 1269 Simms Pl NE Unit 3 Washington, DC | 2.0 | 1.0 | 995 | $2,510 | $2.52 | 7d | 1 | 1.12mi |
| 2300 Washington Pl NE Washington, DC | 1.0–2.0 | 1.0–2.0 | 885 | $2,468 | $2.79 | 2d | 8 | 1.14mi |
| 1707 Capitol Ave NE Unit 1 Washington, DC | 2.0 | 1.5 | 883 | $1,850 | $2.10 | 24d | 1 | 1.15mi |
| 1222 18th Pl NE Unit 2 Washington, DC | 1.0 | 1.0 | 900 | $2,100 | $2.33 | 24d | 1 | 1.16mi |
| 1222 18th Pl NE Unit 3 Washington, DC | 2.0 | 1.0 | 900 | $2,300 | $2.56 | 24d | 1 | 1.16mi |
| 1679 Montello Ave NE Washington, DC | 3.0 | 2.0 | 962 | $3,200 | $3.33 | 24d | 1 | 1.17mi |
| 1255 Raum St NE Unit 1388282P Washington, DC | 2.0–8.0 | 1.0–5.0 | 3245 | $3,423 | $1.05 | 2d | 2 | 1.17mi |
| 1255 Raum St NE Unit 1388283P Washington, DC | 2.0 | 1.0 | 893 | $3,560 | $3.99 | 7d | 1 | 1.17mi |
| 3614 12th St NE #7 Washington, DC | 2.0 | 2.0 | 898 | $3,400 | $3.79 | 7d | 1 | 1.20mi |
| 3614 12th St NE Washington, DC | 1.0–2.0 | 1.0–2.0 | 695 | $3,400 | $4.89 | 14d | 2 | 1.20mi |
| 3750 Jamison St NE Washington, DC | 2.0 | 1.0–2.0 | 761 | $2,676 | $3.51 | 2d | 8 | 1.21mi |
Listing history 26 events
-
2026-06-18days on market $800,000 Active 43 DOM
-
2026-06-17days on market $800,000 Active 42 DOM
-
2026-06-16days on market $800,000 Active 41 DOM
-
2026-06-15days on market $800,000 Active 40 DOM
-
2026-06-13days on market $800,000 Active 38 DOM
-
2026-06-09days on market $800,000 Active 34 DOM
-
2026-06-08days on market $800,000 Active 33 DOM
-
2026-06-07days on market $800,000 Active 32 DOM
-
2026-06-04days on market $800,000 Active 29 DOM
-
2026-06-03days on market $800,000 Active 28 DOM
-
2026-06-02days on market $800,000 Active 27 DOM
-
2026-06-01days on market $800,000 Active 26 DOM
-
2026-05-31days on market $800,000 Active 25 DOM
-
2026-05-06$800,000 Active
-
2026-03-14historical
-
2026-02-02price $850,000
-
2025-12-05$950,000 Active
-
2025-11-22historical
-
2025-09-04historical
-
2025-06-06status Active
-
2025-05-31historical
-
2025-04-03price $800,000
-
2025-01-04$867,000 Active
-
2024-10-18historical
-
2024-05-13price $540,000
-
2024-05-01$550,000 Active
ⓘ Source: listings_history table (triggers on properties + properties_extension) + one-shot
backfill from property_details.listing_events for pre-trigger history.
Tax reassessment forecast DC · Partial reset (capped growth)
- Current annual tax
- $4,276 · $356/mo
- Projected year-2 tax
- $4,578 · $381/mo
- Expected delta
- +$302/yr (+$25/mo · 7.1%)
ⓘ Screening estimate from a state-policy table — verify with the county assessor before closing.
Climate risk First Street
- Flood 1/10 Low FEMA zone X (unshaded) · 0% chance over 30 yrs
- Wildfire 1/10 Low
- Heat 7/10 Severe 7 d/yr ≥105°F today · 15 d/yr by 30 yrs out
- Wind 4/10 Moderate 20% chance of damaging wind over 30 yrs
- Air quality 4/10 Moderate 4 unhealthy d/yr today · 5 by 30 yrs out
Nearby sold comps map
Loading sold comps map…
Walkable amenities ~0.75 mi
Loading nearby amenities…
Taxation est. · year 1
- Rental income
- $142,452
- − Mortgage interest
- −$44,812
- − Property taxes
- −$4,276
- − Insurance
- −$4,000
- − Repairs & maintenance
- −$11,396
- − Management
- −$11,396
- − Depreciation
- −$23,273
- Taxable income
- $43,299
- Est. tax owed @ 24.0%
- −$10,392
- After-tax cash flow
- $43,526/yr
For passive investors: Depreciation is non-cash, so a rental often shows a tax loss while cash-flowing — sheltering income. Rental losses are passive: they offset passive income freely, and up to $25,000/yr can offset ordinary (W-2) income if you actively participate and your MAGI is under $100k (phasing out to $0 by $150k); unused losses carry forward. On sale, claimed depreciation is recaptured at up to 25%, and gains may owe capital-gains tax (a 1031 exchange can defer both). Figures are a year-1 estimate at your 24.0% rate — not tax advice; consult a CPA.
Schools (NCES district)
- District
- District Of Columbia Public Schools
- NCES district ID
- 1100030
- Math proficiency
- 33% ▲ 3.00%
- Reading proficiency
- 40% ▲ 5.00%
- Median HH income
- $67,671
- Composite
- 35.84/100
- National rank
- #9606
- State rank
- #8 of 32 in DC
Livability — Washington
- Score
- 73/100
- State rank
- #1
- US rank
- #5327
Category grades
Schools grade is shown separately in the Schools card above.
Census & demographics
- Census place
- Washington, DC
- County
- District of Columbia · 671,873 people
- City population
- 671,873
- Metro
- Washington-Arlington-Alexandria, DC-VA-MD-WV
- Population (ZIP)
- 19,562
- Household income
- $90,639
- Rent vs Own
- Severe rent burden
- 919.0
Population outlook (District of Columbia County) Hauer SSP2
- Today (2025)
- 821,926 people
- By 2030
- 899,517 · +9.4%
- By 2040
- 1,061,162 · +29.1%
- By 2050
- 1,231,493 · +49.8%
- By 2075
- 1,603,312 · +95.1%
- By 2100
- 1,847,141 · +124.7%
Race, ethnicity, and origin ACS 2023
- Neighborhood character
- Predominantly Black (66%)
- Race & ethnicity
- Black 66% White 18% Hispanic / Latino 9% Two or more races 8% Asian 1%
- Hispanic origin (detail)
- Mexican 2% Dominican 1%
- Common ancestry
- Italian 2% Romanian 1% Serbian 1%
- Foreign-born
- 8% · Canada
- Languages at home
- 89% English-only · Spanish 8% Other Indo-European 1% German/W. Germanic 1%
Political lean MEDSL · District of Columbia
- 2024 margin
- Solid D (+86.1) · D 91.2% · R 5.1% · Other 3.8%
- 2008→2024 swing
- +0.1pp no change · 2008: 85.9pp · 2024: 86.1pp
- All cycles
- 2024: D+86.1 2020: D+86.8 2016: D+88.7 2012: D+84.2 2008: D+85.9
Not yet ingested
- Civics
- —
Market trends
- HPI YoY
- ▼ -605.95%
- Current HPI
- 381.7099
- Rent YoY
- ▲ 0.06%
- Metro
- Washington-Arlington-Alexandria, DC-VA-MD-WV
- State GDP YoY
- ▲ 1.33%
- F500 in state
- 6
Industry mix (Fortune 500 HQ in DC)
| Industry | F500 HQs | Revenue |
|---|---|---|
| Financial Services | 1 | $153B |
|
||
| Life Sciences / Industrials | 1 | $25B |
|
||
| Industrial Machinery | 1 | $8B |
|
||
Price history
+45.5% since first listed13 events — show timeline
- 2026-05-06 Listed $800,000 BRIGHT MLS
- 2026-03-14 Listing Removed — BRIGHT MLS
- 2026-02-02 Price Changed $850,000 BRIGHT MLS
- 2025-12-05 Listed $950,000 BRIGHT MLS
- 2025-11-22 Coming Soon — BRIGHT MLS
- 2025-09-04 Listing Removed — BRIGHT MLS
- 2025-06-06 Relisted — BRIGHT MLS
- 2025-05-31 Listing Removed — BRIGHT MLS
- 2025-04-03 Price Changed $800,000 BRIGHT MLS
- 2025-01-04 Listed $867,000 BRIGHT MLS
- 2024-10-18 Listing Removed — BRIGHT MLS
- 2024-05-13 Price Changed $540,000 BRIGHT MLS
- 2024-05-01 Listed $550,000 BRIGHT MLS
Property tax history
+3.6%/yrLatest (2025): $4,276 · +1.6% YoY. Source: county tax records.
Cash-flow waterfall
monthlySold comps — $/sqft
last 12 mo · ≤1 miLoading sold comps…