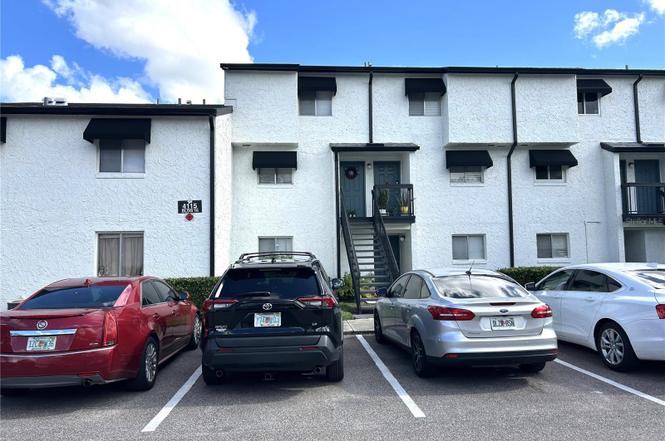
4115 S Semoran Blvd #19 · Orlando, FL
Flood risk No data
- FEMA flood zone
- —
- Chance of flooding over 30 yrs
- —
- Est. flood insurance / yr
- —
Fire risk No data
- Est. fire insurance / yr
- —
Heat risk No data
- Hot days now (above threshold)
- —
- Hot days in 30 yrs
- —
Wind risk No data
- Chance of severe wind over 30 yrs
- —
Air-quality risk No data
- Unhealthy air days now
- —
- Unhealthy air days in 30 yrs
- —
Risk factors via First Street. Map © Google.
Why this score? — see what drove the D grade
The composite is a weighted blend of 9 inputs, each scored 0–100. Each bar is that input's sub-score; the figure is the points it added to the 100-point composite (weight × sub-score).
- Cash flow +10.9/30.0
- ARV discount +7.5/15.0
- 1% rule +6.1/10.0
- Livability +4.3/5.0
- Schools +4.1/10.0
- DSCR +3.1/10.0
- Condition / age +2.5/5.0
- Rent growth +2.3/5.0
- Appreciation +0.0/10.0
$125,000
🖨 Deal sheet (PDF) 📄 Offer letter ✓ Due diligence
Listing remarks MLS
One Bedroom, One Bath Condo! Gated Community! Kitchen features a large pantry! Bedroom is large and includes a walk-in closet! AMAZING Pool! ~ Purchase this property for as little as 3% down! This property is approved for HomePath Renovation Mortgage. All information recorded in the MLS is intended to be accurate but cannot be guaranteed, buyer advised to verify.
Key facts
- Gated community
- Community offers gym
- $287 HOA
Tags
Property features AI
Finance
- Financial info: Total annual HOA/condo fees: $3,444; Lease restrictions apply
- HOA & community: Monthly condo fee: $287 (includes pool, escrow reserves, structure maintenance, grounds maintenance, private road); Association approval required; Association name: Jerry Bateman; Community amenities: Fitness center, Playground, Pool, Tennis courts, Reclaimed water irrigation; Pets allowed (max weight 25 lbs)
Exterior
- Utilities: Public sewer; Water available; Cable available; Public utilities
- Home design: Condominium; Residential property; One story; Faces east; Entry on first floor
- Construction: Stucco construction; Shingle roof; Slab foundation; Built as part of building number 16
- Exterior features: Playground; Sliding doors; Asphalt road surface
Interior
- Kitchen: Dishwasher; Range; Refrigerator
- Bedrooms: 1 bedroom (first floor)
- Flooring: Carpet; Linoleum
- Bathrooms: 1 full bathroom
- Heating & cooling: Central heating; Central air
- Interior features: Thermostat; Walk-in closet(s)
- Laundry & utility: Inside laundry
Neighborhood map
What this means for you Summary
Snapshot
- This is a 1-bed/1.0-bath condo listed at $125k.
Deal economics
- At list price, monthly cash flow is $-56 ($-669/yr) — negative.
- To cash-flow at today's rent, offer at most $117k (6.5% below list).
- Meets the 1% rule at list price ($1k rent vs $125k).
- Recommended offer: $110k (12.0% below list) — sets the bar for market timing.
- Cap rate 5.8% vs local median 3.0% in Orlando — top-decile yield for the area; either an underpriced asset or a hidden risk that comps aren't pricing in. Stress-test before assuming the spread holds.
Location & tenants
- Location reads 86/100 on livability (#12 in FL, #360 nationally) — a professional / high-income tenant draw. Strengths: amenities A+, commute A+, housing A+.
- Orange (suburban): math 46% / reading 51% proficiency, ranked #43 of 73 in FL (top 59%) — families likely to look elsewhere, expect single-tenant / working-renter base with shorter leases.
- Zoned schools: Michael Mccoy Elementary (math 38% / reading 34%, grade F, #1,670 of 2,144 statewide, top 78%, 484 students, 74% FRL); Roberto Clemente Middle (math 31% / reading 36%, grade F, #428 of 571 statewide, top 76%, 951 students, 63% FRL); Colonial High (math 16% / reading 33%, grade F, #505 of 667 statewide, top 79%, 3,442 students, 62% FRL).
- Zoned-school proficiency averages 31% at this address vs 48% district-wide (-17 pts) — the specific schools serving this property underperform the Orange average; the district grade overstates school quality for this exact location.
- Market conditions: Rents soft (-0.7%/yr); 379 active listings in the ZIP; 40 comparable units currently listed for rent nearby; rentals at typical pace (median 16d on market — plan ~3-4 weeks tenant-placement turnaround); 8,053 units permitted in Orange County in 2024 (3,133 in 5+ unit buildings).
Forward outlook
- Local home prices are declining (-3.0%/yr); year-one equity from $864 of loan paydown is wiped out by about $4k of value loss. Plan a longer hold.
- Orange County population projected at +52% by 2050 — long-run rental-demand tailwind backs the buy-and-hold thesis.
Negotiation context
- It's been on market 159 days — a 12% lower offer ($110k) is reasonable based on typical stale-listing flexibility.
- 5 sale attempts since 17y ago with the ask held roughly flat each time — persistent listings suggest the price (not the market) is what's stuck; bring a comps-based counter.
- Current owner paid $28k; list at $125k implies a 339% gain — meaningful room to come down on a strong offer.
Risks & watch-outs
- Watch-outs: HOA is 21% of rent.
Questions for the listing agent
- What do current leases actually rent for vs. the listed asking? Can we see a recent rent roll and the last 12 months of T-12 income?
- It's been on market 159 days. Have you received any prior offers? Is the seller open to a 12% concession, seller financing, or rate buy-down credit?
- Built in 1974 — when were the roof, HVAC, electrical panel, plumbing, and water heater last replaced?
- What does the HOA fee cover, when was the last increase, and are there any pending special assessments or reserve-fund shortfalls?
- Any open or pending special assessments — roof, HVAC, plumbing, elevator, façade? What's the per-unit balance and payoff schedule, and is the seller paying it off at close or rolling it to the buyer?
- Why hasn't it sold? Are there any deal-killer items the seller is aware of (foundation, flood, title, zoning, code violations)?
- Is there a deadline driving the sale (1031 exchange, divorce, estate, relocation)? That informs how much negotiation room exists.
- Schools are B-rated — typically a magnet for longer-tenancy family renters. What's the average tenant stay here, and is there a school-zone premium baked into asking?
- The area grade is low — what's the realistic commute time and amenity access for the typical tenant pool here? Any planned neighborhood developments (good or bad) we should know about?
- What's the average days-on-market for RENTAL listings here right now (not sales)? A rising rental-DOM trend means longer vacancies and softer asking-rent achievability than the comps imply.
- What's the recent tenant-quality profile in this submarket — average credit score on applications, eviction rate, late-payment / NSF rate, and stable-employment percentage? A property-management company in the area should have these aggregated.
- How much new apartment / multifamily construction is in the pipeline within 1–3 miles? Heavy new supply (>2% of stock underway) typically softens rents 12–24 months out; light construction supports rent growth.
Investment metrics
- 1% rule
- 1.11% ✓
- Cap rate
- 5.76%
- Cash-on-cash
- -1.91%
- DSCR
- 0.91
- GRM
- 7.5
CMA / ARV
No comps found within radius.
Projected returns pro-forma
-3.0% appreciation · 0.0% rent growth · sell at horizon
- IRR
- -23.9%
- Equity multiple
- 0.21×
- Total profit
- $-27,673
- Equity at exit
- $18,638
- IRR
- -37.4%
- Equity multiple
- -0.24×
- Total profit
- $-43,570
- Equity at exit
- $10,808
Cash invested: $35,000 (down + closing). Projections, not guarantees.
Landlord ↔ Tenant lean methodology
- Overall (STATE)
- 87 Strongly Landlord-Friendly
- State Florida
- 87 Strongly Landlord-Friendly · R+3
- County
- — inherits STATE
- City
- — inherits STATE
ZIP-level market 32822
- Home prices YoY
- -21.1%
- Rents YoY
- -0.7%
- Active inventory
- 379
- Price-to-rent
- 7.5×
Monthly cashflow live
- Estimated rent
- $1,386 high interval (Pro) →
- Mortgage (P&I)
- −$656
- Tax est. 1.5%
- −$156 /mo · $1,875/yr
- Insurance
- −$52
- HOA
- −$287
- Vacancy / Maint / Mgmt
- −$291
- Net cashflow
- $-56
Break-even live
Sensitivity live
| Price | -10% $31 | -5% $-13 | +0% $-56 | +5% $-99 | +10% $-142 |
|---|---|---|---|---|---|
| Rent | -10% $-165 | -5% $-111 | +0% $-56 | +5% $-1 | +10% $54 |
| Rate | -1.0pp $7 | -0.5pp $-24 | base $-56 | +0.5pp $-88 | +1.0pp $-121 |
UW: 25.0% down · 7.5% · 30yr · 1.5% tax · 5.0% vac · 8.0% maint · 8.0% mgmt
Financing live
Cash to close
- Down payment
- $31,250
- Closing costs
- $3,750
- Reserves months
- —
- Total cash needed
- —
Loan-product check · same deal, 3 products live
Conventional
25% down · 7.5% · 30yr
- Down + closing
- —
- Monthly P&I
- —
- Monthly cashflow
- —
- DSCR
- —
- Eligible?
- —
Personal DTI + credit; lowest rate.
DSCR
20% down · 8.5% · 30yr
- Down + closing
- —
- Monthly P&I
- —
- Monthly cashflow
- —
- DSCR
- —
- Eligible?
- —
No personal income docs; deal must DSCR.
Hard money
10% down · 12.0% · 12mo
- Down + closing
- —
- Monthly P&I
- —
- Monthly cashflow
- —
- DSCR
- —
- Eligible?
- —
Short-term bridge; refi at stabilization.
Rent comps 40 comps
| Address | Beds | Baths | Sqft | Rent | $/sqft | DOM | Units | Dist |
|---|---|---|---|---|---|---|---|---|
| 4155 S Semoran Blvd #3 Orlando, FL | 1.0 | 1.5 | 765 | $1,300 | $1.70 | 23d | 1 | 0.03mi |
| 4113 S Semoran Blvd Orlando, FL | 1.0 | 1.5 | 765 | $1,245 | $1.63 | 25d | 1 | 0.06mi |
| 4113 S Semoran Blvd Orlando, FL | 1.0 | 1.5 | 765 | $1,222 | $1.60 | 9d | 2 | 0.06mi |
| 4151 S Semoran Blvd #11 Orlando, FL | 1.0 | 1.0 | 838 | $1,200 | $1.43 | 21d | 1 | 0.07mi |
| 4148 Pershing Pointe Pl Unit PA4148-1 Orlando, FL | 2.0 | 2.0 | 1006 | $1,275 | $1.27 | 25d | 1 | 0.07mi |
| 4148 Pershing Pointe Pl #1 Orlando, FL | 2.0 | 2.0 | 1006 | $1,275 | $1.27 | 16d | 1 | 0.07mi |
| 4148 Pershing Pointe Pl #1 Orlando, FL | 2.0 | 2.0 | 1006 | $1,275 | $1.27 | 15d | 1 | 0.07mi |
| 4269 S Semoran Blvd #2 Orlando, FL | 2.0 | 2.0 | 1125 | $1,595 | $1.42 | 25d | 1 | 0.08mi |
| 4124 Pershing Pointe Pl Orlando, FL | 2.0 | 2.0 | 1006 | $1,425 | $1.42 | 3d | 1 | 0.09mi |
| 4149 S Semoran Blvd Orlando, FL | 1.0 | 1.5 | 772 | $1,238 | $1.60 | 21d | 2 | 0.10mi |
| 4240 Pershing Pointe Pl #2 Orlando, FL | 2.0 | 2.0 | 1006 | $1,500 | $1.49 | 11d | 1 | 0.11mi |
| 4252 Pershing Pointe Pl #4 Orlando, FL | 2.0 | 2.0 | 1006 | $1,650 | $1.64 | 25d | 1 | 0.14mi |
| 4314 Pershing Pointe Pl #7 Orlando, FL | 2.0 | 2.0 | 1006 | $1,500 | $1.49 | 23d | 1 | 0.18mi |
| 5757 5 Flags Blvd Orlando, FL | 1.0–2.0 | 1.0–2.0 | 660 | $1,049 | $1.59 | 12d | 9 | 0.23mi |
| 4548 Commander Dr Orlando, FL | 2.0 | 1.0 | 934 | $1,500 | $1.61 | 25d | 1 | 0.24mi |
| 4572 Commander Dr Orlando, FL | 1.0 | 1.0 | 735 | $1,212 | $1.65 | 3d | 1 | 0.25mi |
| 4560 Commander Dr Orlando, FL | 1.0 | 1.0 | 735 | $1,250 | $1.70 | 25d | 1 | 0.27mi |
| 3912 Atrium Dr Unit L7 Orlando, FL | 2.0 | 2.0 | 820 | $1,700 | $2.07 | 21d | 1 | 0.27mi |
| 4536 Commander Dr #1517 Orlando, FL | 2.0 | 2.0 | 1054 | $1,595 | $1.51 | 15d | 1 | 0.28mi |
| 4532 Commander Dr #2131 Orlando, FL | 2.0 | 2.0 | 1054 | $1,450 | $1.38 | 4d | 1 | 0.31mi |
| 5974 Lake Pointe Village Cir Orlando, FL | 2.0 | 2.0 | 1058 | $1,735 | $1.64 | 23d | 1 | 0.33mi |
| 4512 Commander Dr #1736 Orlando, FL | 2.0 | 1.0 | 934 | $1,350 | $1.45 | 23d | 1 | 0.35mi |
| 5975 Lake Pointe Village Cir Orlando, FL | 2.0–3.0 | 2.0–2.5 | 1236 | $1,735 | $1.40 | 6d | 12 | 0.35mi |
| 4630 Commander Dr Orlando, FL | 1.0–2.0 | 1.0–2.0 | 894 | $1,275 | $1.43 | 12d | 3 | 0.36mi |
| 4518 Commander Dr Orlando, FL | 1.0 | 1.0 | 755 | $1,238 | $1.64 | 16d | 2 | 0.36mi |
| 4518 Commander Dr #1915 Orlando, FL | 1.0 | 1.0 | 735 | $1,225 | $1.67 | 9d | 1 | 0.36mi |
| 4225 Thornbriar Ln Orlando, FL | 1.0 | 1.0 | 580 | $1,200 | $2.07 | 25d | 2 | 0.36mi |
| 4225 Thornbriar Ln Orlando, FL | 1.0 | 1.0 | 580 | $1,274 | $2.20 | 3d | 2 | 0.36mi |
| 4504 Commander Dr #1828 Orlando, FL | 2.0 | 1.0 | 934 | $1,450 | $1.55 | 15d | 1 | 0.37mi |
| 5601 Rosebriar Way Orlando, FL | 1.0 | 1.0 | 660 | $1,100 | $1.67 | 25d | 1 | 0.38mi |
| 4004 Atrium Dr Orlando, FL | 2.0 | 2.0 | 820 | $1,495 | $1.82 | 25d | 1 | 0.38mi |
| 5575 Rosebriar Way Orlando, FL | 2.0–3.0 | 1.0–2.0 | 980 | $1,466 | $1.50 | 3d | 6 | 0.40mi |
| 3841 Atrium Dr Unit 1564828P Orlando, FL | 2.0 | 2.0 | 818 | $2,505 | $3.06 | 4d | 1 | 0.40mi |
| 3841 Atrium Dr Unit 1271266P Orlando, FL | 2.0 | 2.0 | 818 | $2,468 | $3.02 | 14d | 1 | 0.40mi |
| 4658 Commander Dr #833 Orlando, FL | 2.0 | 1.0 | 934 | $1,450 | $1.55 | 25d | 1 | 0.41mi |
| 4658 Commander Dr #834 Orlando, FL | 2.0 | 1.0 | 934 | $1,600 | $1.71 | 3d | 1 | 0.41mi |
| 5530 Chrishire Way Unit D202 Orlando, FL | 1.0 | 1.0 | 580 | $1,150 | $1.98 | 25d | 1 | 0.41mi |
| 5540 Devonbriar Way Unit H104 Orlando, FL | 1.0 | 1.0 | 660 | $1,195 | $1.81 | 16d | 1 | 0.41mi |
| 5540 Devonbriar Way Unit H104 Orlando, FL | 1.0 | 1.0 | 660 | $1,195 | $1.81 | 23d | 1 | 0.41mi |
| 5737 Gatlin Ave #423 Orlando, FL | 1.0 | 1.0 | 735 | $1,300 | $1.77 | 5d | 1 | 0.43mi |
HOA detail condo
- Monthly dues
- $287 · $3,444/yr
- Likely covers
- poolsecurity
- Assessments
- None detected in remarks — confirm with the listing agent.
Listing history 23 events
-
2026-06-21days on market $125,000 Active 159 DOM
-
2026-06-18days on market $125,000 Active 156 DOM
-
2026-06-17days on market $125,000 Active 155 DOM
-
2026-06-16days on market $125,000 Active 154 DOM
-
2026-06-15days on market $125,000 Active 153 DOM
-
2026-06-13days on market $125,000 Active 151 DOM
-
2026-06-13days on market $125,000 Active 150 DOM
-
2026-06-09days on market $125,000 Active 147 DOM
-
2026-06-08days on market $125,000 Active 146 DOM
-
2026-06-07days on market $125,000 Active 145 DOM
-
2026-06-04days on market $125,000 Active 142 DOM
-
2026-06-03days on market $125,000 Active 141 DOM
-
2026-06-02days on market $125,000 Active 140 DOM
-
2026-06-02days on market $125,000 Active 139 DOM
-
2026-05-31days on market $125,000 Active 138 DOM
-
2026-01-13$125,000 Active
-
2025-02-25historical
-
2024-08-23$140,000 Active
-
2012-10-26soldstatus $28,500 365-char remark
Show marketing remark (365 chars)
One Bedroom, One Bath Condo! Gated Community! Kitchen features a large pantry! Bedroom is large and includes a walk-in closet! AMAZING Pool! ~ Purchase this property for as little as 3% down! This property is approved for HomePath Renovation Mortgage. All information recorded in the MLS is intended to be accurate but cannot be guaranteed, buyer advised to verify.
-
2012-08-29$27,900 365-char remark
Show marketing remark (365 chars)
One Bedroom, One Bath Condo! Gated Community! Kitchen features a large pantry! Bedroom is large and includes a walk-in closet! AMAZING Pool! ~ Purchase this property for as little as 3% down! This property is approved for HomePath Renovation Mortgage. All information recorded in the MLS is intended to be accurate but cannot be guaranteed, buyer advised to verify.
-
2012-08-20historical
-
2010-09-01$25,000
-
2009-06-27$75,000
ⓘ Source: listings_history table (triggers on properties + properties_extension) + one-shot
backfill from property_details.listing_events for pre-trigger history.
Nearby sold comps map
Loading sold comps map…
Walkable amenities ~0.75 mi
Loading nearby amenities…
Taxation est. · year 1
- Rental income
- $16,634
- − Mortgage interest
- −$7,002
- − Property taxes
- −$1,875
- − Insurance
- −$625
- − Repairs & maintenance
- −$1,331
- − Management
- −$1,331
- − HOA
- −$3,444
- − Depreciation
- −$3,636
- Taxable loss
- −$2,610
- Est. tax savings @ 24.0%
- +$626
- After-tax cash flow
- $-43/yr
For passive investors: Depreciation is non-cash, so a rental often shows a tax loss while cash-flowing — sheltering income. Rental losses are passive: they offset passive income freely, and up to $25,000/yr can offset ordinary (W-2) income if you actively participate and your MAGI is under $100k (phasing out to $0 by $150k); unused losses carry forward. On sale, claimed depreciation is recaptured at up to 25%, and gains may owe capital-gains tax (a 1031 exchange can defer both). Figures are a year-1 estimate at your 24.0% rate — not tax advice; consult a CPA.
Schools (NCES district)
- District
- Orange
- NCES district ID
- 1201440
- Math proficiency
- 46% ▼ -9.00%
- Reading proficiency
- 51% ▼ -2.00%
- Median HH income
- $49,350
- Composite
- 41.47/100
- National rank
- #3461
- State rank
- #43 of 73 in FL
Livability — Orlando
- Score
- 86/100
- State rank
- #12
- US rank
- #360
Category grades
Schools grade is shown separately in the Schools card above.
Census & demographics
- Census place
- Orlando, FL
- County
- Orange County · 1,471,359 people
- City population
- 964,969
- Metro
- Orlando-Kissimmee-Sanford, FL
- Population (ZIP)
- 67,081
- Household income
- $56,540
- Rent vs Own
- Severe rent burden
- 4246.0
Population outlook (Orange County) Hauer SSP2
- Today (2025)
- 1,618,226 people
- By 2030
- 1,787,404 · +10.5%
- By 2040
- 2,125,621 · +31.4%
- By 2050
- 2,454,016 · +51.6%
- By 2075
- 3,173,711 · +96.1%
- By 2100
- 3,607,781 · +122.9%
Race, ethnicity, and origin ACS 2023
- Neighborhood character
- Predominantly Hispanic (68%)
- Race & ethnicity
- Hispanic / Latino 68% Two or more races 36% White 17% Black 10% Asian 2%
- Hispanic origin (detail)
- Mexican 2% Puerto Rican 38% Cuban 5% Dominican 5%
- Common ancestry
- Lithuanian 1% Romanian 1% Slovak 1%
- Foreign-born
- 27% · Canada, Jamaica, China
- Languages at home
- 36% English-only · Spanish 60% French/Haitian/Cajun 1% Arabic 1%
Political lean MEDSL · Orange
- 2024 margin
- D (+13.6) · D 56.1% · R 42.5% · Other 1.3%
- 2008→2024 swing
- -5.0pp toward R · 2008: 18.6pp · 2024: 13.6pp
- All cycles
- 2024: D+13.6 2020: D+23.1 2016: D+24.6 2012: D+18.2 2008: D+18.6
Not yet ingested
- Civics
- —
Market trends
- HPI YoY
- ▼ -95.17%
- Current HPI
- 355.5775
- Rent YoY
- ▼ -0.68%
- Metro
- Orlando-Kissimmee-Sanford, FL
- State GDP YoY
- ▲ 3.28%
- F500 in state
- 36
Industry mix (Fortune 500 HQ in FL)
| Industry | F500 HQs | Revenue |
|---|---|---|
| Industrial Technology | 2 | $29B |
|
||
| Insurance | 2 | $17B |
|
||
| Retail | 1 | $60B |
|
||
| Technology Distribution | 1 | $58B |
|
||
| Homebuilding | 1 | $35B |
|
||
| Technology Manufacturing | 1 | $35B |
|
||
Price history
+66.7% since first listed8 events — show timeline
- 2026-01-13 Listed $125,000 Stellar MLS as Distributed by MLS Grid
- 2025-02-25 Listing Removed — Stellar MLS as Distributed by MLS Grid
- 2024-08-23 Listed $140,000 Stellar MLS as Distributed by MLS Grid
- 2012-10-26 Sold (MLS) $28,500 Stellar MLS as Distributed by MLS Grid
- 2012-08-29 Listed $27,900 Stellar MLS as Distributed by MLS Grid
- 2012-08-20 Listing Removed — Stellar MLS as Distributed by MLS Grid
- 2010-09-01 Listed $25,000 Stellar MLS as Distributed by MLS Grid
- 2009-06-27 Listed $75,000 Stellar MLS as Distributed by MLS Grid
Property tax history
-5.5%/yrLatest (2025): $249 · +22.9% YoY. Source: county tax records.
Cash-flow waterfall
monthlySold comps — $/sqft
last 12 mo · ≤1 miLoading sold comps…