2609 W Southern Ave #135 · Tempe, AZ
Flood risk 1/10 · Minimal
- FEMA flood zone
- X (shaded)
- Chance of flooding over 30 yrs
- 0.0%
- Est. flood insurance / yr
- $507 – $1,088
Fire risk 4/10 · Minor
- Est. fire insurance / yr
- $610 – $1,132
Heat risk 9/10 · Severe
- Hot days now (above 111°F)
- 6 days/yr
- Hot days in 30 yrs
- 16 days/yr
Wind risk 1/10 · Minimal
- Chance of severe wind over 30 yrs
- —
Air-quality risk 2/10 · Minimal
- Unhealthy air days now
- 1 days/yr
- Unhealthy air days in 30 yrs
- 2 days/yr
Risk factors via First Street. Map © Google.
Why this score? — see what drove the B grade
The composite is a weighted blend of 9 inputs, each scored 0–100. Each bar is that input's sub-score; the figure is the points it added to the 100-point composite (weight × sub-score).
- Cash flow +30.0/30.0
- 1% rule +10.0/10.0
- DSCR +10.0/10.0
- ARV discount +8.8/15.0
- Livability +3.9/5.0
- Condition / age +3.8/5.0
- Rent growth +2.1/5.0
- Schools +2.0/10.0
- Appreciation +0.0/10.0
$67,900
🖨 Deal sheet (PDF) 📄 Offer letter ✓ Due diligence
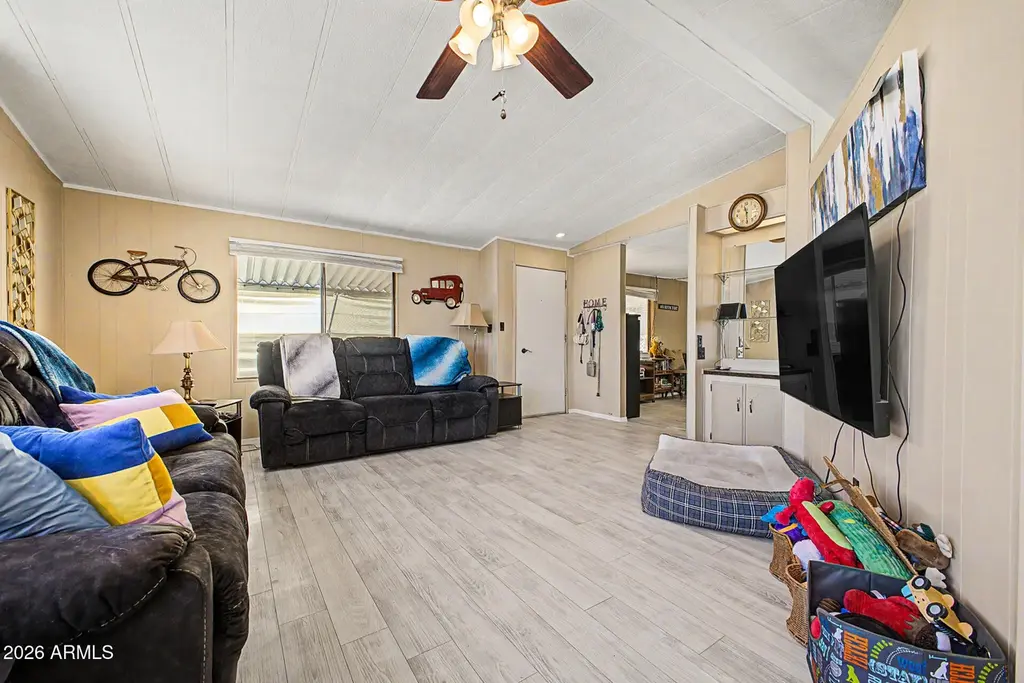
Listing remarks
Contempo Tempe, a vibrant 55+ community that may allow residents 40+ with park approval. This well-maintained 2-bedroom, 2-bath home features plank flooring throughout, spacious living areas, and a layout designed for entertaining. Enjoy a separate living room, great room, dining area, and a large kitchen with abundant cabinetry and pantry storage. The primary suite offers a walk-in shower and generous closet space, while the guest bedroom is roomy and inviting. A large laundry room includes extra cabinets, built-in desk. Outside, relax on the covered deck, enjoy the fenced backyard. Storage shed . Community amenities include a clubhouse, fitness center, pool, spa, and social activities. Co
Key facts
- 2 parking spots
- Community pool
- Built 1979
Property features AI
Finance
- Other: Directions provided by listing agent
- HOA & community: Land lease of $915 monthly; No association fees included; Community pool; Community spa (heated); Pickleball courts; Pickleball; Near bus stop; Community media room; Biking/walking path
Exterior
- Parking: 2 covered parking spaces; 2 carport spaces
- Security: Gated community
- Utilities: City water; Public sewer
- Home design: Leasehold ownership; Manufactured/mobile home
- Construction: Board & batten siding; Wood frame construction; Rolled/hot mop roof
- Exterior features: Balcony; Shed(s); Chain link fencing; Natural desert front landscaping; Natural desert back landscaping; Private maintained road; Asphalt road surface
Interior
- Kitchen: Refrigerator; Dishwasher; Garbage disposal; Built-in electric oven; Kitchen island; Pantry; Laminate counters; Eat-in kitchen
- Bedrooms: 2 possible bedrooms
- Flooring: Carpet; Laminate
- Bathrooms: 2 full bathrooms
- Heating & cooling: Electric heating; Central air conditioning; Has heating and cooling
- Interior features: High-speed internet; Eat-in kitchen; Kitchen island; Pantry; Full bathroom in primary bedroom; Laminate counters
- Laundry & utility: Owner-listed building area source
Neighborhood map
What this means for you Summary
Snapshot
- This is a 2-bed/2.0-bath manufactured listed at $68k. Condition is rated good.
Deal economics
- At list price, monthly cash flow is $1k ($12k/yr) — positive.
- The deal already cash-flows at list — no discount required.
- Meets the 1% rule at list price ($2k rent vs $68k).
- Recommended offer: $67k (1.5% below list) — sets the bar for market timing.
- Cap rate 24.0% vs local median 3.4% in Tempe — top-decile yield for the area; either an underpriced asset or a hidden risk that comps aren't pricing in. Stress-test before assuming the spread holds.
Location & tenants
- Location reads 78/100 on livability (#10 in AZ, #2,527 nationally) — a middle-class / working-renter tenant base. Strengths: amenities A+, commute A+, housing A+; Watch: cost of living C-, health & safety D, crime F.
- Tempe School District (4258) (urban): math 17% / reading 29% proficiency, ranked #170 of 249 in AZ (top 68%) — low school quality limits family demand, transient renter base, plan for 1-2y turnover.
- Zoned schools: Ward Traditional Academy (math 54% / reading 65%, grade B-, #148 of 1,109 statewide, top 15%, 377 students, 25% FRL); Geneva Epps Mosley Middle School (math 6% / reading 14%, grade F, #188 of 218 statewide, top 88%, 755 students, 72% FRL); Tempe High School (math 13% / reading 19%, grade F, #258 of 381 statewide, top 68%, 1,584 students, 51% FRL).
- Market conditions: Rents soft (-1.6%/yr); 181 active listings in the ZIP; 40 comparable units currently listed for rent nearby; rentals leasing fast (median 0d on market — plan ~1-2 weeks tenant-placement turnaround); solid renter incomes; 36,011 units permitted in Maricopa County in 2024 (12,801 in 5+ unit buildings).
Forward outlook
- Local home prices are declining (-3.0%/yr); year-one equity from $469 of loan paydown is wiped out by about $2k of value loss. Plan a longer hold.
- Maricopa County population projected at +38% by 2050 — long-run rental-demand tailwind backs the buy-and-hold thesis.
- At projected returns (-3.0% appreciation + 0.0% rent growth), your $19k cash investment doubles in ~2 years — after that, you're playing with house money.
Negotiation context
- It's been on market 20 days — a 2% lower offer ($67k) is reasonable based on typical stale-listing flexibility.
Risks & watch-outs
- Climate carrying-cost: extreme-heat days projected 6→16/yr by 2055 (HVAC capex compounding) — expect insurance premiums to compound above CPI over the hold.
Questions for the listing agent
- Built in 1979 — when were the roof, HVAC, electrical panel, plumbing, and water heater last replaced?
- Is there a deadline driving the sale (1031 exchange, divorce, estate, relocation)? That informs how much negotiation room exists.
- Crime grade is F in this area — have there been break-ins, vandalism, or insurance claims at this property in the last 3 years? What carrier currently insures it and at what premium?
- What's the average days-on-market for RENTAL listings here right now (not sales)? A rising rental-DOM trend means longer vacancies and softer asking-rent achievability than the comps imply.
- What's the recent tenant-quality profile in this submarket — average credit score on applications, eviction rate, late-payment / NSF rate, and stable-employment percentage? A property-management company in the area should have these aggregated.
- How much new for-sale + rental construction is in the pipeline within 1–3 miles? Heavy new supply typically softens prices + rents 12–24 months out; constrained supply supports both.
Investment metrics
- 1% rule
- 2.74% ✓
- Cap rate
- 23.99%
- Cash-on-cash
- 63.20%
- DSCR
- 3.81
- GRM
- 3.0
CMA / ARV
- ARV (on-the-fly)
- $69,888
- Comps found
- 12
Show comp detail 12 sales within ~0.75 mi
| Address | Dist | Beds/Ba | Sqft | Sold | Price | $/sf | Match |
|---|---|---|---|---|---|---|---|
| 2609 W Southern Ave #379 | 0.00mi | 2/2.0 | 1,180 (-5%) | 1mo | $135,000 | $114 | 90 |
| 2609 W Southern Ave #335 | 0.05mi | 2/2.0 | 1,248 (0%) | 12mo | $76,000 | $61 | 87 |
| 2609 W Southern Ave #398 | 0.00mi | 2/2.0 | 1,344 (+8%) | 2mo | $17,500 | $13 | 85 |
| 2609 W Southern Ave #441 | 0.00mi | 2/2.0 | 1,152 (-8%) | 3mo | $60,000 | $52 | 85 |
| 2401 W Southern Ave #481 | 0.30mi | 2/2.0 | 1,248 (0%) | 2mo | $45,000 | $36 | 84 |
| 2609 W Southern Ave #90 | 0.05mi | 2/1.5 | 1,344 (+8%) | 1mo | $38,000 | $28 | 82 |
| 2609 W Southern Ave #117 | 0.05mi | 2/2.0 | 1,152 (-8%) | 9mo | $125,000 | $109 | 77 |
| 2609 W Southern Ave #201 | 0.05mi | 2/2.0 | 1,152 (-8%) | 14mo | $65,000 | $56 | 73 |
| 2609 W Southern Ave #108 | 0.05mi | 3/1.5 (+1) | 1,120 (-10%) | 2mo | $55,000 | $49 | 72 |
| 2401 W Southern Ave #113 | 0.29mi | 2/2.0 | 1,344 (+8%) | 5mo | $86,000 | $64 | 69 |
| 2609 W Southern Ave #221 | 0.05mi | 3/2.0 (+1) | 1,344 (+8%) | 13mo | $75,500 | $56 | 69 |
| 2401 W Southern Ave #204 | 0.23mi | 2/2.0 | 1,120 (-10%) | 9mo | $69,900 | $62 | 65 |
Match score weights: distance 35% · size 25% · config 20% · recency 20%. Top-matched comps best support the ARV.
Projected returns pro-forma
-3.0% appreciation · 0.0% rent growth · sell at horizon
- IRR
- 58.8%
- Equity multiple
- 3.49×
- Total profit
- $47,342
- Equity at exit
- $10,124
- IRR
- 62.5%
- Equity multiple
- 6.38×
- Total profit
- $102,373
- Equity at exit
- $5,871
Cash invested: $19,012 (down + closing). Projections, not guarantees.
Landlord ↔ Tenant lean methodology
- Overall (STATE)
- 87 Strongly Landlord-Friendly
- State Arizona
- 87 Strongly Landlord-Friendly · R+3
- County
- — inherits STATE
- City
- — inherits STATE
ZIP-level market 85282
- Rents YoY
- -1.6%
- Active inventory
- 181
- Price-to-rent
- 3.0×
Monthly cashflow live
- Estimated rent
- $1,861 high interval (Pro) →
- Mortgage (P&I)
- −$356
- Tax est. 1.5%
- −$85 /mo · $1,018/yr
- Insurance
- −$28
- HOA
- −$0
- Vacancy / Maint / Mgmt
- −$391
- Net cashflow
- $1,001
Break-even live
Sensitivity live
| Price | -10% $1,048 | -5% $1,025 | +0% $1,001 | +5% $978 | +10% $954 |
|---|---|---|---|---|---|
| Rent | -10% $854 | -5% $928 | +0% $1,001 | +5% $1,075 | +10% $1,148 |
| Rate | -1.0pp $1,035 | -0.5pp $1,019 | base $1,001 | +0.5pp $984 | +1.0pp $966 |
UW: 25.0% down · 7.5% · 30yr · 1.5% tax · 5.0% vac · 8.0% maint · 8.0% mgmt
Financing live
Cash to close
- Down payment
- $16,975
- Closing costs
- $2,037
- Reserves months
- —
- Total cash needed
- —
Loan-product check · same deal, 3 products live
Conventional
25% down · 7.5% · 30yr
- Down + closing
- —
- Monthly P&I
- —
- Monthly cashflow
- —
- DSCR
- —
- Eligible?
- —
Personal DTI + credit; lowest rate.
DSCR
20% down · 8.5% · 30yr
- Down + closing
- —
- Monthly P&I
- —
- Monthly cashflow
- —
- DSCR
- —
- Eligible?
- —
No personal income docs; deal must DSCR.
Hard money
10% down · 12.0% · 12mo
- Down + closing
- —
- Monthly P&I
- —
- Monthly cashflow
- —
- DSCR
- —
- Eligible?
- —
Short-term bridge; refi at stabilization.
Rent comps 40 comps
| Address | Beds | Baths | Sqft | Rent | $/sqft | DOM | Units | Dist |
|---|---|---|---|---|---|---|---|---|
| 2381 W Garden Dr #2357 Tempe, AZ | 3.0 | 2.0 | 1442 | $2,199 | $1.52 | 19d | 1 | 0.46mi |
| 2381 W Garden Dr #2365 Tempe, AZ | 3.0 | 2.0 | 1442 | $2,300 | $1.60 | 0d | 1 | 0.46mi |
| 4365 S Potter Dr Tempe, AZ | 2.0 | 2.0 | 1218 | $1,985 | $1.63 | 0d | 1 | 0.46mi |
| 2348 W Garden Dr Tempe, AZ | 3.0 | 2.0 | 1398 | $1,100 | $0.79 | 18d | 1 | 0.47mi |
| 4389 S Potter Dr Tempe, AZ | 3.0 | 2.5 | 1396 | $2,150 | $1.54 | 0d | 1 | 0.48mi |
| 2349 W Garden Dr Tempe, AZ | 3.0 | 2.0 | 1396 | $2,030 | $1.45 | 0d | 1 | 0.48mi |
| 1812 W Village Way Tempe, AZ | 3.0 | 1.5 | 1148 | $2,075 | $1.81 | 3d | 1 | 0.52mi |
| 1818 W Village Way Tempe, AZ | 3.0 | 2.5 | 1148 | $2,150 | $1.87 | 12d | 1 | 0.52mi |
| 2150 W Alameda Dr Tempe, AZ | 2.0 | 2.5 | 1155 | $1,899 | $1.64 | 23d | 1 | 0.56mi |
| 1688 W Village Way Tempe, AZ | 2.0 | 2.0 | 894 | $1,650 | $1.85 | 0d | 1 | 0.58mi |
| 2326 W Carson Dr Tempe, AZ | 3.0 | 2.0 | 1050 | $1,925 | $1.83 | 0d | 1 | 0.60mi |
| 2401 W Fremont Dr Tempe, AZ | 2.0 | 2.0 | 1074 | $1,700 | $1.58 | 3d | 1 | 0.67mi |
| 3226 S Albert Ave Tempe, AZ | 3.0 | 2.0 | 1410 | $1,500 | $1.06 | 0d | 1 | 0.70mi |
| 2231 W Fremont Dr Tempe, AZ | 3.0 | 2.0 | 1204 | $1,900 | $1.58 | 0d | 1 | 0.70mi |
| 2231 W Fremont Dr Tempe, AZ | 3.0 | 2.0 | 1204 | $1,950 | $1.62 | 16d | 1 | 0.70mi |
| 2231 W Fremont Dr Tempe, AZ | 3.0 | 2.0 | 1204 | $1,900 | $1.58 | 12d | 1 | 0.70mi |
| 1600 E La Jolla Dr Tempe, AZ | 1.0–3.0 | 1.0–2.0 | 881 | $1,808 | $2.05 | 0d | 28 | 0.72mi |
| 1600 W La Jolla Dr Tempe, AZ | 2.0 | 2.0 | 948 | $1,809 | $1.91 | 5d | 1 | 0.77mi |
| 1600 W La Jolla Dr Tempe, AZ | 2.0 | 2.0 | 948 | $1,776 | $1.87 | 3d | 1 | 0.77mi |
| 1440 W La Jolla Dr Tempe, AZ | 2.0 | 1.5 | 1075 | $1,950 | $1.81 | 0d | 1 | 0.77mi |
| 4328 E Saint Catherine Ave Phoenix, AZ | 3.0 | 2.0 | 1272 | $2,000 | $1.57 | 0d | 1 | 0.78mi |
| 4901 S Calle Los Cerros Dr Tempe, AZ | 1.0–2.0 | 1.0–2.0 | 868 | $1,995 | $2.30 | 3d | 3 | 0.78mi |
| 4901 S Calle Los Cerros Dr Tempe, AZ | 1.0–2.0 | 1.0–2.0 | 868 | $1,995 | $2.30 | 0d | 3 | 0.78mi |
| 4312 E Burgess Ln Phoenix, AZ | 3.0 | 2.0 | 1025 | $1,675 | $1.63 | 0d | 1 | 0.83mi |
| 7409 S 46th St Phoenix, AZ | 3.0 | 2.0 | 1120 | $1,975 | $1.76 | 16d | 1 | 0.94mi |
| 4163 E Pecan Rd Phoenix, AZ | 3.0 | 2.0 | 1182 | $1,999 | $1.69 | 16d | 1 | 0.96mi |
| 7027 S 43rd Way Phoenix, AZ | 3.0 | 2.0 | 1203 | $2,200 | $1.83 | 25d | 1 | 0.98mi |
| 4424 E Baseline Rd Phoenix, AZ | 1.0–3.0 | 1.0–2.0 | 930 | $1,532 | $1.65 | 0d | 52 | 1.03mi |
| 2520 S Plaza Dr Tempe, AZ | 3.0 | 1.0–2.0 | 950 | $1,850 | $1.95 | 0d | 20 | 1.03mi |
| 2520 S Plaza Dr Tempe, AZ | 3.0 | 1.0–2.0 | 950 | $1,901 | $2.00 | 12d | 19 | 1.03mi |
| 4005 E La Salle St Phoenix, AZ | 3.0 | 2.0 | 1149 | $1,859 | $1.62 | 21d | 1 | 1.20mi |
| 2100 S Priest Dr Unit 1386547P Tempe, AZ | 2.0–3.0 | 2.0 | 973 | $2,196 | $2.26 | 6d | 2 | 1.22mi |
| 4839 S Darrow Dr Tempe, AZ | 1.0–2.0 | 1.0–2.0 | 712 | $1,695 | $2.38 | 0d | 12 | 1.26mi |
| 4441 E Wood St Phoenix, AZ | 3.0 | 1.5 | 1008 | $1,295 | $1.28 | 14d | 1 | 1.27mi |
| 4514 E Riverside St Phoenix, AZ | 2.0 | 1.0 | 1008 | $995 | $0.99 | 0d | 1 | 1.28mi |
| 4410 E Pueblo Ave Phoenix, AZ | 2.0 | 1.0 | 792 | $1,400 | $1.77 | 0d | 1 | 1.29mi |
| 4035 S 45th Pl Phoenix, AZ | 2.0 | 1.0 | 792 | $1,300 | $1.64 | 0d | 1 | 1.29mi |
| 4615 E Jones Ave Phoenix, AZ | 3.0 | 1.0 | 1008 | $1,400 | $1.39 | 0d | 1 | 1.30mi |
| 4420 E Wood St Phoenix, AZ | 2.0 | 1.5 | 1016 | $1,300 | $1.28 | 0d | 1 | 1.32mi |
| 1222 W Baseline Rd #261 Tempe, AZ | 2.0 | 2.0 | 980 | $1,400 | $1.43 | 0d | 1 | 1.34mi |
Listing history 14 events
-
2026-06-21days on market $67,900 Active 20 DOM
-
2026-06-18days on market $67,900 Active 17 DOM
-
2026-06-17days on market $67,900 Active 16 DOM
-
2026-06-16days on market $67,900 Active 15 DOM
-
2026-06-15days on market $67,900 Active 14 DOM
-
2026-06-13days on market $67,900 Active 12 DOM
-
2026-06-13days on market $67,900 Active 11 DOM
-
2026-06-09days on market $67,900 Active 8 DOM
-
2026-06-08days on market $67,900 Active 7 DOM
-
2026-06-07days on market $67,900 Active 6 DOM
-
2026-06-04days on market $67,900 Active 3 DOM
-
2026-06-03days on market $67,900 Active 2 DOM
-
2026-06-01remarks 699-char remark
-
2026-06-01$67,900 Active 1 DOM
ⓘ Source: listings_history table (triggers on properties + properties_extension) + one-shot
backfill from property_details.listing_events for pre-trigger history.
Climate risk First Street
- Flood 1/10 Low FEMA zone X (shaded) · 0% chance over 30 yrs
- Wildfire 4/10 Moderate
- Heat 9/10 Extreme 6 d/yr ≥111°F today · 16 d/yr by 30 yrs out
- Wind 1/10 Low
- Air quality 2/10 Low 1 unhealthy d/yr today · 2 by 30 yrs out
Nearby sold comps map
Loading sold comps map…
Walkable amenities ~0.75 mi
Loading nearby amenities…
Taxation est. · year 1
- Rental income
- $22,337
- − Mortgage interest
- −$3,803
- − Property taxes
- −$1,018
- − Insurance
- −$340
- − Repairs & maintenance
- −$1,787
- − Management
- −$1,787
- − Depreciation
- −$1,975
- Taxable income
- $11,626
- Est. tax owed @ 24.0%
- −$2,790
- After-tax cash flow
- $9,225/yr
For passive investors: Depreciation is non-cash, so a rental often shows a tax loss while cash-flowing — sheltering income. Rental losses are passive: they offset passive income freely, and up to $25,000/yr can offset ordinary (W-2) income if you actively participate and your MAGI is under $100k (phasing out to $0 by $150k); unused losses carry forward. On sale, claimed depreciation is recaptured at up to 25%, and gains may owe capital-gains tax (a 1031 exchange can defer both). Figures are a year-1 estimate at your 24.0% rate — not tax advice; consult a CPA.
Condition & rehab AI · 12 photos
This well-maintained 2-bedroom, 2-bath home in Contempo Tempe offers a good condition with plank flooring and ample storage. It's ready for a fresh coat of paint and energy-efficient updates to boost its value.
Value-add opportunities
- Both Paint the exterior — Enhances curb appeal and resale value
- Both Replace ceiling fans with energy-efficient models — Improves energy efficiency and aesthetics
- Both Install a smart thermostat — Saves energy and enhances comfort
Renovation cost estimate screening
Value-add ROI direction
- Both Paint the exterior — Enhances curb appeal and resale value ↑
- Both Replace ceiling fans with energy-efficient models — Improves energy efficiency and aesthetics ↑
- Both Install a smart thermostat — Saves energy and enhances comfort ↑
ⓘ Cost ranges are severity-bucket heuristics (US national rule-of-thumb). Get contractor quotes + a written scope before underwriting a rehab budget.
Schools (NCES district)
- District
- Tempe School District (4258)
- NCES district ID
- 0408310
- Math proficiency
- 17% ▼ -19.00%
- Reading proficiency
- 29% ▼ -10.00%
- Median HH income
- $43,112
- Composite
- 19.7/100
- National rank
- #8721
- State rank
- #170 of 249 in AZ
Livability — Tempe
- Score
- 78/100
- State rank
- #10
- US rank
- #2527
Category grades
Schools grade is shown separately in the Schools card above.
Census & demographics
- Census place
- Tempe, AZ
- County
- Maricopa County · 4,537,380 people
- City population
- 193,337
- Metro
- Phoenix-Mesa-Chandler, AZ
- Population (ZIP)
- 53,624
- Household income
- $79,036
- Rent vs Own
- Severe rent burden
- 2973.0
Population outlook (Maricopa County) Hauer SSP2
- Today (2025)
- 4,979,203 people
- By 2030
- 5,378,229 · +8.0%
- By 2040
- 6,156,598 · +23.6%
- By 2050
- 6,872,376 · +38.0%
- By 2075
- 8,401,270 · +68.7%
- By 2100
- 9,247,439 · +85.7%
Race, ethnicity, and origin ACS 2023
- Neighborhood character
- Diverse neighborhood (Simpson 0.65)
- Race & ethnicity
- White 52% Hispanic / Latino 25% Two or more races 13% Black 9% Asian 6% Native American 3%
- Hispanic origin (detail)
- Mexican 19%
- Common ancestry
- Italian 2% Romanian 2% Lithuanian 2%
- Foreign-born
- 11% · Canada, China, Vietnam
- Languages at home
- 79% English-only · Spanish 12% Chinese 1% Other Asian/Pacific 1%
Political lean MEDSL · Maricopa
- 2024 margin
- Toss-up / Even · D 47.7% · R 51.2% · Other 1.1%
- 2008→2024 swing
- +7.1pp toward D · 2008: -10.6pp · 2024: -3.5pp
- All cycles
- 2024: R+3.5 2020: D+2.2 2016: R+3.5 2012: R+12.0 2008: R+10.6
Not yet ingested
- Civics
- —
Market trends
- HPI YoY
- ▼ -343.77%
- Current HPI
- 353.6986
- Rent YoY
- ▼ -1.61%
- Metro
- Phoenix-Mesa-Chandler, AZ
- State GDP YoY
- ▲ 4.54%
- F500 in state
- 20
Industry mix (Fortune 500 HQ in AZ)
| Industry | F500 HQs | Revenue |
|---|---|---|
| Technology | 2 | $13B |
|
||
| Mining / Metals | 1 | $23B |
|
||
| Environmental Services | 1 | $16B |
|
||
| Metals / Steel | 1 | $14B |
|
||
| Technology Distribution | 1 | $9B |
|
||
| Homebuilding | 1 | $8B |
|
||
Price history
1 event — show timeline
- 2026-06-01 Listed $67,900 ARMLS
Cash-flow waterfall
monthlySold comps — $/sqft
last 12 mo · ≤1 miLoading sold comps…