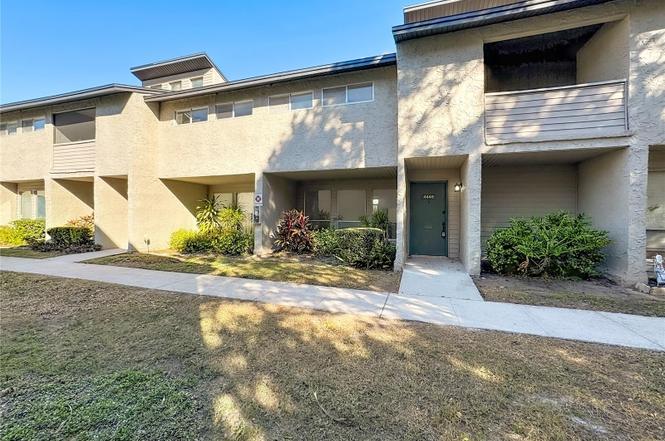
4445 Rayfield Dr · Desoto Acres, FL
Flood risk 1/10 · Minimal
- FEMA flood zone
- X (unshaded)
- Chance of flooding over 30 yrs
- 0.0%
- Est. flood insurance / yr
- $507 – $1,088
Fire risk 1/10 · Minimal
- Est. fire insurance / yr
- $947 – $1,759
Heat risk 10/10 · Severe
- Hot days now (above 107°F)
- 7 days/yr
- Hot days in 30 yrs
- 30 days/yr
Wind risk 10/10 · Severe
- Chance of severe wind over 30 yrs
- 99.0%
Air-quality risk 2/10 · Minimal
- Unhealthy air days now
- 1 days/yr
- Unhealthy air days in 30 yrs
- 1 days/yr
Risk factors via First Street. Map © Google.
Why this score? — see what drove the C+ grade
The composite is a weighted blend of 9 inputs, each scored 0–100. Each bar is that input's sub-score; the figure is the points it added to the 100-point composite (weight × sub-score).
- Cash flow +25.5/30.0
- 1% rule +9.7/10.0
- DSCR +8.5/10.0
- ARV discount +7.5/15.0
- Schools +4.4/10.0
- Livability +2.5/5.0
- Condition / age +2.5/5.0
- Rent growth +1.5/5.0
- Appreciation +0.0/10.0
$179,000
🖨 Deal sheet 📄 Offer letter ✓ Due diligence
Listing remarks
Under contract-accepting backup offers. Virtually Staged. This is the lowest-priced fully renovated unit in the community, positioned approximately $24,000 below market value for an immediate sale. This completely remodeled three-bedroom, two-story condo offers a spacious layout that feels more like a single-family home, featuring soaring ceilings and an abundance of natural light. The main level includes a generous living area, dedicated dining space, and a chef-inspired kitchen complete with new cabinetry, quartz countertops, and brand-new stainless steel appliances. A convenient half-bath and a private outdoor patio complete the first floor. Upstairs, all three bedrooms are positioned fo
Key facts
- Quartz countertops
- Balcony access
- Soaring ceilings
Tags
Property features AI
Finance
- Other: Total living area 1,520 square feet
- Financial info: Lease restrictions apply; Partially furnished
- HOA & community: HOA managed by HOMEPORT MGMT SRVCS; Monthly association fee of $597.35; Association fees cover cable TV, escrow reserves, insurance, internet, structure and grounds maintenance, pest control, sewer and trash; Pool; Tennis courts; Community mailbox; Sidewalks; Deed restrictions; Pets allowed with breed restrictions
Exterior
- Utilities: Public water; Public sewer; Cable connected; Electricity connected; Sewer connected; Water connected
- Home design: Townhouse; Residential property; Two levels; Faces east
- Construction: Stucco construction; Shingle roof; Other roof type; Other foundation
- Exterior features: Porch; Screened porch; Other exterior features; Paved road access
Interior
- Kitchen: Range; Refrigerator
- Bedrooms: 3 bedrooms
- Flooring: Carpet; Wood
- Bathrooms: 2 full bathrooms; 1 half bathroom
- Heating & cooling: Central heating; Central air conditioning
- Interior features: Split bedroom layout; Six total rooms
- Laundry & utility: Laundry room inside
Neighborhood map
What this means for you Summary
Snapshot
- This is a 3-bed/2.5-bath condo listed at $179k.
Deal economics
- At list price, monthly cash flow is $420 ($5k/yr) — positive.
- The deal already cash-flows at list — no discount required.
- Meets the 1% rule at list price ($3k rent vs $179k).
- Recommended offer: $163k (9.0% below list) — sets the bar for market timing.
- Cap rate 9.1% vs local median 4.0% in Desoto Acres — top-decile yield for the area; either an underpriced asset or a hidden risk that comps aren't pricing in. Stress-test before assuming the spread holds.
Location & tenants
- Location reads: area grade C — affects rentability + tenant quality, not the cash-flow math above.
- Manatee (suburban): math 54% / reading 50% proficiency, ranked #26 of 73 in FL (top 36%) — acceptable for families but not a draw, mixed tenant base, ~2y average lease.
- Market conditions: Rents falling (-4.1%/yr); 386 active listings in the ZIP; 40 comparable units currently listed for rent nearby; rentals at typical pace (median 24d on market — plan ~3-4 weeks tenant-placement turnaround); solid renter incomes; 7,472 units permitted in Manatee County in 2024 (1,782 in 5+ unit buildings).
- This rent runs 39% of the median local income ($81k/yr) — at the standard rent-burdened threshold; future hikes will face affordability resistance.
Forward outlook
- Local home prices are declining (-3.0%/yr); year-one equity from $1k of loan paydown is wiped out by about $5k of value loss. Plan a longer hold.
- Manatee County population projected at +43% by 2050 — long-run rental-demand tailwind backs the buy-and-hold thesis.
Negotiation context
- It's been on market 96 days — a 9% lower offer ($163k) is reasonable based on typical stale-listing flexibility.
- 4 sale attempts with the ask held roughly flat each time — persistent listings suggest the price (not the market) is what's stuck; bring a comps-based counter.
- Current owner paid $68k; list at $179k implies a 163% gain — meaningful room to come down on a strong offer.
Risks & watch-outs
- Watch-outs: HOA is 23% of rent.
- Climate carrying-cost: severe wind risk, 99% chance of damaging wind over 30y; extreme-heat days projected 7→30/yr by 2055 (HVAC capex compounding) — expect insurance premiums to compound above CPI over the hold.
Questions for the listing agent
- It's been on market 96 days. Have you received any prior offers? Is the seller open to a 9% concession, seller financing, or rate buy-down credit?
- Built in 1974 — when were the roof, HVAC, electrical panel, plumbing, and water heater last replaced?
- What does the HOA fee cover, when was the last increase, and are there any pending special assessments or reserve-fund shortfalls?
- Any open or pending special assessments — roof, HVAC, plumbing, elevator, façade? What's the per-unit balance and payoff schedule, and is the seller paying it off at close or rolling it to the buyer?
- Why hasn't it sold? Are there any deal-killer items the seller is aware of (foundation, flood, title, zoning, code violations)?
- Is there a deadline driving the sale (1031 exchange, divorce, estate, relocation)? That informs how much negotiation room exists.
- What's the average days-on-market for RENTAL listings here right now (not sales)? A rising rental-DOM trend means longer vacancies and softer asking-rent achievability than the comps imply.
- What's the recent tenant-quality profile in this submarket — average credit score on applications, eviction rate, late-payment / NSF rate, and stable-employment percentage? A property-management company in the area should have these aggregated.
- How much new apartment / multifamily construction is in the pipeline within 1–3 miles? Heavy new supply (>2% of stock underway) typically softens rents 12–24 months out; light construction supports rent growth.
Investment metrics
- 1% rule
- 1.47% ✓
- Cap rate
- 9.11%
- Cash-on-cash
- 10.07%
- DSCR
- 1.45
- GRM
- 5.7
CMA / ARV
No comps found within radius.
Projected returns pro-forma
-3.0% appreciation · 0.0% rent growth · sell at horizon
- IRR
- -5.4%
- Equity multiple
- 0.81×
- Total profit
- $-9,655
- Equity at exit
- $26,689
- IRR
- -0.9%
- Equity multiple
- 0.95×
- Total profit
- $-2,566
- Equity at exit
- $15,477
Cash invested: $50,120 (down + closing). Projections, not guarantees.
Landlord ↔ Tenant lean methodology
- Overall (STATE)
- 87 Strongly Landlord-Friendly
- State Florida
- 87 Strongly Landlord-Friendly · R+3
- County
- — inherits STATE
- City
- — inherits STATE
ZIP-level market 34243
- Home prices YoY
- -23.0%
- Rents YoY
- -4.1%
- Active inventory
- 386
- Price-to-rent
- 5.7×
Monthly cashflow live
- Estimated rent
- $2,637 high interval (Pro) →
- Mortgage (P&I)
- −$939
- Tax from tax record
- −$52 /mo · $626/yr
- Insurance
- −$75
- HOA
- −$597
- Vacancy / Maint / Mgmt
- −$554
- Net cashflow
- $420
Break-even live
UW: 25.0% down · 7.5% · 30yr · 1.5% tax · 5.0% vac · 8.0% maint · 8.0% mgmt
Financing live
Cash to close
- Down payment
- $44,750
- Closing costs
- $5,370
- Reserves months
- —
- Total cash needed
- —
Loan-product check · same deal, 3 products live
Conventional
25% down · 7.5% · 30yr
- Down + closing
- —
- Monthly P&I
- —
- Monthly cashflow
- —
- DSCR
- —
- Eligible?
- —
Personal DTI + credit; lowest rate.
DSCR
20% down · 8.5% · 30yr
- Down + closing
- —
- Monthly P&I
- —
- Monthly cashflow
- —
- DSCR
- —
- Eligible?
- —
No personal income docs; deal must DSCR.
Hard money
10% down · 12.0% · 12mo
- Down + closing
- —
- Monthly P&I
- —
- Monthly cashflow
- —
- DSCR
- —
- Eligible?
- —
Short-term bridge; refi at stabilization.
Rent comps 40 comps
| Address | Beds | Baths | Sqft | Rent | $/sqft | DOM | Units | Dist |
|---|---|---|---|---|---|---|---|---|
| 4455 Rayfield Dr Sarasota, FL | 2.0 | 2.5 | 1143 | $2,210 | $1.93 | 23d | 1 | 0.08mi |
| 4208 76th Dr E Sarasota, FL | 3.0 | 2.0 | 1350 | $2,645 | $1.96 | 2d | 1 | 0.20mi |
| 7887 Lockwood Ridge Rd Sarasota, FL | 1.0–2.0 | 1.0–2.0 | 916 | $2,297 | $2.51 | 2d | 16 | 0.38mi |
| 7885 N Lockwood Ridge Rd Unit 827 Sarasota, FL | 2.0 | 2.0 | 1177 | $1,799 | $1.53 | 23d | 1 | 0.44mi |
| 7234 Eleanor Cir #203 Sarasota, FL | 2.0 | 2.0 | 1064 | $2,150 | $2.02 | 16d | 1 | 0.59mi |
| 5008 Medalist Rd Sarasota, FL | 3.0 | 2.0 | 1824 | $3,000 | $1.64 | 23d | 1 | 0.60mi |
| 3612 75th Dr E Sarasota, FL | 3.0 | 2.0 | 1245 | $3,050 | $2.45 | 23d | 1 | 0.61mi |
| 7452 W Country Club Dr N Unit 1546435P Sarasota, FL | 2.0 | 2.0 | 1173 | $2,742 | $2.34 | 11d | 1 | 0.62mi |
| 7405 W Country Club Dr N #104 Sarasota, FL | 3.0 | 2.0 | 1444 | $3,200 | $2.22 | 23d | 1 | 0.68mi |
| 7351 W Country Club Dr N #202 Sarasota, FL | 2.0 | 2.0 | 1118 | $4,300 | $3.85 | 23d | 1 | 0.70mi |
| 5217 Canterbury Dr Sarasota, FL | 3.0 | 2.0 | 2146 | $2,800 | $1.30 | 23d | 1 | 0.74mi |
| 7251 W Country Club Dr N #226 Sarasota, FL | 2.0 | 2.0 | 1118 | $2,000 | $1.79 | 23d | 1 | 0.75mi |
| 5219 Inverness Dr Sarasota, FL | 3.0 | 2.0 | 1933 | $3,200 | $1.66 | 23d | 1 | 0.79mi |
| 3540 74th Avenue Cir E Sarasota, FL | 4.0 | 2.0 | 1701 | $2,595 | $1.53 | 14d | 1 | 0.86mi |
| 3540 74th Avenue Cir E Sarasota, FL | 4.0 | 2.0 | 1701 | $2,700 | $1.59 | 23d | 1 | 0.86mi |
| 7715 33rd Ln E Sarasota, FL | 3.0 | 2.0 | 1935 | $2,450 | $1.27 | 11d | 1 | 0.90mi |
| 3770 82nd Avenue Cir E #103 Sarasota, FL | 3.0 | 2.5 | 1661 | $2,150 | $1.29 | 23d | 1 | 0.90mi |
| 3756 82nd Avenue Cir E #101 Sarasota, FL | 3.0 | 2.5 | 1661 | $2,300 | $1.38 | 23d | 1 | 0.91mi |
| 7710 33rd Ln E Sarasota, FL | 3.0 | 2.0 | 1547 | $3,300 | $2.13 | 23d | 1 | 0.92mi |
| 3750 82nd Avenue Cir E #104 Sarasota, FL | 3.0 | 2.5 | 1661 | $2,750 | $1.66 | 23d | 1 | 0.93mi |
| 4665 Whitfield Ave Sarasota, FL | 1.0–3.0 | 1.0–2.0 | 1023 | $2,990 | $2.92 | 2d | 59 | 0.93mi |
| 3746 82nd Avenue Cir E Unit E102 Sarasota, FL | 3.0 | 2.5 | 1661 | $2,050 | $1.23 | 11d | 1 | 0.96mi |
| 3746 82nd Avenue Cir E #102 Sarasota, FL | 3.0 | 3.0 | 1661 | $2,050 | $1.23 | 3d | 1 | 0.96mi |
| 5409 Palm Aire Dr Sarasota, FL | 3.0 | 2.0 | 2098 | $3,500 | $1.67 | 23d | 1 | 0.98mi |
| 3810 82nd Avenue Cir E #102 Sarasota, FL | 3.0 | 2.5 | 1661 | $3,200 | $1.93 | 23d | 1 | 0.98mi |
| 7050 W Country Club Dr N Unit 10-A Sarasota, FL | 2.0 | 2.0 | 1118 | $4,300 | $3.85 | 23d | 1 | 0.98mi |
| 3740 82nd Avenue Cir E #102 Sarasota, FL | 3.0 | 2.5 | 1661 | $3,500 | $2.11 | 23d | 1 | 0.98mi |
| 5581 Golf Pointe Dr Sarasota, FL | 2.0 | 2.0 | 2154 | $2,600 | $1.21 | 23d | 1 | 1.00mi |
| 8240 Cypress Lake Dr Sarasota, FL | 4.0 | 3.0 | 1993 | $4,750 | $2.38 | 16d | 1 | 1.01mi |
| 3736 82nd Avenue Cir E #105 Sarasota, FL | 3.0 | 2.5 | 1661 | $2,200 | $1.32 | 23d | 1 | 1.01mi |
| 3716 82nd Avenue Cir E #102 Sarasota, FL | 3.0 | 2.5 | 1661 | $4,200 | $2.53 | 23d | 1 | 1.03mi |
| 3880 82nd Avenue Cir E #101 Sarasota, FL | 3.0 | 2.5 | 1661 | $3,250 | $1.96 | 23d | 1 | 1.05mi |
| 3045 Broadway Ave Sarasota, FL | 1.0–2.0 | 1.0–2.0 | 865 | $2,480 | $2.87 | 10d | 31 | 1.05mi |
| 5025 82nd Way E Sarasota, FL | 3.0 | 2.0 | 1321 | $2,250 | $1.70 | 23d | 1 | 1.05mi |
| 3870 82nd Avenue Cir E #104 Sarasota, FL | 3.0 | 2.5 | 1661 | $2,100 | $1.26 | 2d | 1 | 1.05mi |
| 7008 W Country Club Dr N Unit 136 Sarasota, FL | 2.0 | 2.0 | 1118 | $1,875 | $1.68 | 23d | 1 | 1.06mi |
| 3617 82nd Pl E Sarasota, FL | 3.0 | 2.0 | 1858 | $2,700 | $1.45 | 23d | 1 | 1.06mi |
| 7093 Fairway Bend Ln Sarasota, FL | 2.0 | 2.0 | 1756 | $4,600 | $2.62 | 23d | 1 | 1.07mi |
| 6896 W Country Club Ln #148 Sarasota, FL | 2.0 | 2.0 | 1118 | $1,700 | $1.52 | 11d | 1 | 1.08mi |
| 7461 W Country Club Dr N Sarasota, FL | 2.0 | 2.0 | 1153 | $2,275 | $1.97 | 3d | 4 | 1.09mi |
HOA detail condo
- Monthly dues
- $597 · $7,164/yr
- Assessments
- None detected in remarks — confirm with the listing agent.
Listing history 11 events
-
2026-05-01price $179,000
-
2026-04-30status Active
-
2026-04-30historical
-
2026-04-29$179,000 Active
-
2026-04-06status Active
-
2026-03-26status Pending
-
2026-03-07price $189,990
-
2026-02-04$194,900 Active
-
2025-12-18soldstatus $68,000
-
1992-10-27soldstatus $48,500
-
1979-10-01soldstatus $2,650,000
ⓘ Source: listings_history table (triggers on properties + properties_extension) + one-shot
backfill from property_details.listing_events for pre-trigger history.
Tax reassessment forecast FL · Resets to sale price
- Current annual tax
- $626 · $52/mo
- Projected year-2 tax
- $1,486 · $124/mo
- Expected delta
- +$859/yr (+$72/mo · 137.1%)
ⓘ Screening estimate from a state-policy table — verify with the county assessor before closing.
Climate risk First Street
- Flood 1/10 Low FEMA zone X (unshaded) · 0% chance over 30 yrs
- Wildfire 1/10 Low
- Heat 10/10 Extreme 7 d/yr ≥107°F today · 30 d/yr by 30 yrs out
- Wind 10/10 Extreme 99% chance of damaging wind over 30 yrs
- Air quality 2/10 Low 1 unhealthy d/yr today · 1 by 30 yrs out
Nearby sold comps map
Loading sold comps map…
Walkable amenities ~0.75 mi
Loading nearby amenities…
Taxation est. · year 1
- Rental income
- $31,639
- − Mortgage interest
- −$10,027
- − Property taxes
- −$626
- − Insurance
- −$895
- − Repairs & maintenance
- −$2,531
- − Management
- −$2,531
- − HOA
- −$7,164
- − Depreciation
- −$5,207
- Taxable income
- $2,657
- Est. tax owed @ 24.0%
- −$638
- After-tax cash flow
- $4,407/yr
For passive investors: Depreciation is non-cash, so a rental often shows a tax loss while cash-flowing — sheltering income. Rental losses are passive: they offset passive income freely, and up to $25,000/yr can offset ordinary (W-2) income if you actively participate and your MAGI is under $100k (phasing out to $0 by $150k); unused losses carry forward. On sale, claimed depreciation is recaptured at up to 25%, and gains may owe capital-gains tax (a 1031 exchange can defer both). Figures are a year-1 estimate at your 24.0% rate — not tax advice; consult a CPA.
Schools (NCES district)
- District
- Manatee
- NCES district ID
- 1201230
- Math proficiency
- 54% ▼ -6.00%
- Reading proficiency
- 50% ▼ -2.00%
- Median HH income
- $49,607
- Composite
- 44.43/100
- National rank
- #2806
- State rank
- #26 of 73 in FL
Livability — Desoto Acres
No livability data for this city. (Only ~50 U.S. cities are tracked.)
Census & demographics
- County
- Manatee County · 416,364 people
- Metro
- North Port-Sarasota-Bradenton, FL
- Population (ZIP)
- 32,773
- Household income
- $81,219
- Rent vs Own
- Severe rent burden
- 1138.0
Population outlook (Manatee County) Hauer SSP2
- Today (2025)
- 447,342 people
- By 2030
- 488,911 · +9.3%
- By 2040
- 567,934 · +27.0%
- By 2050
- 637,995 · +42.6%
- By 2075
- 781,970 · +74.8%
- By 2100
- 848,272 · +89.6%
Race, ethnicity, and origin ACS 2023
- Neighborhood character
- Predominantly White (76%)
- Race & ethnicity
- White 76% Hispanic / Latino 14% Two or more races 11% Asian 3% Black 3%
- Hispanic origin (detail)
- Mexican 5% Puerto Rican 3% Cuban 1%
- Common ancestry
- Romanian 5% Lithuanian 3% Slovak 2%
- Foreign-born
- 16% · Canada, Vietnam, Jamaica
- Languages at home
- 81% English-only · Spanish 8% Russian/Polish/Slavic 3% Other Indo-European 3%
Political lean MEDSL · Manatee
- 2024 margin
- Strong R (+23.5) · D 37.9% · R 61.4%
- 2008→2024 swing
- -16.5pp toward R · 2008: -7.0pp · 2024: -23.5pp
- All cycles
- 2024: R+23.5 2020: R+16.1 2016: R+17.1 2012: R+12.5 2008: R+7.0
Not yet ingested
- Civics
- —
Market trends
- HPI YoY
- ▼ -83.67%
- Current HPI
- 280.5372
- Rent YoY
- ▼ -4.14%
- Metro
- North Port-Sarasota-Bradenton, FL
- State GDP YoY
- ▲ 3.28%
- F500 in state
- 36
Industry mix (Fortune 500 HQ in FL)
| Industry | F500 HQs | Revenue |
|---|---|---|
| Industrial Technology | 2 | $29B |
|
||
| Insurance | 2 | $17B |
|
||
| Retail | 1 | $60B |
|
||
| Technology Distribution | 1 | $58B |
|
||
| Homebuilding | 1 | $35B |
|
||
| Technology Manufacturing | 1 | $35B |
|
||
Price history
-93.2% since first listed11 events — show timeline
- 2026-05-01 Price Changed $179,000 Stellar MLS as Distributed by MLS Grid
- 2026-04-30 Relisted — Stellar MLS as Distributed by MLS Grid
- 2026-04-30 Listing Removed — Stellar MLS as Distributed by MLS Grid
- 2026-04-29 Listed $179,000 Stellar MLS as Distributed by MLS Grid
- 2026-04-06 Relisted — Stellar MLS as Distributed by MLS Grid
- 2026-03-26 Pending — Stellar MLS as Distributed by MLS Grid
- 2026-03-07 Price Changed $189,990 Stellar MLS as Distributed by MLS Grid
- 2026-02-04 Listed $194,900 Stellar MLS as Distributed by MLS Grid
- 2025-12-18 Sold (Public Records) $68,000 Public Records
- 1992-10-27 Sold (Public Records) $48,500 Public Records
- 1979-10-01 Sold (Public Records) $2,650,000 Public Records
Property tax history
+4.3%/yrLatest (2025): $626 · +5.9% YoY. Source: county tax records.
Cash-flow waterfall
monthlySold comps — $/sqft
last 12 mo · ≤1 miLoading sold comps…