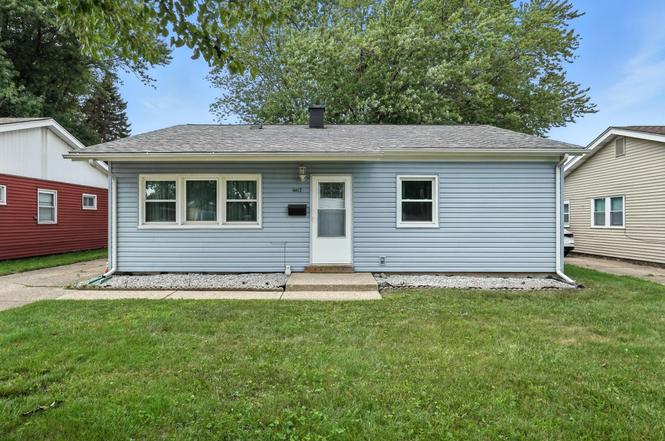
6612 Missouri Ave · Hammond, IN
Flood risk 1/10 · Minimal
- FEMA flood zone
- X (unshaded)
- Chance of flooding over 30 yrs
- 0.0%
- Est. flood insurance / yr
- $507 – $1,088
Fire risk 3/10 · Minor
- Est. fire insurance / yr
- $717 – $1,331
Heat risk 3/10 · Minor
- Hot days now (above 102°F)
- 7 days/yr
- Hot days in 30 yrs
- 15 days/yr
Wind risk 2/10 · Minimal
- Chance of severe wind over 30 yrs
- 1.0%
Air-quality risk 4/10 · Minor
- Unhealthy air days now
- 5 days/yr
- Unhealthy air days in 30 yrs
- 6 days/yr
Risk factors via First Street. Map © Google.
Why this score? — see what drove the D grade
The composite is a weighted blend of 9 inputs, each scored 0–100. Each bar is that input's sub-score; the figure is the points it added to the 100-point composite (weight × sub-score).
- Cash flow +15.8/30.0
- ARV discount +7.4/15.0
- DSCR +4.9/10.0
- Livability +3.5/5.0
- 1% rule +3.4/10.0
- Rent growth +2.5/5.0
- Condition / age +2.5/5.0
- Schools +1.1/10.0
- Appreciation +0.0/10.0
$197,900
🖨 Deal sheet 📄 Offer letter ✓ Due diligence
Listing remarks
Well-Maintained Ranch Offering Comfortable Living and Convenient Location. Owned and carefully maintained by the original family, this 3-bedroom, 1-bath ranch offers a functional layout and excellent potential. The bright living room features durable vinyl flooring and abundant natural light. The spacious eat-in kitchen provides ample cabinetry, room for a large island, and an adjoining dining or sitting area for added flexibility. Storage is a standout feature, including a large walk-in pantry with deep freezer included. All three bedrooms offer sizable closets, and the full bathroom is conveniently located nearby. The fully fenced backyard offers space for outdoor enjoyment, gardening, or
Key facts
- Ample cabinetry
- Generous storage
- Functional layout
Tags
Neighborhood map
What this means for you Summary
Snapshot
- This is a 3-bed/1.0-bath single-family listed at $198k.
Deal economics
- At list price, monthly cash flow is $90 ($1k/yr) — positive.
- The deal already cash-flows at list — no discount required.
- To meet the 1% rule (rent ≥ 1% of price), the offer needs to be $165k (16.5% below list).
- Recommended offer: $165k (16.5% below list) — sets the bar for 1% rule.
Location & tenants
- Location reads 70/100 on livability (#143 in IN) — a middle-class / working-renter tenant base. Strengths: cost of living A+, housing A+, commute A; Watch: health & safety D+, employment D, schools F.
- School City Of Hammond (suburban): math 8% / reading 18% proficiency, ranked #289 of 301 in IN (top 96%) — low school quality limits family demand, transient renter base, plan for 1-2y turnover; 74% free/reduced lunch — lower-income household profile, screen leases tightly.
- Market conditions: 59 active listings in the ZIP; 7 comparable units currently listed for rent nearby; rentals leasing fast (median 4d on market — plan ~1-2 weeks tenant-placement turnaround); 1,642 units permitted in Lake County in 2024 (14 in 5+ unit buildings).
- This rent runs 33% of the median local income ($60k/yr) — at the standard rent-burdened threshold; future hikes will face affordability resistance.
Forward outlook
- Local home prices are declining (-3.0%/yr); year-one equity from $1k of loan paydown is wiped out by about $6k of value loss. Plan a longer hold.
- Lake County population projected to shrink 7% by 2050 — rents likely to lag national; underwrite the cash flow, not the appreciation.
Negotiation context
- It's been on market 31 days — a 3% lower offer ($192k) is reasonable based on typical stale-listing flexibility.
- 2 sale attempts with the ask held roughly flat each time — persistent listings suggest the price (not the market) is what's stuck; bring a comps-based counter.
Risks & watch-outs
- Watch-outs: built in 1958 — expect roof / HVAC / electrical / plumbing capex.
Questions for the listing agent
- It's been on market 31 days. Have you received any prior offers? Is the seller open to a 16% concession, seller financing, or rate buy-down credit?
- Built in 1958 — when were the roof, HVAC, electrical panel, plumbing, and water heater last replaced?
- Is there a deadline driving the sale (1031 exchange, divorce, estate, relocation)? That informs how much negotiation room exists.
- Schools are F-rated, which usually means shorter tenancies and higher turnover. Who's the typical renter profile here, and what's been the actual vacancy rate?
- Crime grade is F in this area — have there been break-ins, vandalism, or insurance claims at this property in the last 3 years? What carrier currently insures it and at what premium?
- The area grade is low — what's the realistic commute time and amenity access for the typical tenant pool here? Any planned neighborhood developments (good or bad) we should know about?
- What's the average days-on-market for RENTAL listings here right now (not sales)? A rising rental-DOM trend means longer vacancies and softer asking-rent achievability than the comps imply.
- What's the recent tenant-quality profile in this submarket — average credit score on applications, eviction rate, late-payment / NSF rate, and stable-employment percentage? A property-management company in the area should have these aggregated.
- How much new for-sale + rental construction is in the pipeline within 1–3 miles? Heavy new supply typically softens prices + rents 12–24 months out; constrained supply supports both.
Investment metrics
- 1% rule
- 0.84% ✗
- Cap rate
- 6.84%
- Cash-on-cash
- 1.95%
- DSCR
- 1.09
- GRM
- 10.0
CMA / ARV
- ARV (on-the-fly)
- $197,540
- Comps found
- 12
Show comp detail 12 sales within ~0.75 mi
| Address | Dist | Beds/Ba | Sqft | Sold | Price | $/sf | Match |
|---|---|---|---|---|---|---|---|
| 6612 Missouri Ave | 0.00mi | 3/1.0 | 1,190 (0%) | 1mo | $197,900 | $166 | 99 |
| 6410 Grand Ave | 0.28mi | 3/1.0 | 1,166 (-2%) | 0mo | $151,000 | $130 | 83 |
| 3241 163rd St | 0.47mi | 3/1.0 | 1,221 (+3%) | 2mo | $111,250 | $91 | 72 |
| 6403 New Jersey Ave | 0.44mi | 3/1.0 | 1,143 (-4%) | 2mo | $150,000 | $131 | 72 |
| 3521 164th St | 0.24mi | 3/1.0 | 1,069 (-10%) | 3mo | $190,000 | $178 | 70 |
| 3448 164th St | 0.20mi | 3/1.0 | 1,011 (-15%) | 2mo | $162,000 | $160 | 64 |
| 3516 164th St | 0.21mi | 3/1.0 | 1,011 (-15%) | 3mo | $171,000 | $169 | 63 |
| 3320 163rd St | 0.41mi | 3/2.0 | 1,300 (+9%) | 1mo | $139,900 | $108 | 61 |
| 6808 Carolina Ave | 0.49mi | 2/2.0 (-1) | 1,254 (+5%) | 1mo | $124,900 | $100 | 58 |
| 6708 Kansas Ave | 0.22mi | 2/1.5 (-1) | 1,025 (-14%) | 3mo | $214,000 | $209 | 57 |
| 6402 New Hampshire Ave | 0.46mi | 3/1.0 | 1,026 (-14%) | 2mo | $205,000 | $200 | 54 |
| 6639 New Hampshire Ave | 0.41mi | 4/2.0 (+1) | 1,354 (+14%) | 2mo | $230,000 | $170 | 47 |
Match score weights: distance 35% · size 25% · config 20% · recency 20%. Top-matched comps best support the ARV.
Projected returns pro-forma
-3.0% appreciation · 3.0% rent growth · sell at horizon
- IRR
- -13.2%
- Equity multiple
- 0.52×
- Total profit
- $-26,403
- Equity at exit
- $29,508
- IRR
- -4.4%
- Equity multiple
- 0.71×
- Total profit
- $-15,886
- Equity at exit
- $17,111
Cash invested: $55,412 (down + closing). Projections, not guarantees.
Landlord ↔ Tenant lean methodology
- Overall (STATE)
- 90 Strongly Landlord-Friendly
- State Indiana
- 90 Strongly Landlord-Friendly · R+11
- County
- — inherits STATE
- City
- — inherits STATE
ZIP-level market 46323
- Home prices YoY
- -18.8%
- Active inventory
- 59
- Price-to-rent
- 10.0×
Monthly cashflow live
- Estimated rent
- $1,653 high interval (Pro) →
- Mortgage (P&I)
- −$1,038
- Tax from tax record
- −$95 /mo · $1,145/yr
- Insurance
- −$82
- HOA
- −$0
- Vacancy / Maint / Mgmt
- −$347
- Net cashflow
- $90
Break-even live
UW: 25.0% down · 7.5% · 30yr · 1.5% tax · 5.0% vac · 8.0% maint · 8.0% mgmt
Financing live
Cash to close
- Down payment
- $49,475
- Closing costs
- $5,937
- Reserves months
- —
- Total cash needed
- —
Loan-product check · same deal, 3 products live
Conventional
25% down · 7.5% · 30yr
- Down + closing
- —
- Monthly P&I
- —
- Monthly cashflow
- —
- DSCR
- —
- Eligible?
- —
Personal DTI + credit; lowest rate.
DSCR
20% down · 8.5% · 30yr
- Down + closing
- —
- Monthly P&I
- —
- Monthly cashflow
- —
- DSCR
- —
- Eligible?
- —
No personal income docs; deal must DSCR.
Hard money
10% down · 12.0% · 12mo
- Down + closing
- —
- Monthly P&I
- —
- Monthly cashflow
- —
- DSCR
- —
- Eligible?
- —
Short-term bridge; refi at stabilization.
Rent comps 7 comps
| Address | Beds | Baths | Sqft | Rent | $/sqft | DOM | Units | Dist |
|---|---|---|---|---|---|---|---|---|
| 3611 167th St Hammond, IN | 1.0–2.0 | 1.0 | 695 | $1,450 | $2.09 | 1d | 1 | 0.19mi |
| 6610 Rhode Island Ave Hammond, IN | 3.0 | 1.0 | 1025 | $1,600 | $1.56 | 7d | 1 | 0.50mi |
| 6320 Rhode Island Ave Hammond, IN | 3.0 | 1.0 | 916 | $1,550 | $1.69 | 2d | 1 | 0.62mi |
| 6949 Alabama Ave Hammond, IN | 2.0 | 1.5 | 1200 | $1,795 | $1.50 | 3d | 1 | 0.90mi |
| 2723 E 165th St Unit 3 Hammond, IN | 2.0 | 1.0 | 800 | $1,350 | $1.69 | 6d | 1 | 0.95mi |
| 3607 Orchard Dr Hammond, IN | 1.0–2.0 | 1.0 | 839 | $1,539 | $1.83 | 1d | 6 | 1.23mi |
| 7633 Kentucky Ave Hammond, IN | 3.0 | 1.0 | 888 | $1,595 | $1.80 | 10d | 1 | 1.28mi |
Listing history 13 events
-
2026-04-11status Pending
-
2026-03-11$197,900 Active
-
2025-11-26historical
-
2025-10-15price $196,900
-
2025-10-09price $199,200
-
2025-10-02price $199,300
-
2025-09-25price $199,400
-
2025-09-17price $199,500
-
2025-09-10price $199,600
-
2025-09-03price $199,700
-
2025-08-27price $199,800
-
2025-08-18price $199,900
-
2025-08-11$204,900 Active
ⓘ Source: listings_history table (triggers on properties + properties_extension) + one-shot
backfill from property_details.listing_events for pre-trigger history.
Tax reassessment forecast IN · Partial reset (capped growth)
- Current annual tax
- $1,145 · $95/mo
- Projected year-2 tax
- $1,414 · $118/mo
- Expected delta
- +$268/yr (+$22/mo · 23.4%)
ⓘ Screening estimate from a state-policy table — verify with the county assessor before closing.
Climate risk First Street
- Flood 1/10 Low FEMA zone X (unshaded) · 0% chance over 30 yrs
- Wildfire 3/10 Moderate
- Heat 3/10 Moderate 7 d/yr ≥102°F today · 15 d/yr by 30 yrs out
- Wind 2/10 Low 100% chance of damaging wind over 30 yrs
- Air quality 4/10 Moderate 5 unhealthy d/yr today · 6 by 30 yrs out
Nearby sold comps map
Loading sold comps map…
Walkable amenities ~0.75 mi
Loading nearby amenities…
Taxation est. · year 1
- Rental income
- $19,834
- − Mortgage interest
- −$11,085
- − Property taxes
- −$1,145
- − Insurance
- −$990
- − Repairs & maintenance
- −$1,587
- − Management
- −$1,587
- − Depreciation
- −$5,757
- Taxable loss
- −$2,317
- Est. tax savings @ 24.0%
- +$556
- After-tax cash flow
- $1,636/yr
For passive investors: Depreciation is non-cash, so a rental often shows a tax loss while cash-flowing — sheltering income. Rental losses are passive: they offset passive income freely, and up to $25,000/yr can offset ordinary (W-2) income if you actively participate and your MAGI is under $100k (phasing out to $0 by $150k); unused losses carry forward. On sale, claimed depreciation is recaptured at up to 25%, and gains may owe capital-gains tax (a 1031 exchange can defer both). Figures are a year-1 estimate at your 24.0% rate — not tax advice; consult a CPA.
Schools (NCES district)
- District
- School City Of Hammond
- NCES district ID
- 1804320
- Math proficiency
- 8% ▼ -18.00%
- Reading proficiency
- 18% ▼ -15.00%
- Median HH income
- $39,970
- Composite
- 11.11/100
- National rank
- #9730
- State rank
- #289 of 301 in IN
Livability — Hammond
- Score
- 70/100
- State rank
- #143
- US rank
- #7343
Category grades
Schools grade is shown separately in the Schools card above.
Census & demographics
- Census place
- Hammond, IN
- County
- Lake County · 422,878 people
- City population
- 58,809
- Metro
- Chicago-Naperville-Elgin, IL-IN-WI
- Population (ZIP)
- 23,047
- Household income
- $59,688
- Rent vs Own
- Severe rent burden
- 692.0
Population outlook (Lake County) Hauer SSP2
- Today (2025)
- 484,026 people
- By 2030
- 478,091 · -1.2%
- By 2040
- 462,974 · -4.3%
- By 2050
- 449,894 · -7.1%
- By 2075
- 436,169 · -9.9%
- By 2100
- 426,607 · -11.9%
Race, ethnicity, and origin ACS 2023
- Neighborhood character
- Diverse neighborhood (Simpson 0.68)
- Race & ethnicity
- Hispanic / Latino 38% White 36% Black 21% Two or more races 12% Asian 2% Native American 1%
- Hispanic origin (detail)
- Mexican 29% Puerto Rican 7%
- Common ancestry
- Romanian 6% Italian 2% Lithuanian 1%
- Foreign-born
- 8% · Canada, China
- Languages at home
- 78% English-only · Spanish 19% Chinese 1%
Political lean MEDSL · Lake
- 2024 margin
- Lean D (+5.6) · D 52.1% · R 46.5% · Other 1.5%
- 2008→2024 swing
- -28.6pp toward R · 2008: 34.3pp · 2024: 5.6pp
- All cycles
- 2024: D+5.6 2020: D+15.1 2016: D+20.6 2012: D+31.0 2008: D+34.3
Not yet ingested
- Civics
- —
Market trends
- HPI YoY
- ▼ -67.70%
- Current HPI
- 293.4702
- Rent YoY
- —
- Metro
- Chicago-Naperville-Elgin, IL-IN-WI
- State GDP YoY
- ▲ 2.90%
- F500 in state
- 18
Industry mix (Fortune 500 HQ in IN)
| Industry | F500 HQs | Revenue |
|---|---|---|
| Industrial Machinery | 2 | $37B |
|
||
| Healthcare | 1 | $177B |
|
||
| Pharmaceuticals | 1 | $45B |
|
||
| Metals / Steel | 1 | $18B |
|
||
| Agriculture | 1 | $17B |
|
||
| Packaging | 1 | $12B |
|
||
Price history
-3.4% since first listed13 events — show timeline
- 2026-04-11 Pending — NIRA MLS as Distributed by MLS Grid
- 2026-03-11 Listed $197,900 NIRA MLS as Distributed by MLS Grid
- 2025-11-26 Listing Removed — NIRA MLS as Distributed by MLS Grid
- 2025-10-15 Price Changed $196,900 NIRA MLS as Distributed by MLS Grid
- 2025-10-09 Price Changed $199,200 NIRA MLS as Distributed by MLS Grid
- 2025-10-02 Price Changed $199,300 NIRA MLS as Distributed by MLS Grid
- 2025-09-25 Price Changed $199,400 NIRA MLS as Distributed by MLS Grid
- 2025-09-17 Price Changed $199,500 NIRA MLS as Distributed by MLS Grid
- 2025-09-10 Price Changed $199,600 NIRA MLS as Distributed by MLS Grid
- 2025-09-03 Price Changed $199,700 NIRA MLS as Distributed by MLS Grid
- 2025-08-27 Price Changed $199,800 NIRA MLS as Distributed by MLS Grid
- 2025-08-18 Price Changed $199,900 NIRA MLS as Distributed by MLS Grid
- 2025-08-11 Listed $204,900 NIRA MLS as Distributed by MLS Grid
Property tax history
+2.7%/yrLatest (2024): $1,145 · -4.2% YoY. Source: county tax records.
Cash-flow waterfall
monthlySold comps — $/sqft
last 12 mo · ≤1 miLoading sold comps…