2073 S Us Highway 31 · Franklin, IN
Flood risk 1/10 · Minimal
- FEMA flood zone
- X (unshaded)
- Chance of flooding over 30 yrs
- 0.0%
- Est. flood insurance / yr
- $507 – $1,088
Fire risk 1/10 · Minimal
- Est. fire insurance / yr
- $717 – $1,331
Heat risk 3/10 · Minor
- Hot days now (above 102°F)
- 7 days/yr
- Hot days in 30 yrs
- 18 days/yr
Wind risk 2/10 · Minimal
- Chance of severe wind over 30 yrs
- 1.0%
Air-quality risk 2/10 · Minimal
- Unhealthy air days now
- 1 days/yr
- Unhealthy air days in 30 yrs
- 1 days/yr
Risk factors via First Street. Map © Google.
Why this score? — see what drove the C+ grade
The composite is a weighted blend of 9 inputs, each scored 0–100. Each bar is that input's sub-score; the figure is the points it added to the 100-point composite (weight × sub-score).
- Cash flow +26.2/30.0
- DSCR +8.8/10.0
- ARV discount +7.5/15.0
- 1% rule +5.6/10.0
- Rent growth +3.7/5.0
- Schools +3.5/10.0
- Livability +3.2/5.0
- Condition / age +2.5/5.0
- Appreciation +0.0/10.0
$174,000
🖨 Deal sheet 📄 Offer letter ✓ Due diligence
Listing remarks MLS
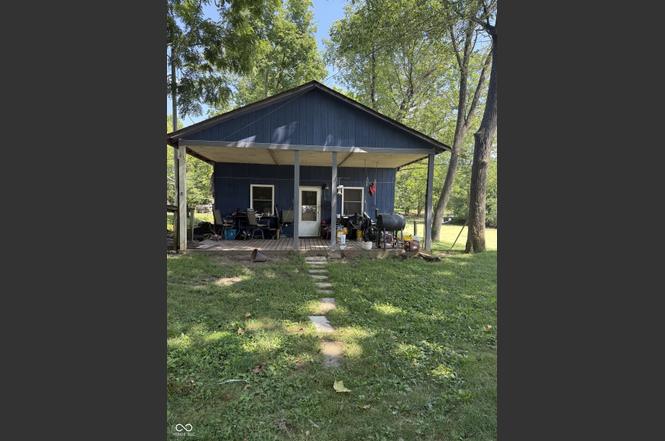
This 3 bedroom and 1 bath home sits on a lake!!! Has hardwood floors throughout, a brick fireplace in the living room, eat-in kitchen and 2 car detached garage. Relaxing quiet setting! Needs some updates and repairs.
Key facts
- Covered front porch
- Serene water view
- 0.43 acre lot
Tags
Neighborhood map
What this means for you Summary
Snapshot
- This is a 3-bed/1.0-bath single-family listed at $174k.
Deal economics
- At list price, monthly cash flow is $442 ($5k/yr) — positive.
- The deal already cash-flows at list — no discount required.
- Meets the 1% rule at list price ($2k rent vs $174k).
- Recommended offer: $153k (12.0% below list) — sets the bar for market timing.
- Cap rate 9.3% vs local median 4.0% in Franklin — top-decile yield for the area; either an underpriced asset or a hidden risk that comps aren't pricing in. Stress-test before assuming the spread holds.
Location & tenants
- Location reads 65/100 on livability (#351 in IN) — a middle-class / working-renter tenant base. Strengths: crime A+, cost of living A+, housing A+; Watch: amenities F, commute F, health & safety F.
- Franklin Community School Corporation (suburban): math 36% / reading 44% proficiency, ranked #133 of 301 in IN (top 44%) — families likely to look elsewhere, expect single-tenant / working-renter base with shorter leases.
- Zoned schools: Franklin Community High School (math 29% / reading 69%, grade D, #136 of 369 statewide, top 37%, 1,610 students, 41% FRL).
- Market conditions: Rents rising fast (+4.7%/yr); 278 active listings in the ZIP; solid renter incomes; 1,133 units permitted in Johnson County in 2024 (0 in 5+ unit buildings).
Forward outlook
- Local home prices are declining (-3.0%/yr); year-one equity from $1k of loan paydown is wiped out by about $5k of value loss. Plan a longer hold.
- Johnson County population projected at +26% by 2050 — long-run rental-demand tailwind backs the buy-and-hold thesis.
- At projected returns (-3.0% appreciation + 4.7% rent growth), your $49k cash investment doubles in ~9 years — after that, you're playing with house money.
Negotiation context
- It's been on market 223 days — a 12% lower offer ($153k) is reasonable based on typical stale-listing flexibility.
- 4 sale attempts since 23y ago with the ask held roughly flat each time — persistent listings suggest the price (not the market) is what's stuck; bring a comps-based counter.
- Current owner paid $30k; list at $174k implies a 482% gain — meaningful room to come down on a strong offer.
Risks & watch-outs
- Watch-outs: built in 1945 — expect roof / HVAC / electrical / plumbing capex.
Questions for the listing agent
- It's been on market 223 days. Have you received any prior offers? Is the seller open to a 12% concession, seller financing, or rate buy-down credit?
- Built in 1945 — when were the roof, HVAC, electrical panel, plumbing, and water heater last replaced?
- Why hasn't it sold? Are there any deal-killer items the seller is aware of (foundation, flood, title, zoning, code violations)?
- Is there a deadline driving the sale (1031 exchange, divorce, estate, relocation)? That informs how much negotiation room exists.
- Schools are D-rated, which usually means shorter tenancies and higher turnover. Who's the typical renter profile here, and what's been the actual vacancy rate?
- What's the average days-on-market for RENTAL listings here right now (not sales)? A rising rental-DOM trend means longer vacancies and softer asking-rent achievability than the comps imply.
- What's the recent tenant-quality profile in this submarket — average credit score on applications, eviction rate, late-payment / NSF rate, and stable-employment percentage? A property-management company in the area should have these aggregated.
- How much new for-sale + rental construction is in the pipeline within 1–3 miles? Heavy new supply typically softens prices + rents 12–24 months out; constrained supply supports both.
Investment metrics
- 1% rule
- 1.06% ✓
- Cap rate
- 9.34%
- Cash-on-cash
- 10.88%
- DSCR
- 1.48
- GRM
- 7.8
CMA / ARV
No comps found within radius.
Projected returns pro-forma
-3.0% appreciation · 4.68% rent growth · sell at horizon
- IRR
- 1.6%
- Equity multiple
- 1.06×
- Total profit
- $3,041
- Equity at exit
- $25,944
- IRR
- 12.6%
- Equity multiple
- 2.07×
- Total profit
- $52,047
- Equity at exit
- $15,044
Cash invested: $48,720 (down + closing). Projections, not guarantees.
Landlord ↔ Tenant lean methodology
- Overall (STATE)
- 90 Strongly Landlord-Friendly
- State Indiana
- 90 Strongly Landlord-Friendly · R+11
- County
- — inherits STATE
- City
- — inherits STATE
ZIP-level market 46131
- Home prices YoY
- -27.8%
- Rents YoY
- 4.7%
- Active inventory
- 278
- Price-to-rent
- 7.8×
Monthly cashflow live
- Estimated rent
- $1,850 medium interval (Pro) →
- Mortgage (P&I)
- −$912
- Tax from tax record
- −$35 /mo · $420/yr
- Insurance
- −$72
- HOA
- −$0
- Vacancy / Maint / Mgmt
- −$389
- Net cashflow
- $442
Break-even live
UW: 25.0% down · 7.5% · 30yr · 1.5% tax · 5.0% vac · 8.0% maint · 8.0% mgmt
Financing live
Cash to close
- Down payment
- $43,500
- Closing costs
- $5,220
- Reserves months
- —
- Total cash needed
- —
Loan-product check · same deal, 3 products live
Conventional
25% down · 7.5% · 30yr
- Down + closing
- —
- Monthly P&I
- —
- Monthly cashflow
- —
- DSCR
- —
- Eligible?
- —
Personal DTI + credit; lowest rate.
DSCR
20% down · 8.5% · 30yr
- Down + closing
- —
- Monthly P&I
- —
- Monthly cashflow
- —
- DSCR
- —
- Eligible?
- —
No personal income docs; deal must DSCR.
Hard money
10% down · 12.0% · 12mo
- Down + closing
- —
- Monthly P&I
- —
- Monthly cashflow
- —
- DSCR
- —
- Eligible?
- —
Short-term bridge; refi at stabilization.
Listing history 9 events
-
2026-04-17status Pending
-
2026-02-08status Active
-
2026-01-14status Pending
-
2025-08-12$174,000 Active
-
2010-12-31historical 216-char remark
Show marketing remark (216 chars)
This 3 bedroom and 1 bath home sits on a lake!!! Has hardwood floors throughout, a brick fireplace in the living room, eat-in kitchen and 2 car detached garage. Relaxing quiet setting! Needs some updates and repairs.
-
2010-12-30soldstatus $29,900 216-char remark
Show marketing remark (216 chars)
This 3 bedroom and 1 bath home sits on a lake!!! Has hardwood floors throughout, a brick fireplace in the living room, eat-in kitchen and 2 car detached garage. Relaxing quiet setting! Needs some updates and repairs.
-
2010-09-07$29,900 216-char remark
Show marketing remark (216 chars)
This 3 bedroom and 1 bath home sits on a lake!!! Has hardwood floors throughout, a brick fireplace in the living room, eat-in kitchen and 2 car detached garage. Relaxing quiet setting! Needs some updates and repairs.
-
2003-08-26soldstatus $97,000 411-char remark
Show marketing remark (411 chars)
THIS LAKE FRONT PROPERTY SITS ON 2 3/4 ACRES AND HAS MANY AMENITIES INCLUDING A NEW ROOF, WELL, SEPTIC, AND FURNACE. A NEWLY BUILT 2+ OVERSIZE DETACHED GARAGE WITH A NEW DECK CONNECTING THE GARAGE AND HOME. HOME HAS GRE AT LANDSCAPING AND MATURE TREES. THE LAKE IS WELL STOCKED AND TAKEN CARE OF. IF YOU ARE LOOKING FOR PEACE AND QUIET OR A PLACE TO RUN FREE THIS IS THE HOME FOR YOU. SELLER IS VERY MOTIVATED!!
-
2003-07-17$105,000 411-char remark
Show marketing remark (411 chars)
THIS LAKE FRONT PROPERTY SITS ON 2 3/4 ACRES AND HAS MANY AMENITIES INCLUDING A NEW ROOF, WELL, SEPTIC, AND FURNACE. A NEWLY BUILT 2+ OVERSIZE DETACHED GARAGE WITH A NEW DECK CONNECTING THE GARAGE AND HOME. HOME HAS GRE AT LANDSCAPING AND MATURE TREES. THE LAKE IS WELL STOCKED AND TAKEN CARE OF. IF YOU ARE LOOKING FOR PEACE AND QUIET OR A PLACE TO RUN FREE THIS IS THE HOME FOR YOU. SELLER IS VERY MOTIVATED!!
ⓘ Source: listings_history table (triggers on properties + properties_extension) + one-shot
backfill from property_details.listing_events for pre-trigger history.
Tax reassessment forecast IN · Partial reset (capped growth)
- Current annual tax
- $420 · $35/mo
- Projected year-2 tax
- $950 · $79/mo
- Expected delta
- +$529/yr (+$44/mo · 125.9%)
ⓘ Screening estimate from a state-policy table — verify with the county assessor before closing.
Climate risk First Street
- Flood 1/10 Low FEMA zone X (unshaded) · 0% chance over 30 yrs
- Wildfire 1/10 Low
- Heat 3/10 Moderate 7 d/yr ≥102°F today · 18 d/yr by 30 yrs out
- Wind 2/10 Low 100% chance of damaging wind over 30 yrs
- Air quality 2/10 Low 1 unhealthy d/yr today · 1 by 30 yrs out
Nearby sold comps map
Loading sold comps map…
Walkable amenities ~0.75 mi
Loading nearby amenities…
Taxation est. · year 1
- Rental income
- $22,205
- − Mortgage interest
- −$9,747
- − Property taxes
- −$420
- − Insurance
- −$870
- − Repairs & maintenance
- −$1,776
- − Management
- −$1,776
- − Depreciation
- −$5,062
- Taxable income
- $2,553
- Est. tax owed @ 24.0%
- −$613
- After-tax cash flow
- $4,689/yr
For passive investors: Depreciation is non-cash, so a rental often shows a tax loss while cash-flowing — sheltering income. Rental losses are passive: they offset passive income freely, and up to $25,000/yr can offset ordinary (W-2) income if you actively participate and your MAGI is under $100k (phasing out to $0 by $150k); unused losses carry forward. On sale, claimed depreciation is recaptured at up to 25%, and gains may owe capital-gains tax (a 1031 exchange can defer both). Figures are a year-1 estimate at your 24.0% rate — not tax advice; consult a CPA.
Schools (NCES district)
- District
- Franklin Community School Corporation
- NCES district ID
- 1803690
- Math proficiency
- 36% ▼ -11.00%
- Reading proficiency
- 44% ▼ -8.00%
- Median HH income
- $54,855
- Composite
- 34.93/100
- National rank
- #5066
- State rank
- #133 of 301 in IN
Livability — Franklin
- Score
- 65/100
- State rank
- #351
- US rank
- #13428
Category grades
Schools grade is shown separately in the Schools card above.
Census & demographics
- County
- Johnson County · 154,261 people
- City population
- 34,647
- Metro
- Indianapolis-Carmel-Anderson, IN
- Population (ZIP)
- 34,647
- Household income
- $85,076
- Rent vs Own
- Severe rent burden
- 984.0
Population outlook (Johnson County) Hauer SSP2
- Today (2025)
- 170,080 people
- By 2030
- 179,983 · +5.8%
- By 2040
- 198,580 · +16.8%
- By 2050
- 214,661 · +26.2%
- By 2075
- 247,990 · +45.8%
- By 2100
- 257,821 · +51.6%
Race, ethnicity, and origin ACS 2023
- Neighborhood character
- Predominantly White (92%)
- Race & ethnicity
- White 92% Two or more races 4% Hispanic / Latino 2% Black 2%
- Common ancestry
- Slovak 2% Italian 1% Serbian 1%
- Foreign-born
- 2% · Canada
- Languages at home
- 97% English-only · Spanish 2% Russian/Polish/Slavic 1% Other Asian/Pacific 1%
Political lean MEDSL · Johnson
- 2024 margin
- Solid R (+34.3) · D 32.0% · R 66.3% · Other 1.7%
- 2008→2024 swing
- -8.9pp toward R · 2008: -25.5pp · 2024: -34.3pp
- All cycles
- 2024: R+34.3 2020: R+34.1 2016: R+42.5 2012: R+38.5 2008: R+25.5
Not yet ingested
- Civics
- —
Market trends
- HPI YoY
- ▼ -90.53%
- Current HPI
- 235.0009
- Rent YoY
- ▲ 4.68%
- Metro
- Indianapolis-Carmel-Anderson, IN
- State GDP YoY
- ▲ 2.90%
- F500 in state
- 18
Industry mix (Fortune 500 HQ in IN)
| Industry | F500 HQs | Revenue |
|---|---|---|
| Industrial Machinery | 2 | $37B |
|
||
| Healthcare | 1 | $177B |
|
||
| Pharmaceuticals | 1 | $45B |
|
||
| Metals / Steel | 1 | $18B |
|
||
| Agriculture | 1 | $17B |
|
||
| Packaging | 1 | $12B |
|
||
Price history
+65.7% since first listed9 events — show timeline
- 2026-04-17 Pending — MIBOR as Distributed by MLS Grid
- 2026-02-08 Relisted — MIBOR as Distributed by MLS Grid
- 2026-01-14 Pending — MIBOR as Distributed by MLS Grid
- 2025-08-12 Listed $174,000 MIBOR as Distributed by MLS Grid
- 2010-12-31 Listing Removed — MIBOR as Distributed by MLS Grid
- 2010-12-30 Sold (MLS) $29,900 MIBOR as Distributed by MLS Grid
- 2010-09-07 Listed $29,900 MIBOR as Distributed by MLS Grid
- 2003-08-26 Sold (MLS) $97,000 MIBOR as Distributed by MLS Grid
- 2003-07-17 Listed $105,000 MIBOR as Distributed by MLS Grid
Property tax history
+17.0%/yrLatest (2024): $420 · +14.5% YoY. Source: county tax records.
Cash-flow waterfall
monthlySold comps — $/sqft
last 12 mo · ≤1 miLoading sold comps…