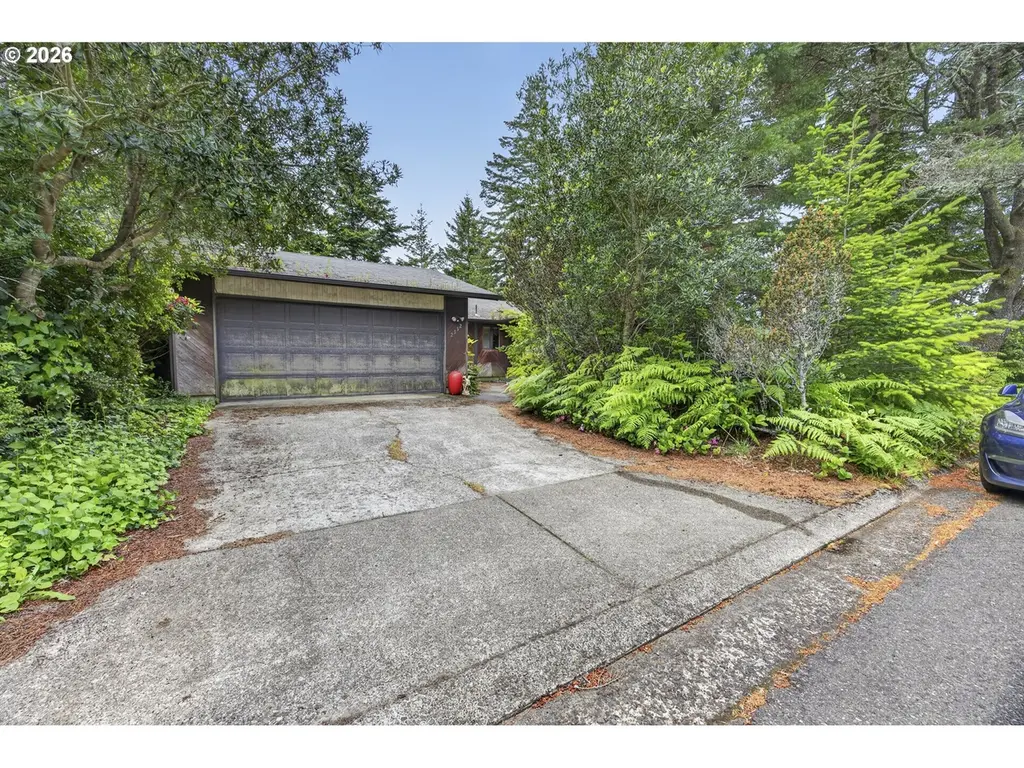
2332 24th St · Florence, OR
Flood risk 1/10 · Minimal
- FEMA flood zone
- X (unshaded)
- Chance of flooding over 30 yrs
- 0.0%
- Est. flood insurance / yr
- $507 – $1,088
Fire risk 1/10 · Minimal
- Est. fire insurance / yr
- $498 – $926
Heat risk 1/10 · Minimal
- Hot days now (above 77°F)
- 8 days/yr
- Hot days in 30 yrs
- 20 days/yr
Wind risk 1/10 · Minimal
- Chance of severe wind over 30 yrs
- —
Air-quality risk 6/10 · Moderate
- Unhealthy air days now
- 7 days/yr
- Unhealthy air days in 30 yrs
- 7 days/yr
Risk factors via First Street. Map © Google.
Why this score? — see what drove the D+ grade
The composite is a weighted blend of 9 inputs, each scored 0–100. Each bar is that input's sub-score; the figure is the points it added to the 100-point composite (weight × sub-score).
- ARV discount +15.0/15.0
- Appreciation +10.0/10.0
- Cash flow +7.5/30.0
- Schools +3.7/10.0
- Livability +3.5/5.0
- Rent growth +2.5/5.0
- Condition / age +2.5/5.0
- DSCR +1.6/10.0
- 1% rule +1.5/10.0
$290,000
🖨 Deal sheet 📄 Offer letter ✓ Due diligence
Listing remarks
Calling all investors, flippers, and visionaries! This 2-bedroom, 2-bath home in Summersete Estates is ready for a full refresh and priced for someone with imagination and ambition. Featuring an attached two-car garage, patio space, and a functional layout, this property offers solid potential for the right buyer ready to roll up their sleeves. Time, along with Grandma’s fondness for cigarettes and her feline companions, has certainly left its mark, and significant cosmetic updates are needed including flooring, interior refreshes, and plenty of TLC. For the buyer willing to look past the current condition, the opportunity for sweat equity and return on investment is undeniable.
Key facts
- 7,405 sq ft lot
- Garage
- Built 1977
Property features AI
Finance
- Other: Lot roughly 0.17 acre (7,000–9,999 sqft range); View of trees/woods
- HOA & community: No land lease; Not a senior community; Zoned LR
Exterior
- Parking: Attached 1-car garage; Driveway and on-street parking (total parking for 1 vehicle)
- Utilities: Electric water heating; Electric fuel; Public water; Public sewer
- Home design: Single-family residence; Residential property; Fixer condition; Main living area all on one level; Built in 1977
- Construction: Composition roof; T-111 and wood siding; Built in 1977; Foundation information not provided
- Exterior features: Patio; Level lot; Paved road access; Trees/woods view
Interior
- Kitchen: Kitchen on the main level
- Bedrooms: Primary bedroom on the main level; Second bedroom on the main level
- Bathrooms: One full bathroom and one partial bathroom (both on the main level)
- Heating & cooling: Forced air heating (95%+); Wood stove heating; No central air
- Interior features: One-level accessibility; Wood-burning stove fireplace
Neighborhood map
What this means for you Summary
Snapshot
- This is a 2-bed/2.0-bath single-family listed at $290k.
Deal economics
- At list price, monthly cash flow is $-361 ($-4k/yr) — negative.
- To cash-flow at today's rent, offer at most $226k (22.0% below list).
- To meet the 1% rule (rent ≥ 1% of price), the offer needs to be $190k (34.7% below list).
- Recommended offer: $190k (34.7% below list) — sets the bar for 1% rule.
- Cap rate 4.8% vs local median 2.6% in Florence — top-decile yield for the area; either an underpriced asset or a hidden risk that comps aren't pricing in. Stress-test before assuming the spread holds.
Location & tenants
- Location reads 70/100 on livability (#142 in OR) — a middle-class / working-renter tenant base. Strengths: health & safety A+, housing A, crime A-; Watch: employment C-, amenities F, commute F.
- Siuslaw SD 97J (town): math 33% / reading 50% proficiency, ranked #106 of 183 in OR (top 58%) — families likely to look elsewhere, expect single-tenant / working-renter base with shorter leases.
- Zoned schools: Siuslaw Elementary School (math 22% / reading 37%, grade F, #263 of 412 statewide, top 68%, 520 students, 68% FRL); Siuslaw Middle School (math 15% / reading 37%, grade F, #101 of 128 statewide, top 80%, 270 students, 68% FRL); Siuslaw High School (math 24% / reading 75%, grade D+, #32 of 143 statewide, top 34%, 459 students, 68% FRL).
- Market conditions: 406 active listings in the ZIP; 1 comparable units currently listed for rent nearby; 1,808 units permitted in Lane County in 2024 (972 in 5+ unit buildings).
Forward outlook
- In year one you build about $31k of equity ($2k loan paydown + $29k appreciation (10.0% local appreciation)).
- Lane County population projected at +15% by 2050 — long-run rental-demand tailwind backs the buy-and-hold thesis.
- By year 2, paydown + projected appreciation supports a ~$50k cash-out refi (75% LTV) — recoverable capital for the next deal without selling this one.
Negotiation context
- Only 8 days on market — expect competitive offers; lowballing is unlikely to land.
- 2 sale attempts since 24y ago with the ask held roughly flat each time — persistent listings suggest the price (not the market) is what's stuck; bring a comps-based counter.
- Current owner paid $128k; list at $290k implies a 127% gain — meaningful room to come down on a strong offer.
Questions for the listing agent
- What do current leases actually rent for vs. the listed asking? Can we see a recent rent roll and the last 12 months of T-12 income?
- Built in 1977 — when were the roof, HVAC, electrical panel, plumbing, and water heater last replaced?
- Is there a deadline driving the sale (1031 exchange, divorce, estate, relocation)? That informs how much negotiation room exists.
- The area grade is low — what's the realistic commute time and amenity access for the typical tenant pool here? Any planned neighborhood developments (good or bad) we should know about?
- What's the average days-on-market for RENTAL listings here right now (not sales)? A rising rental-DOM trend means longer vacancies and softer asking-rent achievability than the comps imply.
- What's the recent tenant-quality profile in this submarket — average credit score on applications, eviction rate, late-payment / NSF rate, and stable-employment percentage? A property-management company in the area should have these aggregated.
- How much new for-sale + rental construction is in the pipeline within 1–3 miles? Heavy new supply typically softens prices + rents 12–24 months out; constrained supply supports both.
Investment metrics
- 1% rule
- 0.65% ✗
- Cap rate
- 4.80%
- Cash-on-cash
- -5.33%
- DSCR
- 0.76
- GRM
- 12.8
CMA / ARV
- ARV (on-the-fly)
- $388,890
- Comps found
- 12
Show comp detail 12 sales within ~0.75 mi
| Address | Dist | Beds/Ba | Sqft | Sold | Price | $/sf | Match |
|---|---|---|---|---|---|---|---|
| 2191 Willow St | 0.11mi | 3/2.0 (+1) | 1,386 (+6%) | 1mo | $424,900 | $307 | 78 |
| 2040 20th St | 0.29mi | 3/2.0 (+1) | 1,292 (-1%) | 2mo | $360,000 | $279 | 78 |
| 1925 Upas St | 0.28mi | 3/2.0 (+1) | 1,272 (-2%) | 4mo | $345,000 | $271 | 74 |
| 1750 W Park Dr | 0.39mi | 2/1.0 | 1,290 (-1%) | 4mo | $339,900 | $263 | 73 |
| 1868 Tamarack St | 0.32mi | 3/2.0 (+1) | 1,393 (+7%) | 7mo | $405,000 | $291 | 63 |
| 2105 16th St | 0.46mi | 3/2.0 (+1) | 1,240 (-5%) | 7mo | $395,000 | $319 | 60 |
| 1588 20th St | 0.51mi | 3/2.0 (+1) | 1,276 (-2%) | 11mo | $415,000 | $325 | 58 |
| 1370 Zebrawood St | 0.64mi | 3/2.0 (+1) | 1,300 (-0%) | 8mo | $387,000 | $298 | 58 |
| 29 Easy St | 0.30mi | 2/1.0 | 1,136 (-13%) | 4mo | $285,000 | $251 | 57 |
| 1425 Zebrawood St | 0.56mi | 3/2.0 (+1) | 1,214 (-7%) | 6mo | $369,000 | $304 | 53 |
| 3220 31st St | 0.70mi | 3/2.0 (+1) | 1,232 (-6%) | 1mo | $515,000 | $418 | 52 |
| 1715 W Park Dr | 0.40mi | 3/1.0 (+1) | 1,128 (-14%) | 11mo | $310,000 | $275 | 40 |
Match score weights: distance 35% · size 25% · config 20% · recency 20%. Top-matched comps best support the ARV.
Projected returns pro-forma
10.0% appreciation · 3.0% rent growth · sell at horizon
- IRR
- 20.5%
- Equity multiple
- 2.66×
- Total profit
- $134,906
- Equity at exit
- $261,255
- IRR
- 18.7%
- Equity multiple
- 6.11×
- Total profit
- $415,220
- Equity at exit
- $563,406
Cash invested: $81,200 (down + closing). Projections, not guarantees.
Landlord ↔ Tenant lean methodology
- Overall (STATE)
- 28 Tenant-Leaning
- State Oregon
- 28 Tenant-Leaning · D+6
- County
- — inherits STATE
- City
- — inherits STATE
ZIP-level market 97439
- Home prices YoY
- 2.5%
- Active inventory
- 406
- Price-to-rent
- 12.8×
Monthly cashflow live
- Estimated rent
- $1,895 medium interval (Pro) →
- Mortgage (P&I)
- −$1,521
- Tax from tax record
- −$216 /mo · $2,594/yr
- Insurance
- −$121
- HOA
- −$0
- Vacancy / Maint / Mgmt
- −$398
- Net cashflow
- $-361
Break-even live
UW: 25.0% down · 7.5% · 30yr · 1.5% tax · 5.0% vac · 8.0% maint · 8.0% mgmt
Financing live
Cash to close
- Down payment
- $72,500
- Closing costs
- $8,700
- Reserves months
- —
- Total cash needed
- —
Loan-product check · same deal, 3 products live
Conventional
25% down · 7.5% · 30yr
- Down + closing
- —
- Monthly P&I
- —
- Monthly cashflow
- —
- DSCR
- —
- Eligible?
- —
Personal DTI + credit; lowest rate.
DSCR
20% down · 8.5% · 30yr
- Down + closing
- —
- Monthly P&I
- —
- Monthly cashflow
- —
- DSCR
- —
- Eligible?
- —
No personal income docs; deal must DSCR.
Hard money
10% down · 12.0% · 12mo
- Down + closing
- —
- Monthly P&I
- —
- Monthly cashflow
- —
- DSCR
- —
- Eligible?
- —
Short-term bridge; refi at stabilization.
Rent comps 1 comps
| Address | Beds | Baths | Sqft | Rent | $/sqft | DOM | Units | Dist |
|---|---|---|---|---|---|---|---|---|
| 485 Myeena Loop Florence, OR | 2.0 | 2.0 | 1790 | $1,895 | $1.06 | 43d | 1 | 1.30mi |
Listing history 11 events
-
2026-06-08status $290,000 Pending 8 DOM
-
2026-06-07days on market $290,000 Active 8 DOM
-
2026-06-04days on market $290,000 Active 5 DOM
-
2026-06-02days on market $290,000 Active 4 DOM
-
2026-06-01days on market $290,000 Active 3 DOM
-
2026-05-31days on market $290,000 Active 2 DOM
-
2026-05-29$290,000 Active
-
2003-04-04soldstatus $128,000
-
2003-04-04soldstatus $128,000
-
2002-07-28$129,000
-
1993-04-14soldstatus $82,000
ⓘ Source: listings_history table (triggers on properties + properties_extension) + one-shot
backfill from property_details.listing_events for pre-trigger history.
Tax reassessment forecast OR · Resets to sale price
- Current annual tax
- $2,594 · $216/mo
- Projected year-2 tax
- $2,813 · $234/mo
- Expected delta
- +$219/yr (+$18/mo · 8.5%)
ⓘ Screening estimate from a state-policy table — verify with the county assessor before closing.
Climate risk First Street
- Flood 1/10 Low FEMA zone X (unshaded) · 0% chance over 30 yrs
- Wildfire 1/10 Low
- Heat 1/10 Low 8 d/yr ≥77°F today · 20 d/yr by 30 yrs out
- Wind 1/10 Low
- Air quality 6/10 Major 7 unhealthy d/yr today · 7 by 30 yrs out
Nearby sold comps map
Loading sold comps map…
Walkable amenities ~0.75 mi
Loading nearby amenities…
Taxation est. · year 1
- Rental income
- $22,740
- − Mortgage interest
- −$16,245
- − Property taxes
- −$2,594
- − Insurance
- −$1,450
- − Repairs & maintenance
- −$1,819
- − Management
- −$1,819
- − Depreciation
- −$8,436
- Taxable loss
- −$9,623
- Est. tax savings @ 24.0%
- +$2,310
- After-tax cash flow
- $-2,019/yr
For passive investors: Depreciation is non-cash, so a rental often shows a tax loss while cash-flowing — sheltering income. Rental losses are passive: they offset passive income freely, and up to $25,000/yr can offset ordinary (W-2) income if you actively participate and your MAGI is under $100k (phasing out to $0 by $150k); unused losses carry forward. On sale, claimed depreciation is recaptured at up to 25%, and gains may owe capital-gains tax (a 1031 exchange can defer both). Figures are a year-1 estimate at your 24.0% rate — not tax advice; consult a CPA.
Schools (NCES district)
- District
- Siuslaw SD 97J
- NCES district ID
- 4105100
- Math proficiency
- 33% ▼ -3.00%
- Reading proficiency
- 50% ▼ -2.00%
- Median HH income
- $36,892
- Composite
- 36.82/100
- National rank
- #9169
- State rank
- #106 of 183 in OR
Livability — Florence
- Score
- 70/100
- State rank
- #142
- US rank
- #8094
Category grades
Schools grade is shown separately in the Schools card above.
Census & demographics
- Census place
- Florence, OR
- Population (ZIP)
- 15,643
Population outlook (Lane County) Hauer SSP2
- Today (2025)
- 391,933 people
- By 2030
- 405,860 · +3.6%
- By 2040
- 429,386 · +9.6%
- By 2050
- 452,016 · +15.3%
- By 2075
- 508,825 · +29.8%
- By 2100
- 531,208 · +35.5%
Race, ethnicity, and origin ACS 2023
- Neighborhood character
- Predominantly White (88%)
- Race & ethnicity
- White 88% Hispanic / Latino 5% Two or more races 5% Asian 2% Black 1%
- Hispanic origin (detail)
- Mexican 4%
- Common ancestry
- Lithuanian 4% Portuguese 3% Slovak 3%
- Foreign-born
- 5% · Canada, China
- Languages at home
- 96% English-only · Spanish 1% German/W. Germanic 1% Other Asian/Pacific 1%
Political lean MEDSL · Lane
- 2024 margin
- Strong D (+23.1) · D 60.0% · R 36.9% · Other 3.1%
- 2008→2024 swing
- -4.3pp toward R · 2008: 27.4pp · 2024: 23.1pp
- All cycles
- 2024: D+23.1 2020: D+24.3 2016: D+18.9 2012: D+23.4 2008: D+27.4
Not yet ingested
- Civics
- —
Market trends
- HPI YoY
- ▲ 17.79%
- Current HPI
- 717.84
- Rent YoY
- —
- Metro
- —
- State GDP YoY
- ▲ 2.05%
- F500 in state
- 2
Industry mix (Fortune 500 HQ in OR)
| Industry | F500 HQs | Revenue |
|---|---|---|
| Consumer Goods | 1 | $51B |
|
||
Price history
+253.7% since first listed5 events — show timeline
- 2026-05-29 Listed $290,000 RMLS
- 2003-04-04 Sold (Public Records) $128,000 Public Records
- 2003-04-04 Sold (MLS) $128,000 RMLS
- 2002-07-28 Listed $129,000 RMLS
- 1993-04-14 Sold (Public Records) $82,000 Public Records
Property tax history
+3.4%/yrLatest (2025): $2,594 · +3.0% YoY. Source: county tax records.
Cash-flow waterfall
monthlySold comps — $/sqft
last 12 mo · ≤1 miLoading sold comps…