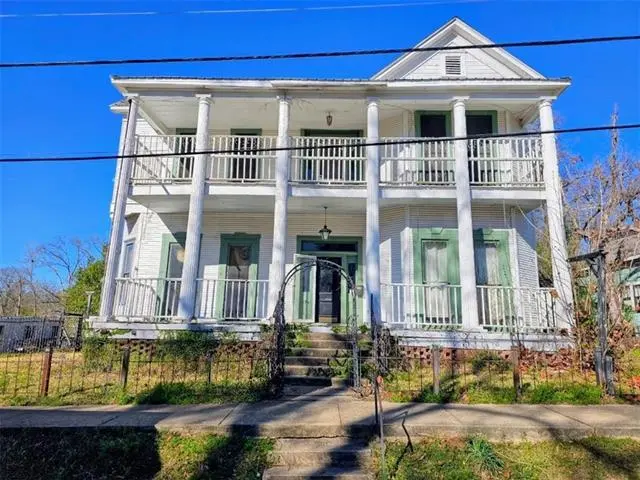
801 East Main St · Winnfield, LA
Flood risk No data
- FEMA flood zone
- —
- Chance of flooding over 30 yrs
- —
- Est. flood insurance / yr
- —
Fire risk No data
- Est. fire insurance / yr
- —
Heat risk No data
- Hot days now (above threshold)
- —
- Hot days in 30 yrs
- —
Wind risk No data
- Chance of severe wind over 30 yrs
- —
Air-quality risk No data
- Unhealthy air days now
- —
- Unhealthy air days in 30 yrs
- —
Risk factors via First Street. Map © Google.
Why this score? — see what drove the C- grade
The composite is a weighted blend of 9 inputs, each scored 0–100. Each bar is that input's sub-score; the figure is the points it added to the 100-point composite (weight × sub-score).
- Cash flow +18.8/30.0
- ARV discount +7.5/15.0
- Appreciation +6.6/10.0
- DSCR +5.9/10.0
- 1% rule +4.4/10.0
- Livability +2.9/5.0
- Rent growth +2.5/5.0
- Condition / age +2.5/5.0
- Schools +2.0/10.0
$139,900
🖨 Deal sheet 📄 Offer letter ✓ Due diligence
Listing remarks
This grand 1907 home, perfectly situated on Main Street, was once a charming Bed & Breakfast and is ready for its next chapter. Featuring 6 Spacious bedrooms and 6.5 bathrooms this spacious property offers timeless character with room to make it even more charming than it was. While the home does need some repairs it presents incredible potential for someone or an organization with a vision-whether you're looking to restore its former bed & breakfast charm, create a stunning private residence, or invest in something truly unique. Rich in history and full of opportunity, this property is being sold as-is and is available for cash or conventional financing. Don't miss out on a cha
Key facts
- 1 acre lot
- Pool
- Built 1907
Neighborhood map
What this means for you Summary
Snapshot
- This is a 6-bed/6.5-bath single-family listed at $140k.
Deal economics
- At list price, monthly cash flow is $140 ($2k/yr) — positive.
- The deal already cash-flows at list — no discount required.
- To meet the 1% rule (rent ≥ 1% of price), the offer needs to be $131k (6.5% below list).
- Recommended offer: $131k (6.5% below list) — sets the bar for 1% rule.
Location & tenants
- Location reads 57/100 on livability (#319 in LA) — a working-class tenant base; expect higher turnover. Strengths: cost of living A+, housing A; Watch: health & safety C-, crime F, amenities F.
- Winn Parish (rural): math 20% / reading 30% proficiency, ranked #61 of 98 in LA (top 62%) — low school quality limits family demand, transient renter base, plan for 1-2y turnover; 66% free/reduced lunch — lower-income household profile, screen leases tightly.
- Market conditions: 28 active listings in the ZIP; 1 units permitted in Winn Parish in 2024 (0 in 5+ unit buildings).
Forward outlook
- In year one you build about $5k of equity ($967 loan paydown + $4k appreciation (3.2% local appreciation)).
- Winn County population projected at -24% by 2050 — secular population decline; favor cash flow + early exit over multi-decade hold.
- At projected returns (3.2% appreciation + 3.0% rent growth), your $39k cash investment doubles in ~5 years — after that, you're playing with house money.
- By year 7, paydown + projected appreciation supports a ~$34k cash-out refi (75% LTV) — recoverable capital for the next deal without selling this one.
Negotiation context
- It's been on market 40 days — a 3% lower offer ($136k) is reasonable based on typical stale-listing flexibility.
- 2 sale attempts since 7y ago with the ask held roughly flat each time — persistent listings suggest the price (not the market) is what's stuck; bring a comps-based counter.
Risks & watch-outs
- Watch-outs: built in 1907 — expect roof / HVAC / electrical / plumbing capex.
Questions for the listing agent
- It's been on market 40 days. Have you received any prior offers? Is the seller open to a 6% concession, seller financing, or rate buy-down credit?
- Built in 1907 — when were the roof, HVAC, electrical panel, plumbing, and water heater last replaced?
- Is there a deadline driving the sale (1031 exchange, divorce, estate, relocation)? That informs how much negotiation room exists.
- Crime grade is F in this area — have there been break-ins, vandalism, or insurance claims at this property in the last 3 years? What carrier currently insures it and at what premium?
- What's the average days-on-market for RENTAL listings here right now (not sales)? A rising rental-DOM trend means longer vacancies and softer asking-rent achievability than the comps imply.
- What's the recent tenant-quality profile in this submarket — average credit score on applications, eviction rate, late-payment / NSF rate, and stable-employment percentage? A property-management company in the area should have these aggregated.
- How much new for-sale + rental construction is in the pipeline within 1–3 miles? Heavy new supply typically softens prices + rents 12–24 months out; constrained supply supports both.
Investment metrics
- 1% rule
- 0.94% ✗
- Cap rate
- 7.49%
- Cash-on-cash
- 4.29%
- DSCR
- 1.19
- GRM
- 8.9
CMA / ARV
No comps found within radius.
Projected returns pro-forma
3.19% appreciation · 3.0% rent growth · sell at horizon
- IRR
- 12.0%
- Equity multiple
- 1.69×
- Total profit
- $27,141
- Equity at exit
- $64,383
- IRR
- 13.9%
- Equity multiple
- 3.10×
- Total profit
- $82,389
- Equity at exit
- $100,386
Cash invested: $39,172 (down + closing). Projections, not guarantees.
Landlord ↔ Tenant lean methodology
- Overall (STATE)
- 90 Strongly Landlord-Friendly
- State Louisiana
- 90 Strongly Landlord-Friendly · R+12
- County
- — inherits STATE
- City
- — inherits STATE
ZIP-level market 71483
- Home prices YoY
- 3.9%
- Active inventory
- 28
- Price-to-rent
- 8.9×
Monthly cashflow live
- Estimated rent
- $1,308 medium interval (Pro) →
- Mortgage (P&I)
- −$734
- Tax from tax record
- −$101 /mo · $1,216/yr
- Insurance
- −$58
- HOA
- −$0
- Vacancy / Maint / Mgmt
- −$275
- Net cashflow
- $140
Break-even live
UW: 25.0% down · 7.5% · 30yr · 1.5% tax · 5.0% vac · 8.0% maint · 8.0% mgmt
Financing live
Cash to close
- Down payment
- $34,975
- Closing costs
- $4,197
- Reserves months
- —
- Total cash needed
- —
Loan-product check · same deal, 3 products live
Conventional
25% down · 7.5% · 30yr
- Down + closing
- —
- Monthly P&I
- —
- Monthly cashflow
- —
- DSCR
- —
- Eligible?
- —
Personal DTI + credit; lowest rate.
DSCR
20% down · 8.5% · 30yr
- Down + closing
- —
- Monthly P&I
- —
- Monthly cashflow
- —
- DSCR
- —
- Eligible?
- —
No personal income docs; deal must DSCR.
Hard money
10% down · 12.0% · 12mo
- Down + closing
- —
- Monthly P&I
- —
- Monthly cashflow
- —
- DSCR
- —
- Eligible?
- —
Short-term bridge; refi at stabilization.
Listing history 18 events
-
2026-06-18days on market $139,900 Active 40 DOM
-
2026-06-17days on market $139,900 Active 39 DOM
-
2026-06-16days on market $139,900 Active 38 DOM
-
2026-06-15days on market $139,900 Active 37 DOM
-
2026-06-13days on market $139,900 Active 35 DOM
-
2026-06-12days on market $139,900 Active 34 DOM
-
2026-06-09days on market $139,900 Active 31 DOM
-
2026-06-08days on market $139,900 Active 30 DOM
-
2026-06-07days on market $139,900 Active 29 DOM
-
2026-06-07days on market $139,900 Active 28 DOM
-
2026-06-04days on market $139,900 Active 25 DOM
-
2026-06-02days on market $139,900 Active 24 DOM
-
2026-06-01days on market $139,900 Active 23 DOM
-
2026-05-31days on market $139,900 Active 22 DOM
-
2026-05-31days on market $139,900 Active 21 DOM
-
2026-04-21status Pending
-
2026-03-31$139,900 Active
-
2019-11-27$165,000
ⓘ Source: listings_history table (triggers on properties + properties_extension) + one-shot
backfill from property_details.listing_events for pre-trigger history.
Tax reassessment forecast LA · Resets to sale price
- Current annual tax
- $1,216 · $101/mo
- Projected year-2 tax
- $1,216 · $101/mo
- Expected delta
- $0/yr ($0/mo · 0.0%)
ⓘ Screening estimate from a state-policy table — verify with the county assessor before closing.
Nearby sold comps map
Loading sold comps map…
Walkable amenities ~0.75 mi
Loading nearby amenities…
Taxation est. · year 1
- Rental income
- $15,697
- − Mortgage interest
- −$7,837
- − Property taxes
- −$1,216
- − Insurance
- −$700
- − Repairs & maintenance
- −$1,256
- − Management
- −$1,256
- − Depreciation
- −$4,070
- Taxable loss
- −$636
- Est. tax savings @ 24.0%
- +$153
- After-tax cash flow
- $1,834/yr
For passive investors: Depreciation is non-cash, so a rental often shows a tax loss while cash-flowing — sheltering income. Rental losses are passive: they offset passive income freely, and up to $25,000/yr can offset ordinary (W-2) income if you actively participate and your MAGI is under $100k (phasing out to $0 by $150k); unused losses carry forward. On sale, claimed depreciation is recaptured at up to 25%, and gains may owe capital-gains tax (a 1031 exchange can defer both). Figures are a year-1 estimate at your 24.0% rate — not tax advice; consult a CPA.
Schools (NCES district)
- District
- Winn Parish
- NCES district ID
- 2202010
- Math proficiency
- 20% ▼ -38.00%
- Reading proficiency
- 30% ▼ -39.00%
- Median HH income
- $32,872
- Composite
- 20.39/100
- National rank
- #8592
- State rank
- #61 of 98 in LA
Livability — Winnfield
- Score
- 57/100
- State rank
- #319
- US rank
- #21768
Category grades
Schools grade is shown separately in the Schools card above.
Census & demographics
- Census place
- Winnfield, LA
- Population (ZIP)
- 9,360
Population outlook (Winn County) Hauer SSP2
- Today (2025)
- 13,367 people
- By 2030
- 12,675 · -5.2%
- By 2040
- 11,391 · -14.8%
- By 2050
- 10,231 · -23.5%
- By 2075
- 7,699 · -42.4%
- By 2100
- 5,547 · -58.5%
Race, ethnicity, and origin ACS 2023
- Neighborhood character
- Diverse neighborhood (Simpson 0.59)
- Race & ethnicity
- White 53% Black 35% Hispanic / Latino 10% Two or more races 4%
- Hispanic origin (detail)
- Mexican 2% Cuban 2%
- Common ancestry
- Lithuanian 3% Slovak 2% Serbian 1%
- Foreign-born
- 7% · Canada, Jamaica
- Languages at home
- 92% English-only · Spanish 4% Other Indo-European 1% French/Haitian/Cajun 1%
Political lean MEDSL · Winn
- 2024 margin
- Solid R (+54.4) · D 22.4% · R 76.8%
- 2008→2024 swing
- -16.2pp toward R · 2008: -38.2pp · 2024: -54.4pp
- All cycles
- 2024: R+54.4 2020: R+49.4 2016: R+46.5 2012: R+40.1 2008: R+38.2
Not yet ingested
- Civics
- —
Market trends
- HPI YoY
- ▲ 3.19%
- Current HPI
- 84.0519
- Rent YoY
- —
- Metro
- —
- State GDP YoY
- ▲ 3.29%
- F500 in state
- 10
Industry mix (Fortune 500 HQ in LA)
| Industry | F500 HQs | Revenue |
|---|---|---|
| Telecommunications | 2 | $23B |
|
||
| Utilities | 1 | $12B |
|
||
| Wholesale / Distribution | 1 | $5B |
|
||
| Advertising | 1 | $2B |
|
||
Price history
-15.2% since first listed3 events — show timeline
- 2026-04-21 Pending — AcadianaMLS
- 2026-03-31 Listed $139,900 AcadianaMLS
- 2019-11-27 Listed $165,000 AcadianaMLS
Property tax history
-1.1%/yrLatest (2025): $1,216 · +0.0% YoY. Source: county tax records.
Cash-flow waterfall
monthlySold comps — $/sqft
last 12 mo · ≤1 miLoading sold comps…