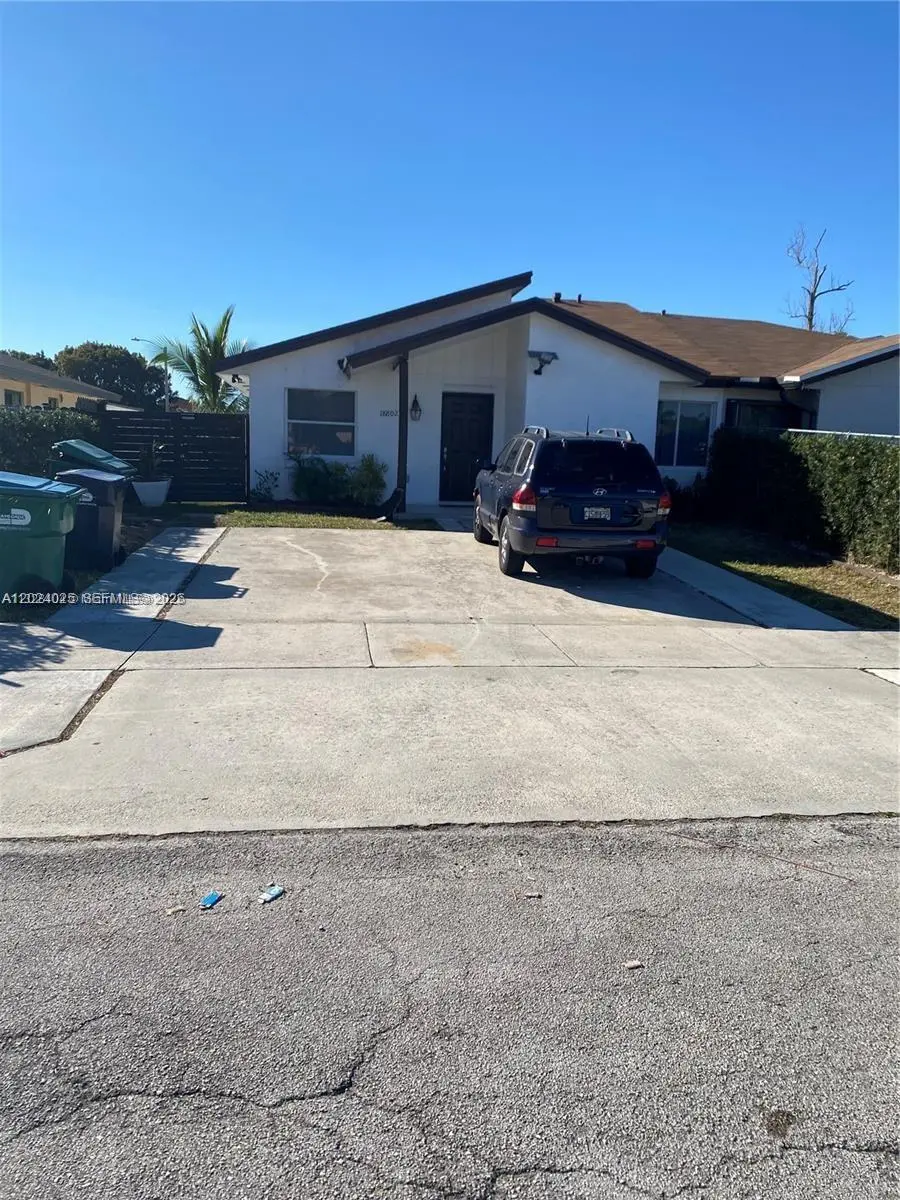
18802 SW 113th Ave #10 · South Miami Heights, FL
Flood risk 4/10 · Minor
- FEMA flood zone
- AH
- Chance of flooding over 30 yrs
- 0.21%
- Est. flood insurance / yr
- $1,142 – $2,507
Fire risk 1/10 · Minimal
- Est. fire insurance / yr
- $947 – $1,759
Heat risk 10/10 · Severe
- Hot days now (above 105°F)
- 7 days/yr
- Hot days in 30 yrs
- 32 days/yr
Wind risk 10/10 · Severe
- Chance of severe wind over 30 yrs
- 99.0%
Air-quality risk 2/10 · Minimal
- Unhealthy air days now
- 1 days/yr
- Unhealthy air days in 30 yrs
- 1 days/yr
Risk factors via First Street. Map © Google.
Why this score? — see what drove the D+ grade
The composite is a weighted blend of 9 inputs, each scored 0–100. Each bar is that input's sub-score; the figure is the points it added to the 100-point composite (weight × sub-score).
- Cash flow +15.0/30.0
- ARV discount +7.5/15.0
- 1% rule +5.0/10.0
- DSCR +5.0/10.0
- Schools +4.2/10.0
- Livability +3.9/5.0
- Condition / age +2.5/5.0
- Rent growth +2.3/5.0
- Appreciation +0.0/10.0
$3,000
🖨 Deal sheet 📄 Offer letter ✓ Due diligence
Listing remarks MLS
Beautiful Twin Home with separate in-laws quarters. Main house is a 2/2 with large bedrooms and remodeled Bathrooms. In-law quarters is a 1/1 with a small kitchenette. Conveniente located to shops, restaurants and the Turnpike.
Key facts
- 3 garage spots
- Built 1981
- Listed 10 days
Property features AI
Finance
- Other: Lease considered; No pets allowed
- HOA & community: Association covers laundry
Exterior
- Parking: 3 covered parking spaces; Garage with 3 spaces; Two or more parking spaces
- Security: Storm/security shutters
- Utilities: Electric water heater
- Home design: Single-story; Resale property; Entry at ground level; Attached property
- Construction: Block construction
- Exterior features: Fenced yard; Patio; Storm/security shutters
Interior
- Kitchen: Electric range; Refrigerator
- Flooring: Tile
- Bathrooms: 2 full bathrooms
- Heating & cooling: Central heating; Central air conditioning; Electric water heater
- Interior features: Bedroom on main level; First-floor entry
- Laundry & utility: Washer hookup; Dryer hookup; Laundry included in association amenities
Neighborhood map
What this means for you Summary
Snapshot
- This is a 2-bed/2.0-bath condo listed at $3k.
Deal economics
- At list price, monthly cash flow is $2k ($19k/yr) — positive.
- The deal already cash-flows at list — no discount required.
- Meets the 1% rule at list price ($2k rent vs $3k).
- Cap rate 692.4% vs local median 3.6% in South Miami Heights — top-decile yield for the area; either an underpriced asset or a hidden risk that comps aren't pricing in. Stress-test before assuming the spread holds.
Location & tenants
- Location reads 78/100 on livability (#169 in FL, #2,539 nationally) — a middle-class / working-renter tenant base. Strengths: housing A+, health & safety A+, schools A; Watch: employment D+, amenities F.
- Miami-Dade (suburban): math 45% / reading 54% proficiency, ranked #40 of 73 in FL (top 55%) — families likely to look elsewhere, expect single-tenant / working-renter base with shorter leases; 64% free/reduced lunch — lower-income household profile, screen leases tightly.
- Market conditions: Rents soft (-0.8%/yr); 376 active listings in the ZIP; 40 comparable units currently listed for rent nearby; rentals at typical pace (median 21d on market — plan ~3-4 weeks tenant-placement turnaround); solid renter incomes; 10,051 units permitted in Miami-Dade County in 2024 (7,758 in 5+ unit buildings).
- This rent runs 32% of the median local income ($82k/yr) — at the standard rent-burdened threshold; future hikes will face affordability resistance.
Forward outlook
- Local home prices are declining (-3.0%/yr); year-one equity from $21 of loan paydown is wiped out by about $90 of value loss. Plan a longer hold.
- Miami-Dade County population projected at +28% by 2050 — long-run rental-demand tailwind backs the buy-and-hold thesis.
- At projected returns (-3.0% appreciation + 0.0% rent growth), your $840 cash investment doubles in ~1 year — after that, you're playing with house money.
Negotiation context
- Only 10 days on market — expect competitive offers; lowballing is unlikely to land.
- 7 sale attempts since 12y ago with the ask held roughly flat each time — persistent listings suggest the price (not the market) is what's stuck; bring a comps-based counter.
Risks & watch-outs
- Watch-outs: flood insurance adds $152/mo.
- Climate carrying-cost: in FEMA flood zone AH (mandatory federal flood insurance); severe wind risk, 99% chance of damaging wind over 30y; extreme-heat days projected 7→32/yr by 2055 (HVAC capex compounding) — expect insurance premiums to compound above CPI over the hold.
Questions for the listing agent
- What's the actual annual flood-insurance premium (NFIP or private), and is the property in a SFHA with mandatory coverage?
- Any open or pending special assessments — roof, HVAC, plumbing, elevator, façade? What's the per-unit balance and payoff schedule, and is the seller paying it off at close or rolling it to the buyer?
- Is there a deadline driving the sale (1031 exchange, divorce, estate, relocation)? That informs how much negotiation room exists.
- Schools are A-rated — typically a magnet for longer-tenancy family renters. What's the average tenant stay here, and is there a school-zone premium baked into asking?
- The area grade is low — what's the realistic commute time and amenity access for the typical tenant pool here? Any planned neighborhood developments (good or bad) we should know about?
- What's the average days-on-market for RENTAL listings here right now (not sales)? A rising rental-DOM trend means longer vacancies and softer asking-rent achievability than the comps imply.
- What's the recent tenant-quality profile in this submarket — average credit score on applications, eviction rate, late-payment / NSF rate, and stable-employment percentage? A property-management company in the area should have these aggregated.
- How much new apartment / multifamily construction is in the pipeline within 1–3 miles? Heavy new supply (>2% of stock underway) typically softens rents 12–24 months out; light construction supports rent growth.
Investment metrics
- 1% rule
- 73.25% ✓
- Cap rate
- 692.40%
- Cash-on-cash
- 2450.38%
- DSCR
- 110.03
- GRM
- 0.1
CMA / ARV
No comps found within radius.
Projected returns pro-forma
-3.0% appreciation · 0.0% rent growth · sell at horizon
- IRR
- —
- Equity multiple
- 111.43×
- Total profit
- $92,763
- Equity at exit
- $447
- IRR
- —
- Equity multiple
- 220.77×
- Total profit
- $184,606
- Equity at exit
- $259
Cash invested: $840 (down + closing). Projections, not guarantees.
Landlord ↔ Tenant lean methodology
- Overall (STATE)
- 87 Strongly Landlord-Friendly
- State Florida
- 87 Strongly Landlord-Friendly · R+3
- County
- — inherits STATE
- City
- — inherits STATE
ZIP-level market 33157
- Rents YoY
- -0.8%
- Active inventory
- 376
- Price-to-rent
- 0.1×
Monthly cashflow live
- Estimated rent
- $2,197 high interval (Pro) →
- Mortgage (P&I)
- −$16
- Tax est. 1.5%
- −$4 /mo · $45/yr
- Insurance
- −$1
- Flood insurance flood zone
- −$152 /mo · $1,824/yr
- HOA
- −$0
- Vacancy / Maint / Mgmt
- −$461
- Net cashflow
- $1,563
Break-even live
UW: 25.0% down · 7.5% · 30yr · 1.5% tax · 5.0% vac · 8.0% maint · 8.0% mgmt
Financing live
Cash to close
- Down payment
- $750
- Closing costs
- $90
- Reserves months
- —
- Total cash needed
- —
Loan-product check · same deal, 3 products live
Conventional
25% down · 7.5% · 30yr
- Down + closing
- —
- Monthly P&I
- —
- Monthly cashflow
- —
- DSCR
- —
- Eligible?
- —
Personal DTI + credit; lowest rate.
DSCR
20% down · 8.5% · 30yr
- Down + closing
- —
- Monthly P&I
- —
- Monthly cashflow
- —
- DSCR
- —
- Eligible?
- —
No personal income docs; deal must DSCR.
Hard money
10% down · 12.0% · 12mo
- Down + closing
- —
- Monthly P&I
- —
- Monthly cashflow
- —
- DSCR
- —
- Eligible?
- —
Short-term bridge; refi at stabilization.
Rent comps 40 comps
| Address | Beds | Baths | Sqft | Rent | $/sqft | DOM | Units | Dist |
|---|---|---|---|---|---|---|---|---|
| 11750 SW 186th St Miami, FL | 3.0 | 1.0 | 864 | $2,400 | $2.78 | 20d | 1 | 0.46mi |
| 18305 SW 110th Ave Unit 18305 (Bldg 1) -109 Miami, FL | 2.0 | 2.0 | 986 | $2,430 | $2.46 | 24d | 1 | 0.49mi |
| 11930 SW 187th St Unit 1 Miami, FL | 1.0 | 1.0 | 580 | $1,400 | $2.41 | 24d | 1 | 0.68mi |
| 11309 SW 200th St Unit 103C Miami, FL | 2.0 | 2.0 | 840 | $2,100 | $2.50 | 24d | 1 | 0.73mi |
| 11307 SW 200th St Unit 106B Miami, FL | 2.0 | 2.0 | 840 | $1,900 | $2.26 | 21d | 1 | 0.74mi |
| 19771 SW 114th Ave #328 Miami, FL | 2.0 | 2.0 | 800 | $1,900 | $2.38 | 18d | 1 | 0.74mi |
| 19791 SW 114th Ave Miami, FL | 2.0 | 2.0 | 800 | $1,700 | $2.12 | 8d | 2 | 0.74mi |
| 19729 SW 114th Ave #250 Miami, FL | 2.0 | 2.0 | 800 | $1,675 | $2.09 | 11d | 1 | 0.74mi |
| 19751 SW 114th Ave Unit 347 Miami, FL | 2.0 | 2.0 | 800 | $1,875 | $2.34 | 24d | 1 | 0.74mi |
| 19751 SW 114th Ave #349 Miami, FL | 2.0 | 2.0 | 800 | $1,790 | $2.24 | 5d | 1 | 0.74mi |
| 19751 SW 114th Ave Miami, FL | 2.0 | 2.0 | 800 | $1,812 | $2.27 | 18d | 2 | 0.74mi |
| 19729 SW 114th Ave #150 Miami, FL | 2.0 | 2.0 | 800 | $1,980 | $2.48 | 8d | 1 | 0.74mi |
| 19729 SW 114th Ave #150 Miami, FL | 2.0 | 2.0 | 800 | $1,980 | $2.48 | 22d | 1 | 0.74mi |
| 19715 SW 114th Ave #352 Miami, FL | 2.0 | 2.0 | 800 | $1,700 | $2.12 | 24d | 1 | 0.74mi |
| 19841 SW 114th Ave #310 Miami, FL | 2.0 | 2.0 | 800 | $1,750 | $2.19 | 24d | 1 | 0.74mi |
| 11050 SW 196th St #103 Cutler Bay, FL | 2.0 | 2.0 | 809 | $1,950 | $2.41 | 22d | 1 | 0.75mi |
| 11040 SW 196th St Cutler Bay, FL | 2.0 | 2.0 | 809 | $2,070 | $2.56 | 5d | 2 | 0.75mi |
| 11040 SW 196th St #412 Cutler Bay, FL | 2.0 | 2.0 | 809 | $2,200 | $2.72 | 15d | 1 | 0.75mi |
| 19800 SW 110th Ct Cutler Bay, FL | 1.0 | 1.0 | 625 | $1,572 | $2.52 | 3d | 1 | 0.76mi |
| 11301 SW 200th St Unit 104A Miami, FL | 1.0 | 1.5 | 703 | $1,600 | $2.28 | 11d | 1 | 0.80mi |
| 11301 SW 200th St Unit 108A Miami, FL | 1.0 | 1.5 | 703 | $1,449 | $2.06 | 22d | 1 | 0.80mi |
| 11060 SW 196th St Cutler Bay, FL | 2.0 | 2.0 | 861 | $1,862 | $2.16 | 21d | 3 | 0.80mi |
| 11060 SW 196th St Cutler Bay, FL | 2.0 | 2.0 | 861 | $1,950 | $2.26 | 24d | 2 | 0.80mi |
| 11060 SW 196th St Cutler Bay, FL | 2.0 | 2.0 | 861 | $1,950 | $2.26 | 5d | 2 | 0.80mi |
| 19800 SW 103rd Ct #201 Cutler Bay, FL | 2.0 | 2.0 | 921 | $2,250 | $2.44 | 2d | 1 | 0.98mi |
| 20221 SW 112th Ct Unit 2 Miami, FL | 1.0 | 1.0 | 607 | $1,300 | $2.14 | 24d | 1 | 0.99mi |
| 20221 SW 112th Ct Unit 2 Miami, FL | 1.0 | 1.0 | 607 | $1,300 | $2.14 | 4d | 1 | 0.99mi |
| 19701 SW 103rd Ct Unit 19701 Cutler Bay, FL | 3.0 | 1.0 | 1044 | $2,600 | $2.49 | 24d | 1 | 1.01mi |
| 19362 SW 103rd Ct Unit B Cutler Bay, FL | 3.0 | 2.0 | 974 | $2,600 | $2.67 | 4d | 1 | 1.05mi |
| 19362 SW 103rd Ct Unit B Cutler Bay, FL | 3.0 | 2.0 | 974 | $2,600 | $2.67 | 24d | 1 | 1.05mi |
| 18505 Homestead Ave Miami, FL | 2.0 | 1.0–2.0 | 621 | $1,847 | $2.97 | 24d | 1 | 1.12mi |
| 18412 Homestead Ave Miami, FL | 1.0–3.0 | 1.0–2.0 | 859 | $2,624 | $3.05 | 24d | 1 | 1.17mi |
| 10622 SW 174th Ter Unit 10622 Miami, FL | 2.0 | 1.0 | 816 | $2,000 | $2.45 | 8d | 1 | 1.17mi |
| 18772 SW 100th Ave #18772 Cutler Bay, FL | 2.0 | 2.5 | 1100 | $2,000 | $1.82 | 8d | 1 | 1.21mi |
| 18772 SW 100th Ave #18772 Cutler Bay, FL | 2.0 | 2.5 | 1100 | $2,075 | $1.89 | 14d | 1 | 1.21mi |
| 17221 SW 119th Ct Miami, FL | 2.0 | 2.0 | 1000 | $2,750 | $2.75 | 24d | 1 | 1.23mi |
| 20225 SW 106th Ave Cutler Bay, FL | 3.0 | 1.0 | 968 | $2,650 | $2.74 | 21d | 1 | 1.24mi |
| 18706 SW 100th Ave #18706 Cutler Bay, FL | 2.0 | 2.5 | 1100 | $4,200 | $3.82 | 24d | 1 | 1.25mi |
| 18706 SW 100th Ave Unit 1044543P Cutler Bay, FL | 2.0 | 2.5 | 1097 | $3,573 | $3.26 | 3d | 1 | 1.25mi |
| 17727 SW 103rd Ave Unit 17727 Miami, FL | 3.0 | 1.0 | 650 | $1,950 | $3.00 | 24d | 1 | 1.29mi |
HOA detail condo
- Monthly dues
- $0 · $0/yr
- Assessments
- None detected in remarks — confirm with the listing agent.
Listing history 27 events
-
2026-06-07days on market $3,000 Active 10 DOM
-
2026-06-04days on market $3,000 Active 7 DOM
-
2026-06-03days on market $3,000 Active 6 DOM
-
2026-06-02days on market $3,000 Active 5 DOM
-
2026-06-01days on market $3,000 Active 4 DOM
-
2026-05-31days on market $3,000 Active 3 DOM
-
2026-05-21$3,000 Active
-
2022-01-06soldstatus $295,000
-
2021-12-29soldstatus $295,000 Closed 227-char remark
Show marketing remark (227 chars)
Beautiful Twin Home with separate in-laws quarters. Main house is a 2/2 with large bedrooms and remodeled Bathrooms. In-law quarters is a 1/1 with a small kitchenette. Conveniente located to shops, restaurants and the Turnpike.
-
2021-12-16status Pending 227-char remark
Show marketing remark (227 chars)
Beautiful Twin Home with separate in-laws quarters. Main house is a 2/2 with large bedrooms and remodeled Bathrooms. In-law quarters is a 1/1 with a small kitchenette. Conveniente located to shops, restaurants and the Turnpike.
-
2021-11-11historical Active Under Contract 227-char remark
Show marketing remark (227 chars)
Beautiful Twin Home with separate in-laws quarters. Main house is a 2/2 with large bedrooms and remodeled Bathrooms. In-law quarters is a 1/1 with a small kitchenette. Conveniente located to shops, restaurants and the Turnpike.
-
2021-11-03$290,000 Active 227-char remark
Show marketing remark (227 chars)
Beautiful Twin Home with separate in-laws quarters. Main house is a 2/2 with large bedrooms and remodeled Bathrooms. In-law quarters is a 1/1 with a small kitchenette. Conveniente located to shops, restaurants and the Turnpike.
-
2019-10-29soldstatus $127,000
-
2019-09-13soldstatus $127,000 Sold 86-char remark
Show marketing remark (86 chars)
this 2bed 2 bath twin home, is a great investment. you will be proud to call this home
-
2019-08-14status Backup Contract 86-char remark
Show marketing remark (86 chars)
this 2bed 2 bath twin home, is a great investment. you will be proud to call this home
-
2019-02-07$132,000 Active 86-char remark
Show marketing remark (86 chars)
this 2bed 2 bath twin home, is a great investment. you will be proud to call this home
-
2018-12-05historical
-
2017-12-06$129,900 Active
-
2017-06-07historical
-
2016-06-20$145,000 Active
-
2015-03-21historical
-
2014-11-25historical
-
2014-11-25$125,000 Active
-
2014-03-20$170,000 Active
-
2005-05-13soldstatus $96,000
-
1999-06-30soldstatus $30,000
-
1982-05-01soldstatus $54,900
ⓘ Source: listings_history table (triggers on properties + properties_extension) + one-shot
backfill from property_details.listing_events for pre-trigger history.
Climate risk First Street
- Flood 4/10 Moderate FEMA zone AH · 21% chance over 30 yrs
- Wildfire 1/10 Low
- Heat 10/10 Extreme 7 d/yr ≥105°F today · 32 d/yr by 30 yrs out
- Wind 10/10 Extreme 99% chance of damaging wind over 30 yrs
- Air quality 2/10 Low 1 unhealthy d/yr today · 1 by 30 yrs out
Nearby sold comps map
Loading sold comps map…
Walkable amenities ~0.75 mi
Loading nearby amenities…
Taxation est. · year 1
- Rental income
- $26,370
- − Mortgage interest
- −$168
- − Property taxes
- −$45
- − Insurance
- −$1,840
- − Repairs & maintenance
- −$2,110
- − Management
- −$2,110
- − Depreciation
- −$87
- Taxable income
- $20,011
- Est. tax owed @ 24.0%
- −$4,803
- After-tax cash flow
- $13,956/yr
For passive investors: Depreciation is non-cash, so a rental often shows a tax loss while cash-flowing — sheltering income. Rental losses are passive: they offset passive income freely, and up to $25,000/yr can offset ordinary (W-2) income if you actively participate and your MAGI is under $100k (phasing out to $0 by $150k); unused losses carry forward. On sale, claimed depreciation is recaptured at up to 25%, and gains may owe capital-gains tax (a 1031 exchange can defer both). Figures are a year-1 estimate at your 24.0% rate — not tax advice; consult a CPA.
Schools (NCES district)
- District
- Miami-Dade
- NCES district ID
- 1200390
- Math proficiency
- 45% ▼ -16.00%
- Reading proficiency
- 54% ▼ -5.00%
- Median HH income
- $43,928
- Composite
- 41.76/100
- National rank
- #3397
- State rank
- #40 of 73 in FL
Livability — South Miami Heights
- Score
- 78/100
- State rank
- #169
- US rank
- #2539
Category grades
Schools grade is shown separately in the Schools card above.
Census & demographics
- Census place
- South Miami Heights, FL
- County
- Miami-Dade County · 2,697,751 people
- Metro
- Miami-Fort Lauderdale-Pompano Beach, FL
- Population (ZIP)
- 70,596
- Household income
- $81,589
- Rent vs Own
- Severe rent burden
- 2340.0
Population outlook (Miami-Dade County) Hauer SSP2
- Today (2025)
- 3,126,439 people
- By 2030
- 3,325,765 · +6.4%
- By 2040
- 3,697,561 · +18.3%
- By 2050
- 4,012,134 · +28.3%
- By 2075
- 4,605,612 · +47.3%
- By 2100
- 4,866,598 · +55.7%
Race, ethnicity, and origin ACS 2023
- Neighborhood character
- Diverse neighborhood (Simpson 0.61)
- Race & ethnicity
- Hispanic / Latino 56% Two or more races 33% Black 19% White 19% Asian 2%
- Hispanic origin (detail)
- Mexican 2% Puerto Rican 3% Cuban 30% Dominican 1%
- Common ancestry
- Hispanic 2% Lithuanian 1% Romanian 1%
- Foreign-born
- 42% · Canada, Jamaica, China
- Languages at home
- 43% English-only · Spanish 52% French/Haitian/Cajun 2% Other Indo-European 1%
Political lean MEDSL · Miami-Dade
- 2024 margin
- R (+11.4) · D 43.9% · R 55.4%
- 2008→2024 swing
- -27.6pp toward R · 2008: 16.1pp · 2024: -11.4pp
- All cycles
- 2024: R+11.4 2020: D+7.3 2016: D+29.6 2012: D+23.7 2008: D+16.1
Not yet ingested
- Civics
- —
Market trends
- HPI YoY
- ▼ -457.85%
- Current HPI
- 481.93
- Rent YoY
- ▼ -0.75%
- Metro
- Miami-Fort Lauderdale-Pompano Beach, FL
- State GDP YoY
- ▲ 3.28%
- F500 in state
- 36
Industry mix (Fortune 500 HQ in FL)
| Industry | F500 HQs | Revenue |
|---|---|---|
| Industrial Technology | 2 | $29B |
|
||
| Insurance | 2 | $17B |
|
||
| Retail | 1 | $60B |
|
||
| Technology Distribution | 1 | $58B |
|
||
| Homebuilding | 1 | $35B |
|
||
| Technology Manufacturing | 1 | $35B |
|
||
Price history
-94.5% since first listed21 events — show timeline
- 2026-05-21 Listed $3,000 MARMLS
- 2022-01-06 Sold (Public Records) $295,000 Public Records
- 2021-12-29 Sold (MLS) $295,000 MARMLS
- 2021-12-16 Pending — MARMLS
- 2021-11-11 Contingent — MARMLS
- 2021-11-03 Listed $290,000 MARMLS
- 2019-10-29 Sold (Public Records) $127,000 Public Records
- 2019-09-13 Sold (MLS) $127,000 MARMLS
- 2019-08-14 Pending — MARMLS
- 2019-02-07 Listed $132,000 MARMLS
- 2018-12-05 Listing Removed — MARMLS
- 2017-12-06 Listed $129,900 MARMLS
- 2017-06-07 Listing Removed — MARMLS
- 2016-06-20 Listed $145,000 MARMLS
- 2015-03-21 Listing Removed — MARMLS
- 2014-11-25 Listing Removed — MARMLS
- 2014-11-25 Listed $125,000 MARMLS
- 2014-03-20 Listed $170,000 MARMLS
- 2005-05-13 Sold (Public Records) $96,000 Public Records
- 1999-06-30 Sold (Public Records) $30,000 Public Records
- 1982-05-01 Sold (Public Records) $54,900 Public Records
Property tax history
+9.4%/yrLatest (2025): $4,367 · +4.8% YoY. Source: county tax records.
Cash-flow waterfall
monthlySold comps — $/sqft
last 12 mo · ≤1 miLoading sold comps…