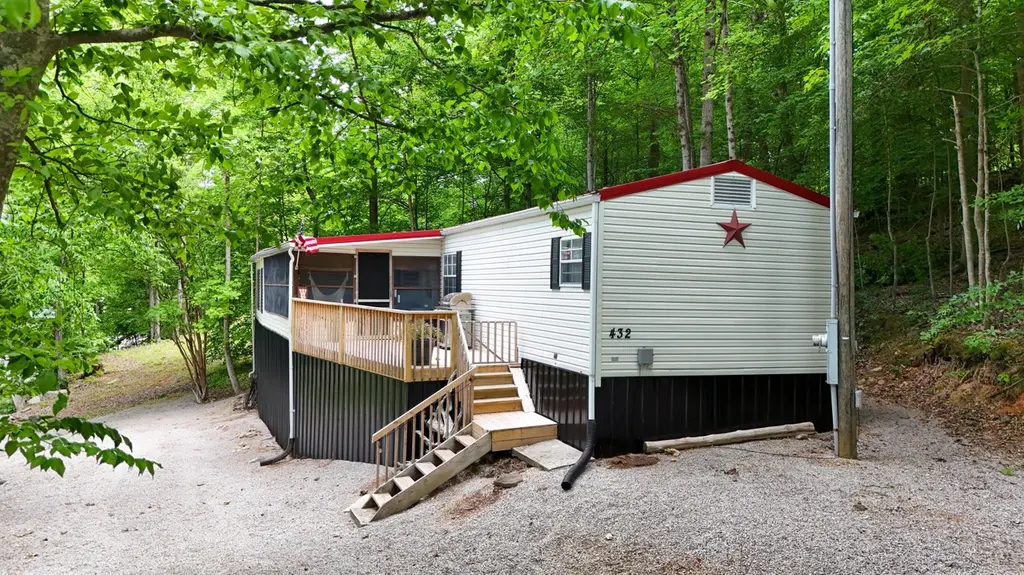
432 N Lake Dr · Burnside, KY
Flood risk 1/10 · Minimal
- FEMA flood zone
- X (unshaded)
- Chance of flooding over 30 yrs
- 0.0%
- Est. flood insurance / yr
- $507 – $1,088
Fire risk 3/10 · Minor
- Est. fire insurance / yr
- $839 – $1,559
Heat risk 4/10 · Minor
- Hot days now (above 102°F)
- 7 days/yr
- Hot days in 30 yrs
- 20 days/yr
Wind risk 2/10 · Minimal
- Chance of severe wind over 30 yrs
- 4.0%
Air-quality risk 1/10 · Minimal
- Unhealthy air days now
- 0 days/yr
- Unhealthy air days in 30 yrs
- 0 days/yr
Risk factors via First Street. Map © Google.
Why this score? — see what drove the A grade
The composite is a weighted blend of 9 inputs, each scored 0–100. Each bar is that input's sub-score; the figure is the points it added to the 100-point composite (weight × sub-score).
- Cash flow +30.0/30.0
- ARV discount +15.0/15.0
- 1% rule +10.0/10.0
- DSCR +10.0/10.0
- Appreciation +7.6/10.0
- Schools +4.0/10.0
- Livability +3.6/5.0
- Rent growth +2.5/5.0
- Condition / age +2.5/5.0
$95,000
🖨 Deal sheet (PDF) 📄 Offer letter ✓ Due diligence
Listing remarks
Welcome to lake living at its finest in the highly sought-after Dixie Bend boating community near beautiful Lake Cumberland. This well-maintained 3-bedroom, 2-bath manufactured home offers the perfect blend of comfort, privacy, and investment potential—all tucked away on a peaceful wooded lot with seasonal lake views from the front porch. Fully furnished and truly move-in ready, this property allows you to start enjoying the lake lifestyle immediately—just bring your personal belongings. Designed for both relaxation and functionality, the home offers a comfortable layout ideal for weekend getaways, full-time living, or short-term rental opportunities such as Airbnb. Enjoy the se
Key facts
- Move-in ready
- Peaceful wooded lot
- Seasonal lake views
Tags
Property features AI
Finance
- Other: Located in the Dixie Bend subdivision, Pulaski County
- HOA & community: Has association with annual fee
Exterior
- Utilities: Septic tank sewer
- Home design: Manufactured house
- Construction: Vinyl siding; Pillar/post/pier foundation; Built area approximately 1,110
- Exterior features: Half-acre lot; Trees/woods and water views; Public water
Interior
- Kitchen: Dishwasher; Microwave; Refrigerator; Oven
- Flooring: Carpet; Vinyl
- Bathrooms: 2 full bathrooms
- Heating & cooling: Electric heating; Has heating
- Interior features: Dishwasher; Microwave; Refrigerator; Oven; Carpet flooring; Vinyl flooring; 7 total rooms; No fireplace
Neighborhood map
What this means for you Summary
Snapshot
- This is a 3-bed/1.5-bath manufactured listed at $95k.
Deal economics
- At list price, monthly cash flow is $569 ($7k/yr) — positive.
- The deal already cash-flows at list — no discount required.
- Meets the 1% rule at list price ($1k rent vs $95k).
- Recommended offer: $92k (3.0% below list) — sets the bar for market timing.
- Cap rate 13.5% vs local median 3.0% in Burnside — top-decile yield for the area; either an underpriced asset or a hidden risk that comps aren't pricing in. Stress-test before assuming the spread holds.
Location & tenants
- Location reads 71/100 on livability (#141 in KY) — a middle-class / working-renter tenant base. Strengths: crime A+, cost of living A+, health & safety A+; Watch: amenities F, commute F.
- Pulaski County (town): math 43% / reading 53% proficiency, ranked #17 of 165 in KY (top 10%) — families likely to look elsewhere, expect single-tenant / working-renter base with shorter leases.
- Zoned schools: Burnside Elementary School (math 32% / reading 42%, grade F, #255 of 676 statewide, top 42%, 432 students, 84% FRL); Southern Middle School (math 41% / reading 50%, grade D+, #32 of 217 statewide, top 15%, 941 students, 68% FRL); Pulaski County High School (math 42% / reading 47%, grade F, #21 of 254 statewide, top 10%, 1,209 students, 57% FRL).
- Market conditions: 84 active listings in the ZIP; 117 units permitted in Pulaski County in 2024 (50 in 5+ unit buildings).
Forward outlook
- In year one you build about $6k of equity ($657 loan paydown + $5k appreciation (5.2% local appreciation)).
- At projected returns (5.2% appreciation + 3.0% rent growth), your $27k cash investment doubles in ~3 years — after that, you're playing with house money.
- By year 6, paydown + projected appreciation supports a ~$30k cash-out refi (75% LTV) — recoverable capital for the next deal without selling this one.
Negotiation context
- It's been on market 39 days — a 3% lower offer ($92k) is reasonable based on typical stale-listing flexibility.
- Current owner paid $42k; list at $95k implies a 126% gain — meaningful room to come down on a strong offer.
Questions for the listing agent
- It's been on market 39 days. Have you received any prior offers? Is the seller open to a 3% concession, seller financing, or rate buy-down credit?
- What does the HOA fee cover, when was the last increase, and are there any pending special assessments or reserve-fund shortfalls?
- Is there a deadline driving the sale (1031 exchange, divorce, estate, relocation)? That informs how much negotiation room exists.
- Schools are D-rated, which usually means shorter tenancies and higher turnover. Who's the typical renter profile here, and what's been the actual vacancy rate?
- What's the average days-on-market for RENTAL listings here right now (not sales)? A rising rental-DOM trend means longer vacancies and softer asking-rent achievability than the comps imply.
- What's the recent tenant-quality profile in this submarket — average credit score on applications, eviction rate, late-payment / NSF rate, and stable-employment percentage? A property-management company in the area should have these aggregated.
- How much new for-sale + rental construction is in the pipeline within 1–3 miles? Heavy new supply typically softens prices + rents 12–24 months out; constrained supply supports both.
Investment metrics
- 1% rule
- 1.53% ✓
- Cap rate
- 13.48%
- Cash-on-cash
- 25.66%
- DSCR
- 2.14
- GRM
- 5.5
CMA / ARV
- ARV (median comp)
- $138,124
- List price
- $95,000
- Delta
- -31.22%
- Verdict
- UNDERPRICED
- Comps
- 7 within 1.0 mi
Projected returns pro-forma
5.19% appreciation · 3.0% rent growth · sell at horizon
- IRR
- 35.6%
- Equity multiple
- 3.22×
- Total profit
- $59,150
- Equity at exit
- $54,953
- IRR
- 33.7%
- Equity multiple
- 6.53×
- Total profit
- $146,973
- Equity at exit
- $95,779
Cash invested: $26,600 (down + closing). Projections, not guarantees.
Landlord ↔ Tenant lean methodology
- Overall (STATE)
- 83 Strongly Landlord-Friendly
- State Kentucky
- 83 Strongly Landlord-Friendly · R+16
- County
- — inherits STATE
- City
- — inherits STATE
ZIP-level market 42519
- Home prices YoY
- 1.5%
- Active inventory
- 84
- Price-to-rent
- 5.5×
Monthly cashflow live
- Estimated rent
- $1,449 medium interval (Pro) →
- Mortgage (P&I)
- −$498
- Tax from tax record
- −$25 /mo · $304/yr
- Insurance
- −$40
- HOA
- −$13
- Vacancy / Maint / Mgmt
- −$304
- Net cashflow
- $569
Break-even live
Sensitivity live
| Price | -10% $623 | -5% $596 | +0% $569 | +5% $542 | +10% $515 |
|---|---|---|---|---|---|
| Rent | -10% $454 | -5% $512 | +0% $569 | +5% $626 | +10% $683 |
| Rate | -1.0pp $617 | -0.5pp $593 | base $569 | +0.5pp $544 | +1.0pp $519 |
UW: 25.0% down · 7.5% · 30yr · 1.5% tax · 5.0% vac · 8.0% maint · 8.0% mgmt
Financing live
Cash to close
- Down payment
- $23,750
- Closing costs
- $2,850
- Reserves months
- —
- Total cash needed
- —
Loan-product check · same deal, 3 products live
Conventional
25% down · 7.5% · 30yr
- Down + closing
- —
- Monthly P&I
- —
- Monthly cashflow
- —
- DSCR
- —
- Eligible?
- —
Personal DTI + credit; lowest rate.
DSCR
20% down · 8.5% · 30yr
- Down + closing
- —
- Monthly P&I
- —
- Monthly cashflow
- —
- DSCR
- —
- Eligible?
- —
No personal income docs; deal must DSCR.
Hard money
10% down · 12.0% · 12mo
- Down + closing
- —
- Monthly P&I
- —
- Monthly cashflow
- —
- DSCR
- —
- Eligible?
- —
Short-term bridge; refi at stabilization.
HOA detail
- Monthly dues
- $13 · $156/yr
Listing history 20 events
-
2026-06-22days on market $95,000 Active 39 DOM
-
2026-06-21days on market $95,000 Active 38 DOM
-
2026-06-21days on market $95,000 Active 37 DOM
-
2026-06-18days on market $95,000 Active 35 DOM
-
2026-06-17days on market $95,000 Active 34 DOM
-
2026-06-16days on market $95,000 Active 33 DOM
-
2026-06-15days on market $95,000 Active 32 DOM
-
2026-06-13days on market $95,000 Active 30 DOM
-
2026-06-12days on market $95,000 Active 29 DOM
-
2026-06-09days on market $95,000 Active 26 DOM
-
2026-06-08days on market $95,000 Active 25 DOM
-
2026-06-07days on market $95,000 Active 24 DOM
-
2026-06-07days on market $95,000 Active 23 DOM
-
2026-06-04days on market $95,000 Active 20 DOM
-
2026-06-02days on market $95,000 Active 19 DOM
-
2026-06-01days on market $95,000 Active 18 DOM
-
2026-05-31days on market $95,000 Active 17 DOM
-
2026-05-31days on market $95,000 Active 16 DOM
-
2026-05-14$95,000 Active 1153-char remark
-
2018-04-27soldstatus $42,000
ⓘ Source: listings_history table (triggers on properties + properties_extension) + one-shot
backfill from property_details.listing_events for pre-trigger history.
Tax reassessment forecast KY · Resets to sale price
- Current annual tax
- $304 · $25/mo
- Projected year-2 tax
- $817 · $68/mo
- Expected delta
- +$513/yr (+$43/mo · 169.0%)
ⓘ Screening estimate from a state-policy table — verify with the county assessor before closing.
Climate risk First Street
- Flood 1/10 Low FEMA zone X (unshaded) · 0% chance over 30 yrs
- Wildfire 3/10 Moderate
- Heat 4/10 Moderate 7 d/yr ≥102°F today · 20 d/yr by 30 yrs out
- Wind 2/10 Low 4% chance of damaging wind over 30 yrs
- Air quality 1/10 Low 0 unhealthy d/yr today · 0 by 30 yrs out
Nearby sold comps map
Loading sold comps map…
Walkable amenities ~0.75 mi
Loading nearby amenities…
Taxation est. · year 1
- Rental income
- $17,392
- − Mortgage interest
- −$5,321
- − Property taxes
- −$304
- − Insurance
- −$475
- − Repairs & maintenance
- −$1,391
- − Management
- −$1,391
- − HOA
- −$156
- − Depreciation
- −$2,764
- Taxable income
- $5,589
- Est. tax owed @ 24.0%
- −$1,341
- After-tax cash flow
- $5,485/yr
For passive investors: Depreciation is non-cash, so a rental often shows a tax loss while cash-flowing — sheltering income. Rental losses are passive: they offset passive income freely, and up to $25,000/yr can offset ordinary (W-2) income if you actively participate and your MAGI is under $100k (phasing out to $0 by $150k); unused losses carry forward. On sale, claimed depreciation is recaptured at up to 25%, and gains may owe capital-gains tax (a 1031 exchange can defer both). Figures are a year-1 estimate at your 24.0% rate — not tax advice; consult a CPA.
Schools (NCES district)
- District
- Pulaski County
- NCES district ID
- 2104950
- Math proficiency
- 43% ▼ -18.00%
- Reading proficiency
- 53% ▼ -13.00%
- Median HH income
- $35,366
- Composite
- 39.69/100
- National rank
- #3906
- State rank
- #17 of 165 in KY
Livability — Burnside
- Score
- 71/100
- State rank
- #141
- US rank
- #6774
Category grades
Schools grade is shown separately in the Schools card above.
Census & demographics
- Population (ZIP)
- 2,800
Population outlook (Pulaski County) Hauer SSP2
- Today (2025)
- 65,414 people
- By 2030
- 65,828 · +0.6%
- By 2040
- 65,972 · +0.9%
- By 2050
- 65,108 · -0.5%
- By 2075
- 61,647 · -5.8%
- By 2100
- 53,613 · -18.0%
Race, ethnicity, and origin ACS 2023
- Neighborhood character
- Predominantly White (88%)
- Race & ethnicity
- White 88% Two or more races 10% Hispanic / Latino 3% Native American 1%
- Common ancestry
- Italian 2% Serbian 1% Lithuanian 1%
- Foreign-born
- 1% · Canada
Political lean MEDSL · Pulaski
- 2024 margin
- Solid R (+65.2) · D 16.9% · R 82.1% · Other 1.0%
- 2008→2024 swing
- -9.9pp toward R · 2008: -55.4pp · 2024: -65.2pp
- All cycles
- 2024: R+65.2 2020: R+62.7 2016: R+66.7 2012: R+60.5 2008: R+55.4
Not yet ingested
- Civics
- —
Market trends
- HPI YoY
- ▲ 5.19%
- Current HPI
- 358.2137
- Rent YoY
- —
- Metro
- —
- State GDP YoY
- ▲ 1.81%
- F500 in state
- 4
Industry mix (Fortune 500 HQ in KY)
| Industry | F500 HQs | Revenue |
|---|---|---|
| Healthcare | 1 | $118B |
|
||
| Food / Beverage | 1 | $7B |
|
||
Price history
+126.2% since first listed2 events — show timeline
- 2026-05-14 Listed $95,000 ImagineMLS
- 2018-04-27 Sold (Public Records) $42,000 Public Records
Property tax history
+0.9%/yrLatest (2025): $304 · -2.3% YoY. Source: county tax records.
Cash-flow waterfall
monthlySold comps — $/sqft
last 12 mo · ≤1 miLoading sold comps…