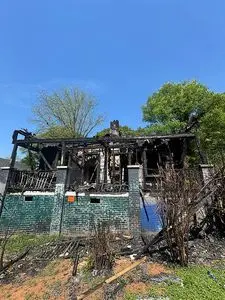
302 McGarity St · Dunean, SC
Flood risk 1/10 · Minimal
- FEMA flood zone
- X (unshaded)
- Chance of flooding over 30 yrs
- 0.0%
- Est. flood insurance / yr
- $507 – $1,088
Fire risk 1/10 · Minimal
- Est. fire insurance / yr
- $783 – $1,453
Heat risk 6/10 · Moderate
- Hot days now (above 102°F)
- 7 days/yr
- Hot days in 30 yrs
- 17 days/yr
Wind risk 2/10 · Minimal
- Chance of severe wind over 30 yrs
- 1.0%
Air-quality risk 4/10 · Minor
- Unhealthy air days now
- 4 days/yr
- Unhealthy air days in 30 yrs
- 4 days/yr
Risk factors via First Street. Map © Google.
Why this score? — see what drove the B+ grade
The composite is a weighted blend of 9 inputs, each scored 0–100. Each bar is that input's sub-score; the figure is the points it added to the 100-point composite (weight × sub-score).
- Cash flow +30.0/30.0
- ARV discount +15.0/15.0
- DSCR +10.0/10.0
- 1% rule +8.2/10.0
- Schools +4.2/10.0
- Livability +4.0/5.0
- Rent growth +3.4/5.0
- Condition / age +2.5/5.0
- Appreciation +0.0/10.0
$150,000
🖨 Deal sheet 📄 Offer letter ✓ Due diligence
Listing remarks
Property sold AS IS
Key facts
- Built 1945
- Listed 37 days
Neighborhood map
What this means for you Summary
Snapshot
- This is a 3-bed/1.0-bath single-family listed at $150k.
Deal economics
- At list price, monthly cash flow is $612 ($7k/yr) — positive.
- The deal already cash-flows at list — no discount required.
- Meets the 1% rule at list price ($2k rent vs $150k).
- Recommended offer: $146k (3.0% below list) — sets the bar for market timing.
- Cap rate 11.2% vs local median 4.0% in Dunean — top-decile yield for the area; either an underpriced asset or a hidden risk that comps aren't pricing in. Stress-test before assuming the spread holds.
Location & tenants
- Location reads 79/100 on livability (#14 in SC, #2,248 nationally) — a middle-class / working-renter tenant base. Strengths: commute A+, cost of living A+, housing A+; Watch: amenities C-, schools F, employment F.
- Greenville 01 (suburban): math 44% / reading 54% proficiency, ranked #10 of 80 in SC (top 12%) — families likely to look elsewhere, expect single-tenant / working-renter base with shorter leases.
- Market conditions: Rents rising (+3.7%/yr); 398 active listings in the ZIP; 33 comparable units currently listed for rent nearby; rentals leasing fast (median 3d on market — plan ~1-2 weeks tenant-placement turnaround); 5,595 units permitted in Greenville County in 2024 (566 in 5+ unit buildings).
- This rent runs 36% of the median local income ($66k/yr) — at the standard rent-burdened threshold; future hikes will face affordability resistance.
Forward outlook
- Local home prices are declining (-3.0%/yr); year-one equity from $1k of loan paydown is wiped out by about $4k of value loss. Plan a longer hold.
- Greenville County population projected at +34% by 2050 — long-run rental-demand tailwind backs the buy-and-hold thesis.
- At projected returns (-3.0% appreciation + 3.7% rent growth), your $42k cash investment doubles in ~7 years — after that, you're playing with house money.
Negotiation context
- It's been on market 37 days — a 3% lower offer ($146k) is reasonable based on typical stale-listing flexibility.
Risks & watch-outs
- Watch-outs: built in 1945 — expect roof / HVAC / electrical / plumbing capex.
- Climate carrying-cost: extreme-heat days projected 7→17/yr by 2055 (HVAC capex compounding) — expect insurance premiums to compound above CPI over the hold.
Questions for the listing agent
- It's been on market 37 days. Have you received any prior offers? Is the seller open to a 3% concession, seller financing, or rate buy-down credit?
- Built in 1945 — when were the roof, HVAC, electrical panel, plumbing, and water heater last replaced?
- Is there a deadline driving the sale (1031 exchange, divorce, estate, relocation)? That informs how much negotiation room exists.
- Schools are F-rated, which usually means shorter tenancies and higher turnover. Who's the typical renter profile here, and what's been the actual vacancy rate?
- What's the average days-on-market for RENTAL listings here right now (not sales)? A rising rental-DOM trend means longer vacancies and softer asking-rent achievability than the comps imply.
- What's the recent tenant-quality profile in this submarket — average credit score on applications, eviction rate, late-payment / NSF rate, and stable-employment percentage? A property-management company in the area should have these aggregated.
- How much new for-sale + rental construction is in the pipeline within 1–3 miles? Heavy new supply typically softens prices + rents 12–24 months out; constrained supply supports both.
Investment metrics
- 1% rule
- 1.32% ✓
- Cap rate
- 11.19%
- Cash-on-cash
- 17.48%
- DSCR
- 1.78
- GRM
- 6.3
CMA / ARV
- ARV (on-the-fly)
- $282,162
- Comps found
- 12
Show comp detail 12 sales within ~0.75 mi
| Address | Dist | Beds/Ba | Sqft | Sold | Price | $/sf | Match |
|---|---|---|---|---|---|---|---|
| 12 Wrigley St | 0.16mi | 2/1.0 (-1) | 1,113 (-3%) | 7mo | $153,500 | $138 | 77 |
| 16 Blake St | 0.34mi | 2/1.0 (-1) | 1,141 (-0%) | 13mo | $275,000 | $241 | 67 |
| 305 S Calhoun St | 0.59mi | 3/2.0 | 1,143 (-0%) | 1mo | $371,250 | $325 | 67 |
| 170 Otis St | 0.37mi | 2/1.0 (-1) | 1,100 (-4%) | 11mo | $250,000 | $227 | 61 |
| 206 Mcgarity St | 0.11mi | 2/2.0 (-1) | 1,253 (+9%) | 11mo | $410,000 | $327 | 61 |
| 6 Guess St | 0.35mi | 3/2.0 | 1,269 (+11%) | 2mo | $355,000 | $280 | 60 |
| 503 Anderson St | 0.52mi | 3/1.5 | 1,150 (+0%) | 17mo | $249,000 | $217 | 60 |
| 2 Round Knob St | 0.44mi | 3/1.0 | 1,022 (-11%) | 7mo | $195,000 | $191 | 55 |
| 6 Goodrich St | 0.50mi | 2/1.0 (-1) | 1,055 (-8%) | 4mo | $101,000 | $96 | 55 |
| 204 Blackwood St | 0.53mi | 3/2.0 | 1,300 (+13%) | 2mo | $321,990 | $248 | 48 |
| 303 Maloy St | 0.43mi | 3/2.0 | 1,319 (+15%) | 8mo | $375,000 | $284 | 44 |
| 18 7th St | 0.69mi | 3/2.0 | 1,299 (+13%) | 18mo | $320,000 | $246 | 27 |
Match score weights: distance 35% · size 25% · config 20% · recency 20%. Top-matched comps best support the ARV.
Projected returns pro-forma
-3.0% appreciation · 3.72% rent growth · sell at horizon
- IRR
- 9.7%
- Equity multiple
- 1.38×
- Total profit
- $16,101
- Equity at exit
- $22,365
- IRR
- 19.3%
- Equity multiple
- 2.67×
- Total profit
- $70,169
- Equity at exit
- $12,969
Cash invested: $42,000 (down + closing). Projections, not guarantees.
Landlord ↔ Tenant lean methodology
- Overall (STATE)
- 90 Strongly Landlord-Friendly
- State South Carolina
- 90 Strongly Landlord-Friendly · R+6
- County
- — inherits STATE
- City
- — inherits STATE
ZIP-level market 29605
- Rents YoY
- 3.7%
- Active inventory
- 398
- Price-to-rent
- 6.3×
Monthly cashflow live
- Estimated rent
- $1,987 high interval (Pro) →
- Mortgage (P&I)
- −$787
- Tax from tax record
- −$109 /mo · $1,303/yr
- Insurance
- −$62
- HOA
- −$0
- Vacancy / Maint / Mgmt
- −$417
- Net cashflow
- $612
Break-even live
UW: 25.0% down · 7.5% · 30yr · 1.5% tax · 5.0% vac · 8.0% maint · 8.0% mgmt
Financing live
Cash to close
- Down payment
- $37,500
- Closing costs
- $4,500
- Reserves months
- —
- Total cash needed
- —
Loan-product check · same deal, 3 products live
Conventional
25% down · 7.5% · 30yr
- Down + closing
- —
- Monthly P&I
- —
- Monthly cashflow
- —
- DSCR
- —
- Eligible?
- —
Personal DTI + credit; lowest rate.
DSCR
20% down · 8.5% · 30yr
- Down + closing
- —
- Monthly P&I
- —
- Monthly cashflow
- —
- DSCR
- —
- Eligible?
- —
No personal income docs; deal must DSCR.
Hard money
10% down · 12.0% · 12mo
- Down + closing
- —
- Monthly P&I
- —
- Monthly cashflow
- —
- DSCR
- —
- Eligible?
- —
Short-term bridge; refi at stabilization.
Rent comps 33 comps
| Address | Beds | Baths | Sqft | Rent | $/sqft | DOM | Units | Dist |
|---|---|---|---|---|---|---|---|---|
| 298 Werts St Greenville, SC | 2.0 | 2.0 | 1110 | $2,000 | $1.80 | 23d | 1 | 0.04mi |
| 806 Green Ave Greenville, SC | 3.0 | 1.0–2.0 | 1053 | $2,300 | $2.18 | 23d | 1 | 0.28mi |
| 401 Wilkins St Unit B Greenville, SC | 2.0 | 2.5 | 1350 | $2,050 | $1.52 | 3d | 1 | 0.34mi |
| 102 Odessa St Greenville, SC | 2.0 | 2.0 | 1192 | $1,900 | $1.59 | 2d | 1 | 0.42mi |
| 4 Averill St Greenville, SC | 2.0 | 1.0 | 728 | $1,400 | $1.92 | 23d | 1 | 0.50mi |
| 412 Green Ave Greenville, SC | 2.0 | 1.0 | 980 | $3,000 | $3.06 | 14d | 1 | 0.62mi |
| 10 10th St Greenville, SC | 2.0 | 1.0 | 1152 | $1,100 | $0.95 | 3d | 1 | 0.63mi |
| 8 Judson Rd Greenville, SC | 2.0 | 1.0 | 944 | $1,200 | $1.27 | 23d | 1 | 0.69mi |
| 7 Hamilton Ave Unit 1 Greenville, SC | 3.0 | 3.0 | 1400 | $3,999 | $2.86 | 23d | 1 | 0.72mi |
| 119 Heatherly Dr Greenville, SC | 2.0 | 1.0 | 896 | $950 | $1.06 | 23d | 1 | 0.73mi |
| 68 Allen St Greenville, SC | 2.0 | 1.0 | 1156 | $1,245 | $1.08 | 11d | 1 | 0.74mi |
| 29 4th St Greenville, SC | 3.0 | 2.0 | 1120 | $1,695 | $1.51 | 3d | 1 | 0.78mi |
| 701 Easley Bridge Rd Greenville, SC | 3.0 | 1.0–2.5 | 1324 | $3,465 | $2.62 | 2d | 110 | 0.84mi |
| 366 Field St Greenville, SC | 2.0 | 1.0–2.0 | 926 | $4,698 | $5.07 | 2d | 9 | 0.90mi |
| 1108 S Main St Greenville, SC | 3.0 | 1.0–2.0 | 1060 | $3,453 | $3.26 | 3d | 25 | 0.95mi |
| 44 4th Ave Greenville, SC | 3.0 | 2.0 | 1350 | $1,975 | $1.46 | 23d | 1 | 0.95mi |
| 4 Kilgore St Greenville, SC | 2.0 | 1.0 | 1050 | $1,500 | $1.43 | 23d | 1 | 0.98mi |
| 823 S Church St Greenville, SC | 2.0 | 1.0–2.0 | 792 | $1,801 | $2.27 | 2d | 12 | 1.09mi |
| 41 Burdette St #1 Greenville, SC | 3.0 | 2.0 | 1148 | $1,500 | $1.31 | 23d | 1 | 1.16mi |
| 125 Ledbetter St Unit B Greenville, SC | 3.0 | 2.0 | 1270 | $1,850 | $1.46 | 3d | 1 | 1.17mi |
| 104 Wardlaw St Greenville, SC | 3.0 | 1.0–2.0 | 1126 | $4,471 | $3.97 | 3d | 42 | 1.18mi |
| 3 Wentworth St Greenville, SC | 3.0 | 2.0 | 1218 | $1,700 | $1.40 | 11d | 1 | 1.22mi |
| 25 River St Greenville, SC | 2.0 | 1.0–2.0 | 842 | $3,066 | $3.64 | 3d | 10 | 1.23mi |
| 109 Virginia Ave Greenville, SC | 2.0 | 2.5 | 1134 | $1,699 | $1.50 | 23d | 1 | 1.24mi |
| 107 Virginia Ave Greenville, SC | 2.0 | 2.5 | 1134 | $1,699 | $1.50 | 23d | 1 | 1.24mi |
| 304 N Leach St Greenville, SC | 2.0 | 1.0 | 756 | $1,250 | $1.65 | 23d | 1 | 1.25mi |
| 317 Douthit St Greenville, SC | 2.0 | 1.0 | 825 | $1,095 | $1.33 | 3d | 1 | 1.30mi |
| 605 University Rdg Greenville, SC | 2.0 | 1.0 | 1000 | $1,500 | $1.50 | 2d | 1 | 1.32mi |
| 19 Saco St Greenville, SC | 2.0 | 2.0 | 1050 | $2,400 | $2.29 | 23d | 1 | 1.33mi |
| 1 Craven St Unit 8 Greenville, SC | 2.0 | 1.0 | 850 | $1,350 | $1.59 | 3d | 1 | 1.42mi |
| 7 Kathryan Ct Greenville, SC | 3.0 | 1.0 | 1274 | $1,800 | $1.41 | 3d | 1 | 1.44mi |
| 101 Reedy View Dr Greenville, SC | 2.0 | 1.0–2.0 | 862 | $3,577 | $4.15 | 2d | 31 | 1.45mi |
| 320 Falls St Greenville, SC | 2.0 | 1.0–2.0 | 939 | $5,703 | $6.07 | 3d | 13 | 1.45mi |
Listing history 15 events
-
2026-06-18days on market $150,000 Active 37 DOM
-
2026-06-17days on market $150,000 Active 36 DOM
-
2026-06-16days on market $150,000 Active 35 DOM
-
2026-06-15days on market $150,000 Active 34 DOM
-
2026-06-13days on market $150,000 Active 32 DOM
-
2026-06-13days on market $150,000 Active 31 DOM
-
2026-06-10days on market $150,000 Active 29 DOM
-
2026-06-09days on market $150,000 Active 28 DOM
-
2026-06-08days on market $150,000 Active 27 DOM
-
2026-06-07days on market $150,000 Active 26 DOM
-
2026-06-03days on market $150,000 Active 22 DOM
-
2026-06-03days on market $150,000 Active 21 DOM
-
2026-06-01days on market $150,000 Active 20 DOM
-
2026-05-31days on market $150,000 Active 19 DOM
-
2026-05-12$150,000 Active
ⓘ Source: listings_history table (triggers on properties + properties_extension) + one-shot
backfill from property_details.listing_events for pre-trigger history.
Tax reassessment forecast SC · Resets to sale price
- Current annual tax
- $1,303 · $109/mo
- Projected year-2 tax
- $1,303 · $109/mo
- Expected delta
- $0/yr ($0/mo · 0.0%)
ⓘ Screening estimate from a state-policy table — verify with the county assessor before closing.
Climate risk First Street
- Flood 1/10 Low FEMA zone X (unshaded) · 0% chance over 30 yrs
- Wildfire 1/10 Low
- Heat 6/10 Major 7 d/yr ≥102°F today · 17 d/yr by 30 yrs out
- Wind 2/10 Low 100% chance of damaging wind over 30 yrs
- Air quality 4/10 Moderate 4 unhealthy d/yr today · 4 by 30 yrs out
Nearby sold comps map
Loading sold comps map…
Walkable amenities ~0.75 mi
Loading nearby amenities…
Taxation est. · year 1
- Rental income
- $23,843
- − Mortgage interest
- −$8,402
- − Property taxes
- −$1,303
- − Insurance
- −$750
- − Repairs & maintenance
- −$1,907
- − Management
- −$1,907
- − Depreciation
- −$4,364
- Taxable income
- $5,209
- Est. tax owed @ 24.0%
- −$1,250
- After-tax cash flow
- $6,093/yr
For passive investors: Depreciation is non-cash, so a rental often shows a tax loss while cash-flowing — sheltering income. Rental losses are passive: they offset passive income freely, and up to $25,000/yr can offset ordinary (W-2) income if you actively participate and your MAGI is under $100k (phasing out to $0 by $150k); unused losses carry forward. On sale, claimed depreciation is recaptured at up to 25%, and gains may owe capital-gains tax (a 1031 exchange can defer both). Figures are a year-1 estimate at your 24.0% rate — not tax advice; consult a CPA.
Schools (NCES district)
- District
- Greenville 01
- NCES district ID
- 4502310
- Math proficiency
- 44% ▼ -10.00%
- Reading proficiency
- 54% ▼ -2.00%
- Median HH income
- $49,596
- Composite
- 41.88/100
- National rank
- #3370
- State rank
- #10 of 80 in SC
Livability — Dunean
- Score
- 79/100
- State rank
- #14
- US rank
- #2248
Category grades
Schools grade is shown separately in the Schools card above.
Census & demographics
- Census place
- Dunean, SC
- County
- Greenville County · 573,815 people
- Metro
- Greenville-Anderson, SC
- Population (ZIP)
- 40,717
- Household income
- $65,648
- Rent vs Own
- Severe rent burden
- 978.0
Population outlook (Greenville County) Hauer SSP2
- Today (2025)
- 574,580 people
- By 2030
- 615,615 · +7.1%
- By 2040
- 695,373 · +21.0%
- By 2050
- 769,367 · +33.9%
- By 2075
- 933,296 · +62.4%
- By 2100
- 1,029,196 · +79.1%
Race, ethnicity, and origin ACS 2023
- Neighborhood character
- Diverse neighborhood (Simpson 0.66)
- Race & ethnicity
- White 45% Black 32% Hispanic / Latino 17% Two or more races 8%
- Hispanic origin (detail)
- Mexican 11%
- Common ancestry
- Slovak 3% Serbian 2% Italian 2%
- Foreign-born
- 9% · Canada, Jamaica
- Languages at home
- 85% English-only · Spanish 13% Other Indo-European 1%
Political lean MEDSL · Greenville
- 2024 margin
- Strong R (+22.2) · D 38.0% · R 60.2% · Other 1.8%
- 2008→2024 swing
- +1.7pp toward D · 2008: -23.9pp · 2024: -22.2pp
- All cycles
- 2024: R+22.2 2020: R+18.2 2016: R+24.7 2012: R+27.8 2008: R+23.9
Not yet ingested
- Civics
- —
Market trends
- HPI YoY
- ▼ -591.71%
- Current HPI
- 231.6906
- Rent YoY
- ▲ 3.72%
- Metro
- Greenville-Anderson, SC
- State GDP YoY
- ▲ 4.51%
- F500 in state
- 2
Industry mix (Fortune 500 HQ in SC)
| Industry | F500 HQs | Revenue |
|---|---|---|
| Packaging | 1 | $7B |
|
||
Price history
1 event — show timeline
- 2026-05-12 Listed $150,000 FSBO.com
Property tax history
+15.8%/yrLatest (2025): $1,303 · +2.9% YoY. Source: county tax records.
Cash-flow waterfall
monthlySold comps — $/sqft
last 12 mo · ≤1 miLoading sold comps…