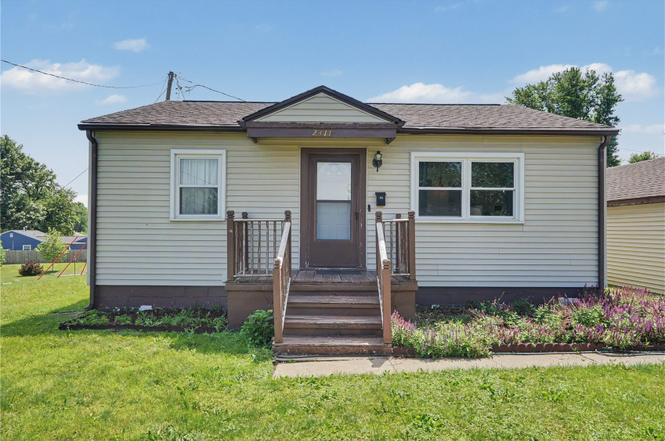
2411 Linwood St SW · Cedar Rapids, IA
Flood risk 1/10 · Minimal
- FEMA flood zone
- X (unshaded)
- Chance of flooding over 30 yrs
- 0.0%
- Est. flood insurance / yr
- $473 – $860
Fire risk 1/10 · Minimal
- Est. fire insurance / yr
- $902 – $1,676
Heat risk 3/10 · Minor
- Hot days now (above 103°F)
- 7 days/yr
- Hot days in 30 yrs
- 15 days/yr
Wind risk 2/10 · Minimal
- Chance of severe wind over 30 yrs
- —
Air-quality risk 2/10 · Minimal
- Unhealthy air days now
- 0 days/yr
- Unhealthy air days in 30 yrs
- 1 days/yr
Risk factors via First Street. Map © Google.
Why this score? — see what drove the D+ grade
The composite is a weighted blend of 9 inputs, each scored 0–100. Each bar is that input's sub-score; the figure is the points it added to the 100-point composite (weight × sub-score).
- ARV discount +12.2/15.0
- Cash flow +12.1/30.0
- Rent growth +4.7/5.0
- Schools +4.7/10.0
- Livability +3.9/5.0
- DSCR +3.6/10.0
- 1% rule +3.5/10.0
- Condition / age +2.5/5.0
- Appreciation +0.0/10.0
$155,000
🖨 Deal sheet (PDF) 📄 Offer letter ✓ Due diligence
Listing remarks MLS
Move-in ready home in a great location! Easy access to I-380. You will be welcomed by the spacious living room with refinished hardwood floors. Large, updated kitchen with newer white cabinets, countertops & flooring. Enjoy the spacious screened-in porch. 2 main level bedrooms with ceiling fans & a full, updated bath completes the main level. Finished lower level rec room which is hard to find in this price range! Lower level laundry area & shower. 1 stall detached garage.
Key facts
- 3-seasons porch
- Movie room
- Finished basement
Tags
Property features AI
Exterior
- Parking: Detached garage with garage door opener; Off-street parking; 1 garage space
- Utilities: Public water; Public sewer
- Home design: Single-family residence; Residential property
- Construction: Frame construction; Vinyl siding
- Exterior features: Pets allowed
Interior
- Kitchen: Range; Range hood; Dishwasher; Refrigerator; Gas water heater
- Bedrooms: 4 total rooms (bedroom count not specified)
- Bathrooms: 1 full bathroom; 1 half bathroom
- Heating & cooling: Forced air heating; Central air conditioning
- Interior features: Eat-in kitchen; Full basement
- Laundry & utility: Washer; Dryer
Neighborhood map
What this means for you Summary
Snapshot
- This is a 2-bed/1.0-bath single-family listed at $155k.
Deal economics
- At list price, monthly cash flow is $-34 ($-413/yr) — negative.
- To cash-flow at today's rent, offer at most $149k (3.9% below list).
- To meet the 1% rule (rent ≥ 1% of price), the offer needs to be $132k (14.8% below list).
- Recommended offer: $132k (14.8% below list) — sets the bar for 1% rule.
- Cap rate 6.0% vs local median 3.5% in Cedar Rapids — top-decile yield for the area; either an underpriced asset or a hidden risk that comps aren't pricing in. Stress-test before assuming the spread holds.
Location & tenants
- Location reads 78/100 on livability (#134 in IA, #2,474 nationally) — a middle-class / working-renter tenant base. Strengths: cost of living A+, housing A+, health & safety A+; Watch: crime C-, commute F.
- Cedar Rapids Community School District (urban): math 50% / reading 59% proficiency, ranked #265 of 289 in IA (top 92%) — acceptable for families but not a draw, mixed tenant base, ~2y average lease.
- Zoned schools: Grant Elementary School (math 37% / reading 32%, grade F, #595 of 616 statewide, top 97%, 320 students, 72% FRL); Wilson Middle School (math 42% / reading 49%, grade D+, #231 of 246 statewide, top 94%, 395 students, 72% FRL); Thomas Jefferson High School (math 41% / reading 62%, grade D+, #307 of 336 statewide, top 91%, 1,543 students, 56% FRL) — zoned schools average 67% FRL vs 43% district-wide (24 pts higher); higher-poverty schools than district average — tighter screening recommended.
- Market conditions: Rents rising fast (+8.8%/yr); 419 active listings in the ZIP; 1 comparable units currently listed for rent nearby; 1,023 units permitted in Linn County in 2024 (456 in 5+ unit buildings).
Forward outlook
- Local home prices are declining (-3.0%/yr); year-one equity from $1k of loan paydown is wiped out by about $5k of value loss. Plan a longer hold.
- Linn County population projected at +16% by 2050 — long-run rental-demand tailwind backs the buy-and-hold thesis.
Negotiation context
- Only 1 days on market — expect competitive offers; lowballing is unlikely to land.
- 4 sale attempts since 10y ago with the ask held roughly flat each time — persistent listings suggest the price (not the market) is what's stuck; bring a comps-based counter.
- Current owner paid $105k; 48% above their basis — modest negotiation headroom, anchor on the comps not their cost.
Risks & watch-outs
- Watch-outs: built in 1952 — expect roof / HVAC / electrical / plumbing capex.
Questions for the listing agent
- What do current leases actually rent for vs. the listed asking? Can we see a recent rent roll and the last 12 months of T-12 income?
- Built in 1952 — when were the roof, HVAC, electrical panel, plumbing, and water heater last replaced?
- Is there a deadline driving the sale (1031 exchange, divorce, estate, relocation)? That informs how much negotiation room exists.
- Schools are B-rated — typically a magnet for longer-tenancy family renters. What's the average tenant stay here, and is there a school-zone premium baked into asking?
- The area grade is low — what's the realistic commute time and amenity access for the typical tenant pool here? Any planned neighborhood developments (good or bad) we should know about?
- What's the average days-on-market for RENTAL listings here right now (not sales)? A rising rental-DOM trend means longer vacancies and softer asking-rent achievability than the comps imply.
- What's the recent tenant-quality profile in this submarket — average credit score on applications, eviction rate, late-payment / NSF rate, and stable-employment percentage? A property-management company in the area should have these aggregated.
- How much new for-sale + rental construction is in the pipeline within 1–3 miles? Heavy new supply typically softens prices + rents 12–24 months out; constrained supply supports both.
Investment metrics
- 1% rule
- 0.85% ✗
- Cap rate
- 6.03%
- Cash-on-cash
- -0.95%
- DSCR
- 0.96
- GRM
- 9.8
CMA / ARV
- ARV (on-the-fly)
- $173,197
- Comps found
- 12
Show comp detail 12 sales within ~0.75 mi
| Address | Dist | Beds/Ba | Sqft | Sold | Price | $/sf | Match |
|---|---|---|---|---|---|---|---|
| 648 SW 22nd Ave | 0.20mi | 3/1.0 (+1) | 1,092 (-5%) | 0mo | $170,000 | $156 | 78 |
| 2504 Linwood St SW | 0.11mi | 3/1.0 (+1) | 1,041 (-9%) | 1mo | $185,000 | $178 | 74 |
| 807 21st Ave Ave SW | 0.27mi | 3/1.0 (+1) | 1,131 (-1%) | 9mo | $170,475 | $151 | 73 |
| 2525 SW Linwood St | 0.13mi | 3/1.0 (+1) | 1,086 (-5%) | 9mo | $190,000 | $175 | 72 |
| 1906 K St St SW | 0.47mi | 3/2.0 (+1) | 1,145 (-0%) | 2mo | $63,000 | $55 | 67 |
| 2417 Illinois St SW | 0.04mi | 3/1.0 (+1) | 976 (-15%) | 6mo | $168,000 | $172 | 63 |
| 826 21st Ave SW | 0.31mi | 3/1.0 (+1) | 1,276 (+11%) | 5mo | $143,000 | $112 | 57 |
| 205 26th Ave SW | 0.59mi | 2/1.5 | 1,298 (+13%) | 0mo | $190,000 | $146 | 48 |
| 186 22nd Ave Ave SW | 0.68mi | 3/1.5 (+1) | 1,063 (-7%) | 4mo | $182,000 | $171 | 46 |
| 1804 I St SW | 0.62mi | 3/2.0 (+1) | 1,223 (+7%) | 7mo | $155,000 | $127 | 45 |
| 1316 M St SW | 0.67mi | 3/1.5 (+1) | 1,236 (+8%) | 8mo | $68,000 | $55 | 42 |
| 1255 20th Ave SW | 0.66mi | 2/1.0 | 986 (-14%) | 7mo | $48,000 | $49 | 40 |
Match score weights: distance 35% · size 25% · config 20% · recency 20%. Top-matched comps best support the ARV.
Projected returns pro-forma
-3.0% appreciation · 8.0% rent growth · sell at horizon
- IRR
- -12.4%
- Equity multiple
- 0.53×
- Total profit
- $-20,301
- Equity at exit
- $23,111
- IRR
- 3.0%
- Equity multiple
- 1.26×
- Total profit
- $11,377
- Equity at exit
- $13,402
Cash invested: $43,400 (down + closing). Projections, not guarantees.
Landlord ↔ Tenant lean methodology
- Overall (STATE)
- 83 Strongly Landlord-Friendly
- State Iowa
- 83 Strongly Landlord-Friendly · R+6
- County
- — inherits STATE
- City
- — inherits STATE
ZIP-level market 52404
- Rents YoY
- 8.8%
- Active inventory
- 419
- Price-to-rent
- 9.8×
Monthly cashflow live
- Estimated rent
- $1,321 medium interval (Pro) →
- Mortgage (P&I)
- −$813
- Tax from tax record
- −$201 /mo · $2,408/yr
- Insurance
- −$65
- HOA
- −$0
- Vacancy / Maint / Mgmt
- −$277
- Net cashflow
- $-34
Break-even live
Sensitivity live
| Price | -10% $53 | -5% $9 | +0% $-34 | +5% $-78 | +10% $-122 |
|---|---|---|---|---|---|
| Rent | -10% $-139 | -5% $-87 | +0% $-34 | +5% $18 | +10% $70 |
| Rate | -1.0pp $44 | -0.5pp $5 | base $-34 | +0.5pp $-75 | +1.0pp $-115 |
UW: 25.0% down · 7.5% · 30yr · 1.5% tax · 5.0% vac · 8.0% maint · 8.0% mgmt
Financing live
Cash to close
- Down payment
- $38,750
- Closing costs
- $4,650
- Reserves months
- —
- Total cash needed
- —
Loan-product check · same deal, 3 products live
Conventional
25% down · 7.5% · 30yr
- Down + closing
- —
- Monthly P&I
- —
- Monthly cashflow
- —
- DSCR
- —
- Eligible?
- —
Personal DTI + credit; lowest rate.
DSCR
20% down · 8.5% · 30yr
- Down + closing
- —
- Monthly P&I
- —
- Monthly cashflow
- —
- DSCR
- —
- Eligible?
- —
No personal income docs; deal must DSCR.
Hard money
10% down · 12.0% · 12mo
- Down + closing
- —
- Monthly P&I
- —
- Monthly cashflow
- —
- DSCR
- —
- Eligible?
- —
Short-term bridge; refi at stabilization.
Rent comps 1 comps
| Address | Beds | Baths | Sqft | Rent | $/sqft | DOM | Units | Dist |
|---|---|---|---|---|---|---|---|---|
| 206 3rd Ave SW Cedar Rapids, IA | 1.0 | 1.5 | 1400 | $1,495 | $1.07 | 15d | 1 | 1.34mi |
Listing history 2 events
-
2026-06-13remarks 695-char remark
-
2026-06-13$155,000 Pending 1 DOM
ⓘ Source: listings_history table (triggers on properties + properties_extension) + one-shot
backfill from property_details.listing_events for pre-trigger history.
Tax reassessment forecast IA · Partial reset (capped growth)
- Current annual tax
- $2,408 · $201/mo
- Projected year-2 tax
- $2,421 · $202/mo
- Expected delta
- +$13/yr (+$1/mo · 0.5%)
ⓘ Screening estimate from a state-policy table — verify with the county assessor before closing.
Climate risk First Street
- Flood 1/10 Low FEMA zone X (unshaded) · 0% chance over 30 yrs
- Wildfire 1/10 Low
- Heat 3/10 Moderate 7 d/yr ≥103°F today · 15 d/yr by 30 yrs out
- Wind 2/10 Low
- Air quality 2/10 Low 0 unhealthy d/yr today · 1 by 30 yrs out
Nearby sold comps map
Loading sold comps map…
Walkable amenities ~0.75 mi
Loading nearby amenities…
Taxation est. · year 1
- Rental income
- $15,854
- − Mortgage interest
- −$8,682
- − Property taxes
- −$2,408
- − Insurance
- −$775
- − Repairs & maintenance
- −$1,268
- − Management
- −$1,268
- − Depreciation
- −$4,509
- Taxable loss
- −$3,058
- Est. tax savings @ 24.0%
- +$734
- After-tax cash flow
- $321/yr
For passive investors: Depreciation is non-cash, so a rental often shows a tax loss while cash-flowing — sheltering income. Rental losses are passive: they offset passive income freely, and up to $25,000/yr can offset ordinary (W-2) income if you actively participate and your MAGI is under $100k (phasing out to $0 by $150k); unused losses carry forward. On sale, claimed depreciation is recaptured at up to 25%, and gains may owe capital-gains tax (a 1031 exchange can defer both). Figures are a year-1 estimate at your 24.0% rate — not tax advice; consult a CPA.
Schools (NCES district)
- District
- Cedar Rapids Community School District
- NCES district ID
- 1906540
- Math proficiency
- 50% ▼ -12.00%
- Reading proficiency
- 59% ▼ -6.00%
- Median HH income
- $53,568
- Composite
- 46.82/100
- National rank
- #2378
- State rank
- #265 of 289 in IA
Livability — Cedar Rapids
- Score
- 78/100
- State rank
- #134
- US rank
- #2474
Category grades
Schools grade is shown separately in the Schools card above.
Census & demographics
- Census place
- Cedar Rapids, IA
- County
- Linn County · 179,860 people
- City population
- 137,154
- Metro
- Cedar Rapids, IA
- Population (ZIP)
- 42,958
- Household income
- $61,870
- Rent vs Own
- Severe rent burden
- 1041.0
Population outlook (Linn County) Hauer SSP2
- Today (2025)
- 239,589 people
- By 2030
- 248,587 · +3.8%
- By 2040
- 264,817 · +10.5%
- By 2050
- 278,685 · +16.3%
- By 2075
- 311,754 · +30.1%
- By 2100
- 336,773 · +40.6%
Race, ethnicity, and origin ACS 2023
- Neighborhood character
- Predominantly White (74%)
- Race & ethnicity
- White 74% Black 10% Two or more races 10% Hispanic / Latino 7%
- Hispanic origin (detail)
- Mexican 5%
- Common ancestry
- Portuguese 3% Lithuanian 2% Romanian 2%
- Foreign-born
- 8% · Canada
- Languages at home
- 90% English-only · Spanish 3% French/Haitian/Cajun 2% Other Asian/Pacific 1%
Political lean MEDSL · Linn
- 2024 margin
- Lean D (+9.9) · D 54.2% · R 44.3% · Other 1.4%
- 2008→2024 swing
- -11.6pp toward R · 2008: 21.5pp · 2024: 9.9pp
- All cycles
- 2024: D+9.9 2020: D+13.7 2016: D+9.0 2012: D+17.6 2008: D+21.5
Not yet ingested
- Civics
- —
Market trends
- HPI YoY
- ▼ -154.96%
- Current HPI
- 241.81
- Rent YoY
- ▲ 8.79%
- Metro
- Cedar Rapids, IA
- State GDP YoY
- ▲ 2.48%
- F500 in state
- 4
Industry mix (Fortune 500 HQ in IA)
| Industry | F500 HQs | Revenue |
|---|---|---|
| Financial Services | 1 | $16B |
|
||
| Retail / Convenience | 1 | $15B |
|
||
Price history
+69.4% since first listed12 events — show timeline
- 2026-06-13 Pending — CRAAR, CDRMLS
- 2026-06-11 Listed $155,000 CRAAR, CDRMLS
- 2024-04-05 Price Changed $105,000 ICAARMLS
- 2019-08-29 Sold (Public Records) $105,000 Public Records
- 2019-08-28 Sold (MLS) $105,000 CRAAR, CDRMLS
- 2019-08-28 Sold (MLS) $105,000 ICAARMLS
- 2019-07-25 Price Changed $107,500 ICAARMLS
- 2019-07-11 Listed $107,500 CRAAR, CDRMLS
- 2019-07-11 Listed $107,500 ICAARMLS
- 2017-05-31 Sold (MLS) $100,000 CRAAR, CDRMLS
- 2016-09-29 Listed $100,000 CRAAR, CDRMLS
- 2005-09-30 Sold (Public Records) $91,500 Public Records
Property tax history
+2.9%/yrLatest (2025): $2,408 · +12.4% YoY. Source: county tax records.
Cash-flow waterfall
monthlySold comps — $/sqft
last 12 mo · ≤1 miLoading sold comps…