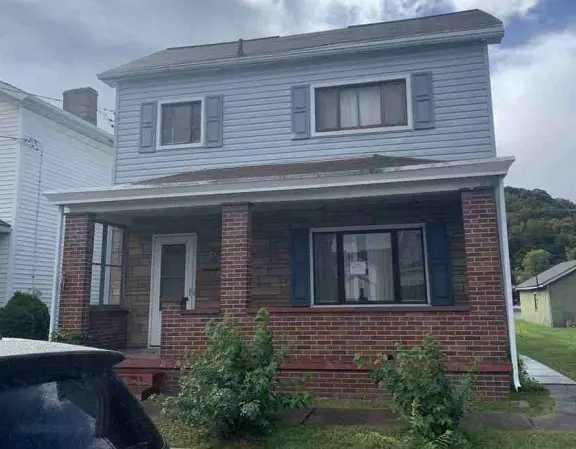
1540 Virginia Ave · Monaca, PA
Flood risk 6/10 · Moderate
- FEMA flood zone
- X (unshaded)
- Chance of flooding over 30 yrs
- 0.55%
- Est. flood insurance / yr
- $473 – $860
Fire risk 1/10 · Minimal
- Est. fire insurance / yr
- $511 – $949
Heat risk 4/10 · Minor
- Hot days now (above 97°F)
- 8 days/yr
- Hot days in 30 yrs
- 20 days/yr
Wind risk 2/10 · Minimal
- Chance of severe wind over 30 yrs
- —
Air-quality risk 3/10 · Minor
- Unhealthy air days now
- 2 days/yr
- Unhealthy air days in 30 yrs
- 4 days/yr
Risk factors via First Street. Map © Google.
Why this score? — see what drove the B grade
The composite is a weighted blend of 9 inputs, each scored 0–100. Each bar is that input's sub-score; the figure is the points it added to the 100-point composite (weight × sub-score).
- Cash flow +30.0/30.0
- 1% rule +10.0/10.0
- DSCR +10.0/10.0
- ARV discount +7.5/15.0
- Schools +5.0/10.0
- Livability +4.0/5.0
- Rent growth +2.5/5.0
- Condition / age +2.5/5.0
- Appreciation +0.0/10.0
$61,900
🖨 Deal sheet 📄 Offer letter ✓ Due diligence
Listing remarks MLS
Opportunity awaits in this two bedroom, one bath home with single detached garage. Take a drive by and see if this may be your next investment.
Key facts
- 3,484 sq ft lot
- Built 1900
- Listed 170 days
Neighborhood map
What this means for you Summary
Snapshot
- This is a 2-bed/1.0-bath single-family listed at $62k.
Deal economics
- At list price, monthly cash flow is $422 ($5k/yr) — positive.
- The deal already cash-flows at list — no discount required.
- Meets the 1% rule at list price ($1k rent vs $62k).
- Recommended offer: $54k (12.0% below list) — sets the bar for market timing.
Location & tenants
- Location reads 81/100 on livability (#182 in PA, #1,516 nationally) — a professional / high-income tenant draw. Strengths: crime A+, cost of living A+, housing A+; Watch: amenities F, employment D-.
- Market conditions: 78 active listings in the ZIP; 8 comparable units currently listed for rent nearby; rentals leasing fast (median 4d on market — plan ~1-2 weeks tenant-placement turnaround); 272 units permitted in Beaver County in 2024 (80 in 5+ unit buildings).
Forward outlook
- Local home prices are declining (-3.0%/yr); year-one equity from $428 of loan paydown is wiped out by about $2k of value loss. Plan a longer hold.
- Beaver County population projected at -14% by 2050 — secular population decline; favor cash flow + early exit over multi-decade hold.
- At projected returns (-3.0% appreciation + 3.0% rent growth), your $17k cash investment doubles in ~5 years — after that, you're playing with house money.
Negotiation context
- It's been on market 170 days — a 12% lower offer ($54k) is reasonable based on typical stale-listing flexibility.
- 2 sale attempts since 26y ago with the ask held roughly flat each time — persistent listings suggest the price (not the market) is what's stuck; bring a comps-based counter.
- Current owner paid $42k; 47% above their basis — modest negotiation headroom, anchor on the comps not their cost.
Risks & watch-outs
- Watch-outs: property tax is 3.8% of price; built in 1900 — expect roof / HVAC / electrical / plumbing capex.
- Climate carrying-cost: major flood risk — expect insurance premiums to compound above CPI over the hold.
Questions for the listing agent
- It's been on market 170 days. Have you received any prior offers? Is the seller open to a 12% concession, seller financing, or rate buy-down credit?
- Built in 1900 — when were the roof, HVAC, electrical panel, plumbing, and water heater last replaced?
- Property tax is high relative to price — has the assessment been appealed recently, and will the sale trigger a re-assessment?
- Why hasn't it sold? Are there any deal-killer items the seller is aware of (foundation, flood, title, zoning, code violations)?
- Is there a deadline driving the sale (1031 exchange, divorce, estate, relocation)? That informs how much negotiation room exists.
- Schools are B-rated — typically a magnet for longer-tenancy family renters. What's the average tenant stay here, and is there a school-zone premium baked into asking?
- What's the average days-on-market for RENTAL listings here right now (not sales)? A rising rental-DOM trend means longer vacancies and softer asking-rent achievability than the comps imply.
- What's the recent tenant-quality profile in this submarket — average credit score on applications, eviction rate, late-payment / NSF rate, and stable-employment percentage? A property-management company in the area should have these aggregated.
- How much new for-sale + rental construction is in the pipeline within 1–3 miles? Heavy new supply typically softens prices + rents 12–24 months out; constrained supply supports both.
Investment metrics
- 1% rule
- 1.98% ✓
- Cap rate
- 14.48%
- Cash-on-cash
- 29.23%
- DSCR
- 2.30
- GRM
- 4.2
CMA / ARV
- ARV (median comp)
- $153,163
- List price
- $61,900
- Delta
- -59.59%
- Verdict
- UNDERPRICED
- Comps
- 20 within 1.0 mi
Show comp detail 12 sales within ~0.75 mi
| Address | Dist | Beds/Ba | Sqft | Sold | Price | $/sf | Match |
|---|---|---|---|---|---|---|---|
| 1213 Virginia Ave | 0.24mi | 3/1.5 (+1) | 1,290 (-5%) | 3mo | $105,000 | $81 | 70 |
| 1224 Indiana Ave | 0.26mi | 3/2.0 (+1) | 1,320 (-3%) | 10mo | $190,000 | $144 | 65 |
| 1213 Indiana Ave | 0.29mi | 3/1.5 (+1) | 1,470 (+8%) | 4mo | $222,000 | $151 | 63 |
| 1201 Marshall Rd | 0.63mi | 3/1.0 (+1) | 1,372 (+1%) | 9mo | $165,000 | $120 | 57 |
| 1199 Marshall Rd | 0.64mi | 3/2.0 (+1) | 1,333 (-2%) | 2mo | $225,000 | $169 | 56 |
| 1536 Marshall Rd | 0.57mi | 3/1.0 (+1) | 1,280 (-6%) | 4mo | $65,000 | $51 | 54 |
| 2026 Marshall Rd | 0.70mi | 3/1.5 (+1) | 1,306 (-4%) | 2mo | $248,000 | $190 | 52 |
| 1146 Chestnut St | 0.62mi | 3/2.0 (+1) | 1,440 (+6%) | 2mo | $215,000 | $149 | 51 |
| 1215 Cascade Rd | 0.61mi | 3/2.0 (+1) | 1,316 (-4%) | 8mo | $225,000 | $171 | 50 |
| 600 Indiana Ave | 0.69mi | 3/2.5 (+1) | 1,288 (-6%) | 1mo | $190,000 | $148 | 47 |
| 1012 Blaine Rd | 0.70mi | 3/2.0 (+1) | 1,248 (-8%) | 2mo | $225,000 | $180 | 43 |
| 627 Wayne Ave | 0.69mi | 3/2.0 (+1) | 1,170 (-14%) | 2mo | $203,000 | $174 | 33 |
Match score weights: distance 35% · size 25% · config 20% · recency 20%. Top-matched comps best support the ARV.
Projected returns pro-forma
-3.0% appreciation · 3.0% rent growth · sell at horizon
- IRR
- 23.7%
- Equity multiple
- 1.98×
- Total profit
- $16,946
- Equity at exit
- $9,229
- IRR
- 31.7%
- Equity multiple
- 3.87×
- Total profit
- $49,745
- Equity at exit
- $5,352
Cash invested: $17,332 (down + closing). Projections, not guarantees.
Landlord ↔ Tenant lean methodology
- Overall (STATE)
- 62 Landlord-Friendly
- State Pennsylvania
- 62 Landlord-Friendly · EVEN
- County
- — inherits STATE
- City
- — inherits STATE
ZIP-level market 15061
- Home prices YoY
- -28.6%
- Active inventory
- 78
- Price-to-rent
- 4.2×
Monthly cashflow live
- Estimated rent
- $1,225 high interval (Pro) →
- Mortgage (P&I)
- −$325
- Tax from tax record
- −$195 /mo · $2,339/yr
- Insurance
- −$26
- HOA
- −$0
- Vacancy / Maint / Mgmt
- −$257
- Net cashflow
- $422
Break-even live
UW: 25.0% down · 7.5% · 30yr · 1.5% tax · 5.0% vac · 8.0% maint · 8.0% mgmt
Financing live
Cash to close
- Down payment
- $15,475
- Closing costs
- $1,857
- Reserves months
- —
- Total cash needed
- —
Loan-product check · same deal, 3 products live
Conventional
25% down · 7.5% · 30yr
- Down + closing
- —
- Monthly P&I
- —
- Monthly cashflow
- —
- DSCR
- —
- Eligible?
- —
Personal DTI + credit; lowest rate.
DSCR
20% down · 8.5% · 30yr
- Down + closing
- —
- Monthly P&I
- —
- Monthly cashflow
- —
- DSCR
- —
- Eligible?
- —
No personal income docs; deal must DSCR.
Hard money
10% down · 12.0% · 12mo
- Down + closing
- —
- Monthly P&I
- —
- Monthly cashflow
- —
- DSCR
- —
- Eligible?
- —
Short-term bridge; refi at stabilization.
Rent comps 8 comps
| Address | Beds | Baths | Sqft | Rent | $/sqft | DOM | Units | Dist |
|---|---|---|---|---|---|---|---|---|
| 1003 Locust Dr Monaca, PA | 3.0 | 2.5 | 1320 | $1,650 | $1.25 | 14d | 1 | 0.83mi |
| 635 3rd Ave Freedom, PA | 2.0 | 1.0 | 1050 | $950 | $0.90 | 1d | 1 | 0.88mi |
| 2014 Birch Rd Monaca, PA | 3.0 | 2.5 | 1192 | $1,825 | $1.53 | 1d | 1 | 0.96mi |
| 243 Pennsylvania Ave Unit 1 Rochester, PA | 2.0 | 1.0 | 1000 | $1,100 | $1.10 | 14d | 1 | 1.10mi |
| 526 Adams St Unit 2 Rochester, PA | 3.0 | 1.0 | 1000 | $850 | $0.85 | 44d | 1 | 1.22mi |
| 230 W Madison St Unit 6 Rochester, PA | 2.0 | 1.0 | 975 | $1,100 | $1.13 | 1d | 1 | 1.30mi |
| 467 Reno St Rochester, PA | 3.0 | 1.0 | 1092 | $1,200 | $1.10 | 1d | 1 | 1.33mi |
| 1401 4th Ave #1 Freedom, PA | 2.0 | 1.0 | 955 | $850 | $0.89 | 3d | 1 | 1.34mi |
Listing history 18 events
-
2026-06-18days on market $61,900 Active 170 DOM
-
2026-06-17days on market $61,900 Active 169 DOM
-
2026-06-16days on market $61,900 Active 168 DOM
-
2026-06-15days on market $61,900 Active 167 DOM
-
2026-06-13days on market $61,900 Active 165 DOM
-
2026-06-13days on market $61,900 Active 164 DOM
-
2026-06-09days on market $61,900 Active 161 DOM
-
2026-06-08days on market $61,900 Active 160 DOM
-
2026-06-07days on market $61,900 Active 159 DOM
-
2026-06-03days on market $61,900 Active 155 DOM
-
2026-06-02days on market $61,900 Active 154 DOM
-
2026-06-01days on market $61,900 Active 153 DOM
-
2026-05-31days on market $61,900 Active 152 DOM
-
2025-12-30$61,900 Active 143-char remark
Show marketing remark (143 chars)
Opportunity awaits in this two bedroom, one bath home with single detached garage. Take a drive by and see if this may be your next investment.
-
2000-08-08soldstatus $42,000 74-char remark
Show marketing remark (74 chars)
HUD SOLD AS-IS GET INFO SUB BID AT WWW. FIRSTPRESTON. COM CASE#-442-183384
-
2000-06-22soldstatus $42,000
-
2000-05-11$42,000 74-char remark
Show marketing remark (74 chars)
HUD SOLD AS-IS GET INFO SUB BID AT WWW. FIRSTPRESTON. COM CASE#-442-183384
-
1996-10-09soldstatus $63,000
ⓘ Source: listings_history table (triggers on properties + properties_extension) + one-shot
backfill from property_details.listing_events for pre-trigger history.
Tax reassessment forecast PA · Partial reset (capped growth)
- Current annual tax
- $2,339 · $195/mo
- Projected year-2 tax
- $2,339 · $195/mo
- Expected delta
- $0/yr ($0/mo · 0.0%)
ⓘ Screening estimate from a state-policy table — verify with the county assessor before closing.
Climate risk First Street
- Flood 6/10 Major FEMA zone X (unshaded) · 55% chance over 30 yrs
- Wildfire 1/10 Low
- Heat 4/10 Moderate 8 d/yr ≥97°F today · 20 d/yr by 30 yrs out
- Wind 2/10 Low
- Air quality 3/10 Moderate 2 unhealthy d/yr today · 4 by 30 yrs out
Nearby sold comps map
Loading sold comps map…
Walkable amenities ~0.75 mi
Loading nearby amenities…
Taxation est. · year 1
- Rental income
- $14,696
- − Mortgage interest
- −$3,467
- − Property taxes
- −$2,339
- − Insurance
- −$310
- − Repairs & maintenance
- −$1,176
- − Management
- −$1,176
- − Depreciation
- −$1,801
- Taxable income
- $4,428
- Est. tax owed @ 24.0%
- −$1,063
- After-tax cash flow
- $4,003/yr
For passive investors: Depreciation is non-cash, so a rental often shows a tax loss while cash-flowing — sheltering income. Rental losses are passive: they offset passive income freely, and up to $25,000/yr can offset ordinary (W-2) income if you actively participate and your MAGI is under $100k (phasing out to $0 by $150k); unused losses carry forward. On sale, claimed depreciation is recaptured at up to 25%, and gains may owe capital-gains tax (a 1031 exchange can defer both). Figures are a year-1 estimate at your 24.0% rate — not tax advice; consult a CPA.
Schools (NCES district)
No district data.
Livability — Monaca
- Score
- 81/100
- State rank
- #182
- US rank
- #1516
Category grades
Schools grade is shown separately in the Schools card above.
Census & demographics
- Census place
- Monaca, PA
- County
- Beaver County · 116,001 people
- City population
- 12,413
- Metro
- Pittsburgh, PA
- Population (ZIP)
- 12,413
- Household income
- $73,010
- Rent vs Own
- Severe rent burden
- 123.0
Population outlook (Beaver County) Hauer SSP2
- Today (2025)
- 164,976 people
- By 2030
- 161,449 · -2.1%
- By 2040
- 151,752 · -8.0%
- By 2050
- 141,155 · -14.4%
- By 2075
- 118,142 · -28.4%
- By 2100
- 91,740 · -44.4%
Race, ethnicity, and origin ACS 2023
- Neighborhood character
- Predominantly White (88%)
- Race & ethnicity
- White 88% Two or more races 5% Black 5% Hispanic / Latino 3%
- Common ancestry
- Romanian 6% Serbian 3% Slovak 1%
- Foreign-born
- 2% · Canada
- Languages at home
- 97% English-only · Spanish 1%
Political lean MEDSL · Beaver
- 2024 margin
- Strong R (+20.7) · D 39.2% · R 59.9%
- 2008→2024 swing
- -17.9pp toward R · 2008: -2.8pp · 2024: -20.7pp
- All cycles
- 2024: R+20.7 2020: R+17.7 2016: R+20.1 2012: R+6.6 2008: R+2.8
Not yet ingested
- Civics
- —
Market trends
- HPI YoY
- ▼ -93.11%
- Current HPI
- 232.6703
- Rent YoY
- —
- Metro
- Pittsburgh, PA
- State GDP YoY
- ▲ 1.68%
- F500 in state
- 34
Industry mix (Fortune 500 HQ in PA)
| Industry | F500 HQs | Revenue |
|---|---|---|
| Healthcare | 2 | $309B |
|
||
| Insurance | 2 | $27B |
|
||
| Telecommunications / Media | 1 | $124B |
|
||
| Industrial Distribution | 1 | $22B |
|
||
| Financial Services | 1 | $20B |
|
||
| Chemicals / Materials | 1 | $18B |
|
||
Price history
-1.7% since first listed5 events — show timeline
- 2025-12-30 Listed $61,900 West Penn MLS
- 2000-08-08 Sold (MLS) $42,000 West Penn MLS
- 2000-06-22 Sold (Public Records) $42,000 Public Records
- 2000-05-11 Listed $42,000 West Penn MLS
- 1996-10-09 Sold (Public Records) $63,000 Public Records
Property tax history
+3.4%/yrLatest (2026): $2,339 · +4.3% YoY. Source: county tax records.
Cash-flow waterfall
monthlySold comps — $/sqft
last 12 mo · ≤1 miLoading sold comps…