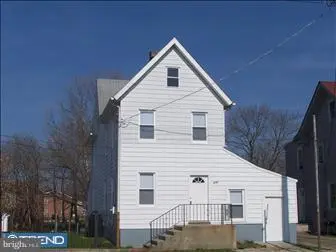
376 E Broadway · Salem, NJ
Flood risk 6/10 · Moderate
- FEMA flood zone
- X (shaded)
- Chance of flooding over 30 yrs
- 0.57%
- Est. flood insurance / yr
- $507 – $1,088
Fire risk 3/10 · Minor
- Est. fire insurance / yr
- $526 – $976
Heat risk 8/10 · Major
- Hot days now (above 102°F)
- 7 days/yr
- Hot days in 30 yrs
- 15 days/yr
Wind risk 6/10 · Moderate
- Chance of severe wind over 30 yrs
- 27.0%
Air-quality risk 3/10 · Minor
- Unhealthy air days now
- 2 days/yr
- Unhealthy air days in 30 yrs
- 4 days/yr
Risk factors via First Street. Map © Google.
Why this score? — see what drove the C+ grade
The composite is a weighted blend of 9 inputs, each scored 0–100. Each bar is that input's sub-score; the figure is the points it added to the 100-point composite (weight × sub-score).
- Cash flow +23.3/30.0
- ARV discount +12.4/15.0
- DSCR +7.5/10.0
- 1% rule +7.2/10.0
- Appreciation +4.8/10.0
- Livability +3.1/5.0
- Rent growth +2.5/5.0
- Condition / age +2.5/5.0
- Schools +1.2/10.0
$175,000
🖨 Deal sheet 📄 Offer letter ✓ Due diligence
Listing remarks MLS
OFFERING CLOSING COSTS! Beautifully renovated home with an additional attached suite that can be used for multiple purposes, such as a studio efficiency, home business, apartment, or an in-law suite. Since the attached suite has an exterior entrance, the studio efficiency could be used to generate extra income to use as an investment opportunity. The studio efficiency also contains a full bathroom, kitchen, and laundry area along with electric baseboard heat. The entire home has been completely renovated with new carpeting, new windows, and 200 amp service! The spacious layout of home along with the vaulted ceilings make for a great living space. The entire attic has been floored and can be easily finished off as EXTRA room or extra storage space. Come and make you appointment today to view this completely renovated home!
Key facts
- 6,482 sq ft lot
- 2 parking spots
- Built 1900
Property features AI
Finance
- Financial info: Ownership is fee simple; Month-to-month existing lease type
Exterior
- Parking: Driveway parking (2 spaces); Total of 2 garage and parking spaces
- Utilities: Public water; Public sewer; Electric hot water
- Home design: Detached structure; Above-grade finished area reported (Assessor)
- Construction: Frame construction; Brick/mortar and concrete perimeter foundation; Above-grade and below-grade structures noted
- Exterior features: Lot dimensions approximately 27 x 240; Ground rent paid annually; Tidal water: none
Interior
- Bedrooms: One three-bedroom unit; One single-room unit
- Heating & cooling: Baseboard electric heating; Window air conditioning units (electric)
- Interior features: Accessible features include 32"+ wide doors
Neighborhood map
What this means for you Summary
Snapshot
- This is a 3-bed/?-bath single-family listed at $175k.
Deal economics
- At list price, monthly cash flow is $321 ($4k/yr) — positive.
- The deal already cash-flows at list — no discount required.
- Meets the 1% rule at list price ($2k rent vs $175k).
Location & tenants
- Location reads 61/100 on livability (#462 in NJ) — a middle-class / working-renter tenant base. Strengths: cost of living A+, health & safety A+, crime B; Watch: schools D, amenities F, commute F.
- Salem City School District (town): math 6% / reading 24% proficiency, ranked #464 of 472 in NJ (top 98%) — low school quality limits family demand, transient renter base, plan for 1-2y turnover; 85% free/reduced lunch — lower-income household profile, screen leases tightly.
- Market conditions: 100 active listings in the ZIP; 4 comparable units currently listed for rent nearby; rentals leasing fast (median 6d on market — plan ~1-2 weeks tenant-placement turnaround); 95 units permitted in Salem County in 2024 (0 in 5+ unit buildings).
- At $2,138/mo this rent would consume 47% of the median local household income ($55k/yr) (locally 663% of renters already pay >50% of income on rent) — very limited rent-growth headroom before tenants either downsize or default.
Forward outlook
- In year one you build about $545 of equity ($1k loan paydown + $-665 appreciation (-0.4% local appreciation)).
- Salem County population projected at -23% by 2050 — secular population decline; favor cash flow + early exit over multi-decade hold.
- At projected returns (-0.4% appreciation + 3.0% rent growth), your $49k cash investment doubles in ~8 years — after that, you're playing with house money.
Negotiation context
- Only 7 days on market — expect competitive offers; lowballing is unlikely to land.
- 5 sale attempts since 20y ago; this cycle's ask has dropped $25k (12%) from the opening price — seller is motivated, your offer sets the floor, not the list.
- Current owner paid $118k; 49% above their basis — modest negotiation headroom, anchor on the comps not their cost.
Risks & watch-outs
- Watch-outs: property tax is 2.6% of price; built in 1900 — expect roof / HVAC / electrical / plumbing capex.
- Climate carrying-cost: major flood risk; major wind risk, 27% chance of damaging wind over 30y; extreme-heat days projected 7→15/yr by 2055 (HVAC capex compounding) — expect insurance premiums to compound above CPI over the hold.
Questions for the listing agent
- Built in 1900 — when were the roof, HVAC, electrical panel, plumbing, and water heater last replaced?
- Property tax is high relative to price — has the assessment been appealed recently, and will the sale trigger a re-assessment?
- Is there a deadline driving the sale (1031 exchange, divorce, estate, relocation)? That informs how much negotiation room exists.
- Schools are D-rated, which usually means shorter tenancies and higher turnover. Who's the typical renter profile here, and what's been the actual vacancy rate?
- What's the average days-on-market for RENTAL listings here right now (not sales)? A rising rental-DOM trend means longer vacancies and softer asking-rent achievability than the comps imply.
- What's the recent tenant-quality profile in this submarket — average credit score on applications, eviction rate, late-payment / NSF rate, and stable-employment percentage? A property-management company in the area should have these aggregated.
- How much new for-sale + rental construction is in the pipeline within 1–3 miles? Heavy new supply typically softens prices + rents 12–24 months out; constrained supply supports both.
Investment metrics
- 1% rule
- 1.22% ✓
- Cap rate
- 8.49%
- Cash-on-cash
- 7.86%
- DSCR
- 1.35
- GRM
- 6.8
CMA / ARV
- ARV (on-the-fly)
- $196,231
- Comps found
- 12
Show comp detail 12 sales within ~0.75 mi
| Address | Dist | Beds/Ba | Sqft | Sold | Price | $/sf | Match |
|---|---|---|---|---|---|---|---|
| 26 Olive St | 0.22mi | 4/1.0 (+1) | 2,164 (+7%) | 3mo | $200,000 | $92 | 70 |
| 334 Craven Ave | 0.21mi | 4/1.5 (+1) | 1,843 (-9%) | 2mo | $245,000 | $133 | 69 |
| 69 Walnut St | 0.44mi | 3/1.5 | 1,942 (-4%) | 12mo | $239,000 | $123 | 62 |
| 187 7th St | 0.51mi | 4/2.0 (+1) | 1,929 (-5%) | 3mo | $67,000 | $35 | 61 |
| 320 Fenwick Ave | 0.31mi | 4/2.0 (+1) | 1,958 (-3%) | 18mo | $190,000 | $97 | 60 |
| 175 9th St | 0.42mi | 3/1.0 | 1,776 (-12%) | 3mo | $195,000 | $110 | 58 |
| 216 N Union St | 0.16mi | 4/2.0 (+1) | 1,798 (-11%) | 16mo | $265,000 | $147 | 56 |
| 266 E Broadway | 0.36mi | 3/2.0 | 1,865 (-8%) | 20mo | $88,000 | $47 | 54 |
| 6 Walnut St | 0.48mi | 4/2.0 (+1) | 1,764 (-13%) | 2mo | $70,000 | $40 | 50 |
| 35 Walnut St | 0.46mi | 4/1.5 (+1) | 2,278 (+13%) | 9mo | $180,000 | $79 | 45 |
| 171 Yorke St | 0.72mi | 4/1.5 (+1) | 2,177 (+8%) | 5mo | $260,000 | $119 | 44 |
| 56 New Market St | 0.50mi | 4/1.5 (+1) | 2,240 (+11%) | 15mo | $50,000 | $22 | 41 |
Match score weights: distance 35% · size 25% · config 20% · recency 20%. Top-matched comps best support the ARV.
Projected returns pro-forma
-0.38% appreciation · 3.0% rent growth · sell at horizon
- IRR
- 5.4%
- Equity multiple
- 1.25×
- Total profit
- $12,342
- Equity at exit
- $47,513
- IRR
- 11.1%
- Equity multiple
- 2.17×
- Total profit
- $57,100
- Equity at exit
- $54,541
Cash invested: $49,000 (down + closing). Projections, not guarantees.
Landlord ↔ Tenant lean methodology
- Overall (STATE)
- 21 Tenant-Leaning
- State New Jersey
- 21 Tenant-Leaning · D+6
- County
- — inherits STATE
- City
- — inherits STATE
ZIP-level market 08079
- Home prices YoY
- -0.1%
- Active inventory
- 100
- Price-to-rent
- 6.8×
Monthly cashflow live
- Estimated rent
- $2,138 medium interval (Pro) →
- Mortgage (P&I)
- −$918
- Tax from tax record
- −$377 /mo · $4,530/yr
- Insurance
- −$73
- HOA
- −$0
- Vacancy / Maint / Mgmt
- −$449
- Net cashflow
- $321
Break-even live
UW: 25.0% down · 7.5% · 30yr · 1.5% tax · 5.0% vac · 8.0% maint · 8.0% mgmt
Financing live
Cash to close
- Down payment
- $43,750
- Closing costs
- $5,250
- Reserves months
- —
- Total cash needed
- —
Loan-product check · same deal, 3 products live
Conventional
25% down · 7.5% · 30yr
- Down + closing
- —
- Monthly P&I
- —
- Monthly cashflow
- —
- DSCR
- —
- Eligible?
- —
Personal DTI + credit; lowest rate.
DSCR
20% down · 8.5% · 30yr
- Down + closing
- —
- Monthly P&I
- —
- Monthly cashflow
- —
- DSCR
- —
- Eligible?
- —
No personal income docs; deal must DSCR.
Hard money
10% down · 12.0% · 12mo
- Down + closing
- —
- Monthly P&I
- —
- Monthly cashflow
- —
- DSCR
- —
- Eligible?
- —
Short-term bridge; refi at stabilization.
Rent comps 4 comps
| Address | Beds | Baths | Sqft | Rent | $/sqft | DOM | Units | Dist |
|---|---|---|---|---|---|---|---|---|
| 332 E Broadway Salem, NJ | 3.0 | 2.0 | 1844 | $1,980 | $1.07 | 44d | 1 | 0.14mi |
| 190 7th St Unit 1 Salem, NJ | 2.0 | 1.0 | 2720 | $1,450 | $0.53 | 1d | 1 | 0.48mi |
| 190 7th St Unit 2 Salem, NJ | 2.0 | 1.0 | 2720 | $1,400 | $0.51 | 1d | 1 | 0.48mi |
| 270-272 Grant St Salem, NJ | 4.0 | 1.0 | 1644 | $2,100 | $1.28 | 5d | 1 | 0.52mi |
Listing history 8 events
-
2026-06-18days on market $175,000 Active 7 DOM
-
2026-06-17days on market $175,000 Active 6 DOM
-
2026-06-16days on market $175,000 Active 5 DOM
-
2026-06-15days on market $175,000 Active 4 DOM
-
2026-06-13days on market $175,000 Active 2 DOM
-
2026-06-13status $175,000 Active 1 DOM
-
2026-06-10remarks 221-char remark
-
2026-06-10$175,000 Coming Soon 1 DOM
ⓘ Source: listings_history table (triggers on properties + properties_extension) + one-shot
backfill from property_details.listing_events for pre-trigger history.
Tax reassessment forecast NJ · Partial reset (capped growth)
- Current annual tax
- $4,530 · $377/mo
- Projected year-2 tax
- $4,530 · $377/mo
- Expected delta
- $0/yr ($0/mo · 0.0%)
ⓘ Screening estimate from a state-policy table — verify with the county assessor before closing.
Climate risk First Street
- Flood 6/10 Major FEMA zone X (shaded) · 57% chance over 30 yrs
- Wildfire 3/10 Moderate
- Heat 8/10 Severe 7 d/yr ≥102°F today · 15 d/yr by 30 yrs out
- Wind 6/10 Major 27% chance of damaging wind over 30 yrs
- Air quality 3/10 Moderate 2 unhealthy d/yr today · 4 by 30 yrs out
Nearby sold comps map
Loading sold comps map…
Walkable amenities ~0.75 mi
Loading nearby amenities…
Taxation est. · year 1
- Rental income
- $25,655
- − Mortgage interest
- −$9,803
- − Property taxes
- −$4,530
- − Insurance
- −$875
- − Repairs & maintenance
- −$2,052
- − Management
- −$2,052
- − Depreciation
- −$5,091
- Taxable income
- $1,252
- Est. tax owed @ 24.0%
- −$300
- After-tax cash flow
- $3,550/yr
For passive investors: Depreciation is non-cash, so a rental often shows a tax loss while cash-flowing — sheltering income. Rental losses are passive: they offset passive income freely, and up to $25,000/yr can offset ordinary (W-2) income if you actively participate and your MAGI is under $100k (phasing out to $0 by $150k); unused losses carry forward. On sale, claimed depreciation is recaptured at up to 25%, and gains may owe capital-gains tax (a 1031 exchange can defer both). Figures are a year-1 estimate at your 24.0% rate — not tax advice; consult a CPA.
Schools (NCES district)
- District
- Salem City School District
- NCES district ID
- 3414550
- Math proficiency
- 6% ▼ -1.00%
- Reading proficiency
- 24% ▲ 2.00%
- Median HH income
- $27,118
- Composite
- 11.51/100
- National rank
- #9702
- State rank
- #464 of 472 in NJ
Livability — Salem
- Score
- 61/100
- State rank
- #462
- US rank
- #17533
Category grades
Schools grade is shown separately in the Schools card above.
Census & demographics
- Census place
- Salem, NJ
- County
- Salem County · 24,175 people
- City population
- 10,762
- Metro
- Philadelphia-Camden-Wilmington, PA-NJ-DE-MD
- Population (ZIP)
- 10,762
- Household income
- $54,641
- Rent vs Own
- Severe rent burden
- 663.0
Population outlook (Salem County) Hauer SSP2
- Today (2025)
- 59,905 people
- By 2030
- 57,351 · -4.3%
- By 2040
- 51,837 · -13.5%
- By 2050
- 46,356 · -22.6%
- By 2075
- 36,452 · -39.2%
- By 2100
- 28,907 · -51.7%
Race, ethnicity, and origin ACS 2023
- Neighborhood character
- Diverse neighborhood (Simpson 0.55)
- Race & ethnicity
- White 59% Black 31% Hispanic / Latino 6% Two or more races 5% Asian 1%
- Hispanic origin (detail)
- Puerto Rican 5%
- Common ancestry
- Romanian 3% Lithuanian 2% Italian 1%
- Foreign-born
- 2% · Canada
- Languages at home
- 94% English-only · Spanish 4% Tagalog/Filipino 1%
Political lean MEDSL · Salem
- 2024 margin
- R (+19.2) · D 39.6% · R 58.8% · Other 1.6%
- 2008→2024 swing
- -23.1pp toward R · 2008: 3.9pp · 2024: -19.2pp
- All cycles
- 2024: R+19.2 2020: R+12.8 2016: R+15.4 2012: D+0.8 2008: D+3.9
Not yet ingested
- Civics
- —
Market trends
- HPI YoY
- ▼ -0.38%
- Current HPI
- 258.0047
- Rent YoY
- —
- Metro
- Philadelphia-Camden-Wilmington, PA-NJ-DE-MD
- State GDP YoY
- ▲ 2.05%
- F500 in state
- 34
Industry mix (Fortune 500 HQ in NJ)
| Industry | F500 HQs | Revenue |
|---|---|---|
| Consumer Goods | 3 | $31B |
|
||
| Pharmaceuticals | 2 | $153B |
|
||
| Technology | 2 | $21B |
|
||
| Insurance | 2 | $20B |
|
||
| Healthcare | 2 | $19B |
|
||
| Financial Services | 1 | $70B |
|
||
Price history
+695.5% since first listed15 events — show timeline
- 2026-06-09 Coming Soon $175,000 BRIGHT MLS
- 2025-01-02 Listing Removed — BRIGHT MLS
- 2024-11-09 Relisted — BRIGHT MLS
- 2024-11-02 Listing Removed — BRIGHT MLS
- 2024-08-02 Listed $199,999 BRIGHT MLS
- 2007-07-19 Sold (Public Records) $117,500 Public Records
- 2007-07-12 Sold (MLS) $117,500 BRIGHT MLS
- 2007-06-06 Listing Removed — BRIGHT MLS
- 2007-06-04 Listing Removed — BRIGHT MLS
- 2007-04-03 Listed $124,900 BRIGHT MLS
- 2007-04-03 Listed $117,500 BRIGHT MLS
- 2007-02-08 Listing Removed — BRIGHT MLS
- 2006-11-06 Listed $124,000 BRIGHT MLS
- 1998-04-17 Sold (Public Records) $30,000 Public Records
- 1991-06-27 Sold (Public Records) $22,000 Public Records
Property tax history
+2.6%/yrLatest (2025): $4,530 · +4.9% YoY. Source: county tax records.
Cash-flow waterfall
monthlySold comps — $/sqft
last 12 mo · ≤1 miLoading sold comps…