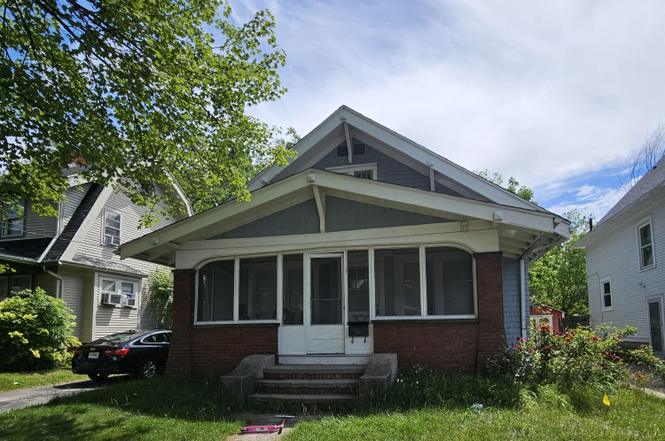
3826 Drexel Dr · Toledo, OH
Flood risk 1/10 · Minimal
- FEMA flood zone
- X (unshaded)
- Chance of flooding over 30 yrs
- 0.0%
- Est. flood insurance / yr
- $473 – $860
Fire risk 1/10 · Minimal
- Est. fire insurance / yr
- $713 – $1,323
Heat risk 3/10 · Minor
- Hot days now (above 101°F)
- 7 days/yr
- Hot days in 30 yrs
- 16 days/yr
Wind risk 2/10 · Minimal
- Chance of severe wind over 30 yrs
- —
Air-quality risk 2/10 · Minimal
- Unhealthy air days now
- 1 days/yr
- Unhealthy air days in 30 yrs
- 3 days/yr
Risk factors via First Street. Map © Google.
Why this score? — see what drove the B grade
The composite is a weighted blend of 9 inputs, each scored 0–100. Each bar is that input's sub-score; the figure is the points it added to the 100-point composite (weight × sub-score).
- Cash flow +30.0/30.0
- ARV discount +15.0/15.0
- DSCR +10.0/10.0
- 1% rule +8.6/10.0
- Rent growth +4.0/5.0
- Livability +3.3/5.0
- Condition / age +2.5/5.0
- Schools +1.6/10.0
- Appreciation +0.0/10.0
$119,000
🖨 Deal sheet 📄 Offer letter ✓ Due diligence
Listing remarks MLS
SPACIOUS WEST SIDE 4 BED/1.5 BATH WITH HUGE ROOMS & UPDATED FLOORS. FRESH PAINT. 1ST FLOOR MASTER WITH WALK-IN CLOSET. FULL BASEMENT WITH 1/2 BATH. MAIN WATER LINE RECENTLY REPLACED WITH 20 YEAR GUARANTEE.
Key facts
- 5,900 sq ft lot
- 2 garage spots
- Built 1917
Property features AI
Finance
- HOA & community: Curbs; Sidewalks
Exterior
- Parking: 2-car garage; Concrete driveway; On-street parking
- Utilities: Electricity connected; Natural gas connected; Public water; Public sewer
- Home design: Single-family residence; Two levels; No attached units; No common walls
- Construction: Brick and wood siding construction; Combination foundation; Built in 2026
- Exterior features: Deck; Enclosed porch; Shingle roof
Interior
- Kitchen: Gas range; Refrigerator
- Bedrooms: Bedroom on main level; Bedroom on main level; Bedrooms on upper level
- Flooring: Carpet; Hardwood; Tile; Vinyl
- Bathrooms: 1 full bathroom
- Heating & cooling: Forced air heating (natural gas); Window air conditioning units
- Interior features: Double vanity; Dual closets; Storage
- Laundry & utility: Washer; Dryer; Laundry located in basement
Neighborhood map
What this means for you Summary
Snapshot
- This is a 5-bed/1.0-bath single-family listed at $119k.
Deal economics
- At list price, monthly cash flow is $486 ($6k/yr) — positive.
- The deal already cash-flows at list — no discount required.
- Meets the 1% rule at list price ($2k rent vs $119k).
- Cap rate 11.2% vs local median 7.6% in Toledo — top-decile yield for the area; either an underpriced asset or a hidden risk that comps aren't pricing in. Stress-test before assuming the spread holds.
Location & tenants
- Location reads 66/100 on livability (#645 in OH) — a middle-class / working-renter tenant base. Strengths: cost of living A+, housing A+, health & safety A+; Watch: amenities C-, crime F, commute F.
- Toledo City (urban): math 15% / reading 24% proficiency, ranked #634 of 656 in OH (top 97%) — low school quality limits family demand, transient renter base, plan for 1-2y turnover; 72% free/reduced lunch — lower-income household profile, screen leases tightly.
- Zoned schools: Whittier Elementary School (math 6% / reading 13%, grade F, #1,505 of 1,584 statewide, top 95%, 509 students, 0% FRL); Start High School (math 11% / reading 33%, grade F, #672 of 781 statewide, top 86%, 1,242 students, 50% FRL) — zoned schools average 25% FRL vs 72% district-wide (47 pts lower); this property's tenant base skews higher-income than the district average.
- Market conditions: Rents rising fast (+6.0%/yr); 92 active listings in the ZIP; 415 units permitted in Lucas County in 2024 (122 in 5+ unit buildings).
- This rent runs 38% of the median local income ($51k/yr) — at the standard rent-burdened threshold; future hikes will face affordability resistance.
Forward outlook
- Local home prices are declining (-3.0%/yr); year-one equity from $823 of loan paydown is wiped out by about $4k of value loss. Plan a longer hold.
- Lucas County population projected at -16% by 2050 — secular population decline; favor cash flow + early exit over multi-decade hold.
- At projected returns (-3.0% appreciation + 6.0% rent growth), your $33k cash investment doubles in ~6 years — after that, you're playing with house money.
Negotiation context
- Only 3 days on market — expect competitive offers; lowballing is unlikely to land.
- 9 sale attempts since 8y ago with the ask held roughly flat each time — persistent listings suggest the price (not the market) is what's stuck; bring a comps-based counter.
Risks & watch-outs
- Watch-outs: built in 1917 — expect roof / HVAC / electrical / plumbing capex.
Questions for the listing agent
- Built in 1917 — when were the roof, HVAC, electrical panel, plumbing, and water heater last replaced?
- Is there a deadline driving the sale (1031 exchange, divorce, estate, relocation)? That informs how much negotiation room exists.
- Schools are D-rated, which usually means shorter tenancies and higher turnover. Who's the typical renter profile here, and what's been the actual vacancy rate?
- Crime grade is F in this area — have there been break-ins, vandalism, or insurance claims at this property in the last 3 years? What carrier currently insures it and at what premium?
- What's the average days-on-market for RENTAL listings here right now (not sales)? A rising rental-DOM trend means longer vacancies and softer asking-rent achievability than the comps imply.
- What's the recent tenant-quality profile in this submarket — average credit score on applications, eviction rate, late-payment / NSF rate, and stable-employment percentage? A property-management company in the area should have these aggregated.
- How much new for-sale + rental construction is in the pipeline within 1–3 miles? Heavy new supply typically softens prices + rents 12–24 months out; constrained supply supports both.
Investment metrics
- 1% rule
- 1.36% ✓
- Cap rate
- 11.20%
- Cash-on-cash
- 17.52%
- DSCR
- 1.78
- GRM
- 6.1
CMA / ARV
- ARV (on-the-fly)
- $171,988
- Comps found
- 9
Show comp detail 9 sales within ~0.75 mi
| Address | Dist | Beds/Ba | Sqft | Sold | Price | $/sf | Match |
|---|---|---|---|---|---|---|---|
| 3909 Lockwood Ave | 0.14mi | 6/2.0 (+1) | 2,100 (-7%) | 20mo | $205,000 | $98 | 56 |
| 618 W Sylvania Ave | 0.52mi | 5/2.5 | 2,391 (+6%) | 12mo | $187,000 | $78 | 50 |
| 4202 N Haven Ave | 0.39mi | 5/1.0 | 1,959 (-13%) | 24mo | $92,000 | $47 | 39 |
| 4104 Willys Pkwy | 0.38mi | 4/1.5 (-1) | 1,960 (-13%) | 19mo | $180,000 | $92 | 37 |
| 4114 Vermaas Ave | 0.51mi | 4/2.0 (-1) | 1,930 (-15%) | 10mo | $74,500 | $39 | 34 |
| 4148 Carthage Rd | 0.47mi | 4/1.5 (-1) | 1,932 (-15%) | 18mo | $139,900 | $72 | 32 |
| 4030 Westway St | 0.53mi | 4/1.0 (-1) | 1,938 (-14%) | 21mo | $147,000 | $76 | 29 |
| 4510 Eastway St | 0.74mi | 4/3.0 (-1) | 1,940 (-14%) | 3mo | $170,000 | $88 | 26 |
| 4140 Burnham Ave | 0.59mi | 4/2.5 (-1) | 1,986 (-12%) | 22mo | $135,000 | $68 | 23 |
Match score weights: distance 35% · size 25% · config 20% · recency 20%. Top-matched comps best support the ARV.
Projected returns pro-forma
-3.0% appreciation · 6.01% rent growth · sell at horizon
- IRR
- 12.2%
- Equity multiple
- 1.50×
- Total profit
- $16,741
- Equity at exit
- $17,743
- IRR
- 23.4%
- Equity multiple
- 3.30×
- Total profit
- $76,491
- Equity at exit
- $10,289
Cash invested: $33,320 (down + closing). Projections, not guarantees.
Landlord ↔ Tenant lean methodology
- Overall (STATE)
- 73 Landlord-Friendly
- State Ohio
- 73 Landlord-Friendly · R+6
- County
- — inherits STATE
- City
- — inherits STATE
ZIP-level market 43612
- Home prices YoY
- -17.5%
- Rents YoY
- 6.0%
- Active inventory
- 92
- Price-to-rent
- 6.1×
Monthly cashflow live
- Estimated rent
- $1,616 medium interval (Pro) →
- Mortgage (P&I)
- −$624
- Tax from tax record
- −$116 /mo · $1,397/yr
- Insurance
- −$50
- HOA
- −$0
- Vacancy / Maint / Mgmt
- −$339
- Net cashflow
- $486
Break-even live
UW: 25.0% down · 7.5% · 30yr · 1.5% tax · 5.0% vac · 8.0% maint · 8.0% mgmt
Financing live
Cash to close
- Down payment
- $29,750
- Closing costs
- $3,570
- Reserves months
- —
- Total cash needed
- —
Loan-product check · same deal, 3 products live
Conventional
25% down · 7.5% · 30yr
- Down + closing
- —
- Monthly P&I
- —
- Monthly cashflow
- —
- DSCR
- —
- Eligible?
- —
Personal DTI + credit; lowest rate.
DSCR
20% down · 8.5% · 30yr
- Down + closing
- —
- Monthly P&I
- —
- Monthly cashflow
- —
- DSCR
- —
- Eligible?
- —
No personal income docs; deal must DSCR.
Hard money
10% down · 12.0% · 12mo
- Down + closing
- —
- Monthly P&I
- —
- Monthly cashflow
- —
- DSCR
- —
- Eligible?
- —
Short-term bridge; refi at stabilization.
Listing history 4 events
-
2026-06-18days on market $119,000 Active 3 DOM
-
2026-06-17days on market $119,000 Active 2 DOM
-
2026-06-15remarks 297-char remark
-
2026-06-15$119,000 Active 1 DOM
ⓘ Source: listings_history table (triggers on properties + properties_extension) + one-shot
backfill from property_details.listing_events for pre-trigger history.
Tax reassessment forecast OH · Partial reset (capped growth)
- Current annual tax
- $1,397 · $116/mo
- Projected year-2 tax
- $1,627 · $136/mo
- Expected delta
- +$230/yr (+$19/mo · 16.4%)
ⓘ Screening estimate from a state-policy table — verify with the county assessor before closing.
Climate risk First Street
- Flood 1/10 Low FEMA zone X (unshaded) · 0% chance over 30 yrs
- Wildfire 1/10 Low
- Heat 3/10 Moderate 7 d/yr ≥101°F today · 16 d/yr by 30 yrs out
- Wind 2/10 Low
- Air quality 2/10 Low 1 unhealthy d/yr today · 3 by 30 yrs out
Nearby sold comps map
Loading sold comps map…
Walkable amenities ~0.75 mi
Loading nearby amenities…
Taxation est. · year 1
- Rental income
- $19,389
- − Mortgage interest
- −$6,666
- − Property taxes
- −$1,397
- − Insurance
- −$595
- − Repairs & maintenance
- −$1,551
- − Management
- −$1,551
- − Depreciation
- −$3,462
- Taxable income
- $4,167
- Est. tax owed @ 24.0%
- −$1,000
- After-tax cash flow
- $4,837/yr
For passive investors: Depreciation is non-cash, so a rental often shows a tax loss while cash-flowing — sheltering income. Rental losses are passive: they offset passive income freely, and up to $25,000/yr can offset ordinary (W-2) income if you actively participate and your MAGI is under $100k (phasing out to $0 by $150k); unused losses carry forward. On sale, claimed depreciation is recaptured at up to 25%, and gains may owe capital-gains tax (a 1031 exchange can defer both). Figures are a year-1 estimate at your 24.0% rate — not tax advice; consult a CPA.
Schools (NCES district)
- District
- Toledo City
- NCES district ID
- 3904490
- Math proficiency
- 15% ▼ -16.00%
- Reading proficiency
- 24% ▼ -13.00%
- Median HH income
- $32,137
- Composite
- 15.76/100
- National rank
- #9276
- State rank
- #634 of 656 in OH
Livability — Toledo
- Score
- 66/100
- State rank
- #645
- US rank
- #11442
Category grades
Schools grade is shown separately in the Schools card above.
Census & demographics
- Census place
- Toledo, OH
- County
- Lucas County · 380,724 people
- City population
- 280,811
- Metro
- Toledo, OH
- Population (ZIP)
- 28,480
- Household income
- $50,728
- Rent vs Own
- Severe rent burden
- 1203.0
Population outlook (Lucas County) Hauer SSP2
- Today (2025)
- 420,751 people
- By 2030
- 410,187 · -2.5%
- By 2040
- 384,019 · -8.7%
- By 2050
- 355,125 · -15.6%
- By 2075
- 291,683 · -30.7%
- By 2100
- 233,670 · -44.5%
Race, ethnicity, and origin ACS 2023
- Neighborhood character
- Majority White (63%)
- Race & ethnicity
- White 63% Black 23% Two or more races 10% Hispanic / Latino 9%
- Hispanic origin (detail)
- Mexican 6% Puerto Rican 2%
- Common ancestry
- Romanian 9% Lithuanian 3% Italian 1%
- Foreign-born
- 2% · Canada
- Languages at home
- 96% English-only · Spanish 2% French/Haitian/Cajun 1%
Political lean MEDSL · Lucas
- 2024 margin
- D (+12.6) · D 55.8% · R 43.2%
- 2008→2024 swing
- -18.9pp toward R · 2008: 31.4pp · 2024: 12.6pp
- All cycles
- 2024: D+12.6 2020: D+16.8 2016: D+17.4 2012: D+30.4 2008: D+31.4
Not yet ingested
- Civics
- —
Market trends
- HPI YoY
- ▼ -50.05%
- Current HPI
- 235.5389
- Rent YoY
- ▲ 6.01%
- Metro
- Toledo, OH
- State GDP YoY
- ▲ 1.98%
- F500 in state
- 48
Industry mix (Fortune 500 HQ in OH)
| Industry | F500 HQs | Revenue |
|---|---|---|
| Insurance | 3 | $145B |
|
||
| Industrial Machinery | 3 | $49B |
|
||
| Financial Services | 3 | $24B |
|
||
| Consumer Goods | 2 | $93B |
|
||
| Aerospace / Defense | 2 | $47B |
|
||
| Utilities | 2 | $33B |
|
||
Price history
+213.2% since first listed26 events — show timeline
- 2026-06-15 Listed $119,000 NORIS
- 2025-10-14 Price Changed $108,000 NORIS
- 2025-10-14 Price Changed $35,000 NORIS
- 2022-10-25 Sold (Public Records) $189,000 Public Records
- 2022-03-02 Sold (Public Records) $108,000 Public Records
- 2022-02-28 Sold (MLS) $108,000 NORIS
- 2022-02-24 Pending — NORIS
- 2022-02-16 Contingent — NORIS
- 2022-02-01 Listed $109,900 NORIS
- 2021-11-04 Listing Removed — NORIS
- 2021-09-15 Price Changed $106,900 NORIS
- 2021-09-02 Relisted — NORIS
- 2021-08-10 Contingent — NORIS
- 2021-08-04 Listed $109,900 NORIS
- 2021-07-22 Listing Removed — NORIS
- 2021-07-08 Listed $125,000 NORIS
- 2021-04-30 Listing Removed — NORIS
- 2021-04-07 Listed $88,900 NORIS
- 2021-03-01 Listing Removed — NORIS
- 2021-02-01 Listed $81,000 NORIS
- 2021-01-30 Listing Removed — NORIS
- 2020-07-19 Listed $81,000 NORIS
- 2018-11-26 Sold (MLS) $35,000 NORIS
- 2018-07-12 Listed $42,500 NORIS
- 1992-11-05 Sold (Public Records) $51,250 Public Records
- 1979-04-27 Sold (Public Records) $38,000 Public Records
Property tax history
-1.1%/yrLatest (2025): $1,397 · +0.7% YoY. Source: county tax records.
Cash-flow waterfall
monthlySold comps — $/sqft
last 12 mo · ≤1 miLoading sold comps…