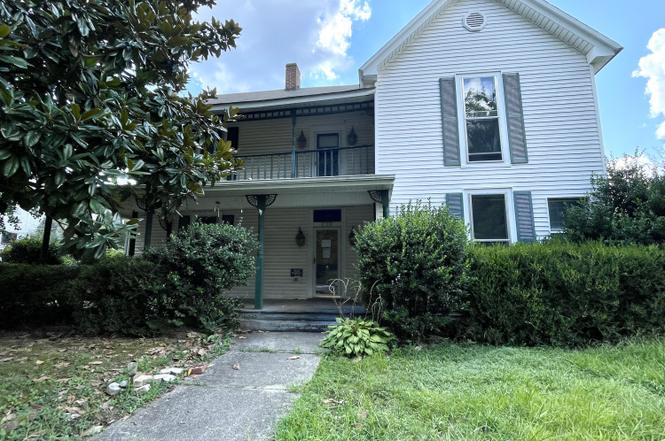
710 S Church St · Trenton, TN
Flood risk 1/10 · Minimal
- FEMA flood zone
- X (unshaded)
- Chance of flooding over 30 yrs
- 0.0%
- Est. flood insurance / yr
- $507 – $1,088
Fire risk 3/10 · Minor
- Est. fire insurance / yr
- $949 – $1,763
Heat risk 6/10 · Moderate
- Hot days now (above 108°F)
- 7 days/yr
- Hot days in 30 yrs
- 20 days/yr
Wind risk 4/10 · Minor
- Chance of severe wind over 30 yrs
- 12.0%
Air-quality risk 1/10 · Minimal
- Unhealthy air days now
- 0 days/yr
- Unhealthy air days in 30 yrs
- 0 days/yr
Risk factors via First Street. Map © Google.
Why this score? — see what drove the B- grade
The composite is a weighted blend of 9 inputs, each scored 0–100. Each bar is that input's sub-score; the figure is the points it added to the 100-point composite (weight × sub-score).
- Cash flow +30.0/30.0
- 1% rule +10.0/10.0
- DSCR +10.0/10.0
- ARV discount +7.5/15.0
- Livability +2.6/5.0
- Rent growth +2.5/5.0
- Condition / age +2.5/5.0
- Schools +2.0/10.0
- Appreciation +0.0/10.0
$69,700
🖨 Deal sheet 📄 Offer letter ✓ Due diligence
Listing remarks
Charming Historic Home on Church Street in Trenton, TN. Step back in time with this turn-of-the-century home built in 1900, located on Church Street. This home has lots of character and timeless details and is the restorer's dream waiting to be brought back to its original glory - Featuring high ceilings, some original hardwood floors & vintage light fixtures along with 2 stained glass windows. This home has 4 bedrooms and 2 baths, with primary bedroom being downstairs. The classic architectural details and endless potential make this property ideal for anyone who wants to be a part of Trenton's rich heritage. THE DRIVEWAY IS A SHARED DRIVEWAY WITH ADJOINING PROPERTY OWNER. Call Denic
Key facts
- High ceilings
- Historic home
- 0.24 acre lot
Tags
Property features AI
Finance
- Other: Lot dimensions approximately 80 x 130
Exterior
- Parking: 2 parking spaces; Shared driveway
- Utilities: Public water; Public sewer; 100 amp electric service; 220 volts; Circuit breakers; Natural gas available; Electricity connected; Natural gas connected; Sewer connected
- Home design: Two levels; Single-family residence; Residential property
- Construction: Wood siding; Raised foundation; Shingle roof
- Exterior features: Deck; Front porch
Interior
- Bedrooms: One main-level bedroom
- Flooring: Carpet; Hardwood; Vinyl
- Bathrooms: 2 full bathrooms; 2 half bathrooms; 1 main-level bathroom
- Heating & cooling: Central heating
- Interior features: High ceilings; Wood-frame windows
- Laundry & utility: Washer hookup; Electric dryer hookup; Gas water heater
Neighborhood map
What this means for you Summary
Snapshot
- This is a 4-bed/2.0-bath single-family listed at $70k.
Deal economics
- At list price, monthly cash flow is $583 ($7k/yr) — positive.
- The deal already cash-flows at list — no discount required.
- Meets the 1% rule at list price ($1k rent vs $70k).
- Recommended offer: $61k (12.0% below list) — sets the bar for market timing.
Location & tenants
- Location reads 51/100 on livability (#408 in TN) — a working-class tenant base; expect higher turnover. Strengths: cost of living A+, housing A-; Watch: health & safety C-, schools F, crime D-.
- Trenton (town): math 24% / reading 24% proficiency, ranked #99 of 139 in TN (top 71%) — low school quality limits family demand, transient renter base, plan for 1-2y turnover.
- Market conditions: 82 active listings in the ZIP; 155 units permitted in Gibson County in 2024 (0 in 5+ unit buildings).
Forward outlook
- Local home prices are declining (-3.0%/yr); year-one equity from $482 of loan paydown is wiped out by about $2k of value loss. Plan a longer hold.
- Gibson County population projected to shrink 8% by 2050 — rents likely to lag national; underwrite the cash flow, not the appreciation.
- At projected returns (-3.0% appreciation + 3.0% rent growth), your $20k cash investment doubles in ~4 years — after that, you're playing with house money.
Negotiation context
- It's been on market 239 days — a 12% lower offer ($61k) is reasonable based on typical stale-listing flexibility.
- 2 sale attempts; this cycle's ask has dropped $29k (30%) from the opening price — seller is motivated, your offer sets the floor, not the list.
Risks & watch-outs
- Watch-outs: built in 1900 — expect roof / HVAC / electrical / plumbing capex.
- Climate carrying-cost: extreme-heat days projected 7→20/yr by 2055 (HVAC capex compounding) — expect insurance premiums to compound above CPI over the hold.
Questions for the listing agent
- It's been on market 239 days. Have you received any prior offers? Is the seller open to a 12% concession, seller financing, or rate buy-down credit?
- Built in 1900 — when were the roof, HVAC, electrical panel, plumbing, and water heater last replaced?
- Why hasn't it sold? Are there any deal-killer items the seller is aware of (foundation, flood, title, zoning, code violations)?
- Is there a deadline driving the sale (1031 exchange, divorce, estate, relocation)? That informs how much negotiation room exists.
- Schools are F-rated, which usually means shorter tenancies and higher turnover. Who's the typical renter profile here, and what's been the actual vacancy rate?
- Crime grade is D in this area — have there been break-ins, vandalism, or insurance claims at this property in the last 3 years? What carrier currently insures it and at what premium?
- What's the average days-on-market for RENTAL listings here right now (not sales)? A rising rental-DOM trend means longer vacancies and softer asking-rent achievability than the comps imply.
- What's the recent tenant-quality profile in this submarket — average credit score on applications, eviction rate, late-payment / NSF rate, and stable-employment percentage? A property-management company in the area should have these aggregated.
- How much new for-sale + rental construction is in the pipeline within 1–3 miles? Heavy new supply typically softens prices + rents 12–24 months out; constrained supply supports both.
Investment metrics
- 1% rule
- 1.97% ✓
- Cap rate
- 16.32%
- Cash-on-cash
- 35.82%
- DSCR
- 2.59
- GRM
- 4.2
CMA / ARV
No comps found within radius.
Projected returns pro-forma
-3.0% appreciation · 3.0% rent growth · sell at horizon
- IRR
- 31.5%
- Equity multiple
- 2.32×
- Total profit
- $25,838
- Equity at exit
- $10,392
- IRR
- 38.7%
- Equity multiple
- 4.61×
- Total profit
- $70,403
- Equity at exit
- $6,026
Cash invested: $19,516 (down + closing). Projections, not guarantees.
Landlord ↔ Tenant lean methodology
- Overall (STATE)
- 87 Strongly Landlord-Friendly
- State Tennessee
- 87 Strongly Landlord-Friendly · R+13
- County
- — inherits STATE
- City
- — inherits STATE
ZIP-level market 38382
- Home prices YoY
- -14.0%
- Active inventory
- 82
- Price-to-rent
- 4.2×
Monthly cashflow live
- Estimated rent
- $1,371 medium interval (Pro) →
- Mortgage (P&I)
- −$366
- Tax from tax record
- −$106 /mo · $1,273/yr
- Insurance
- −$29
- HOA
- −$0
- Vacancy / Maint / Mgmt
- −$288
- Net cashflow
- $583
Break-even live
UW: 25.0% down · 7.5% · 30yr · 1.5% tax · 5.0% vac · 8.0% maint · 8.0% mgmt
Financing live
Cash to close
- Down payment
- $17,425
- Closing costs
- $2,091
- Reserves months
- —
- Total cash needed
- —
Loan-product check · same deal, 3 products live
Conventional
25% down · 7.5% · 30yr
- Down + closing
- —
- Monthly P&I
- —
- Monthly cashflow
- —
- DSCR
- —
- Eligible?
- —
Personal DTI + credit; lowest rate.
DSCR
20% down · 8.5% · 30yr
- Down + closing
- —
- Monthly P&I
- —
- Monthly cashflow
- —
- DSCR
- —
- Eligible?
- —
No personal income docs; deal must DSCR.
Hard money
10% down · 12.0% · 12mo
- Down + closing
- —
- Monthly P&I
- —
- Monthly cashflow
- —
- DSCR
- —
- Eligible?
- —
Short-term bridge; refi at stabilization.
Listing history 25 events
-
2026-06-18price $69,700 Active 239 DOM
-
2026-06-18days on market $74,700 Active 239 DOM
-
2026-06-17days on market $74,700 Active 238 DOM
-
2026-06-16days on market $74,700 Active 237 DOM
-
2026-06-15days on market $74,700 Active 236 DOM
-
2026-06-13days on market $74,700 Active 234 DOM
-
2026-06-12days on market $74,700 Active 233 DOM
-
2026-06-09days on market $74,700 Active 230 DOM
-
2026-06-08days on market $74,700 Active 229 DOM
-
2026-06-08days on market $74,700 Active 228 DOM
-
2026-06-07days on market $74,700 Active 227 DOM
-
2026-06-03days on market $74,700 Active 224 DOM
-
2026-06-02days on market $74,700 Active 223 DOM
-
2026-06-01days on market $74,700 Active 222 DOM
-
2026-05-31days on market $74,700 Active 221 DOM
-
2026-04-18price $74,700
-
2026-02-13price $79,700
-
2026-01-27price $84,700
-
2025-12-05status Active
-
2025-11-29status Pending
-
2025-11-12price $89,900
-
2025-10-15$99,000 Active
-
2008-02-28soldstatus $110,000
-
2001-03-02soldstatus $83,000
-
2001-02-02soldstatus $83,000
ⓘ Source: listings_history table (triggers on properties + properties_extension) + one-shot
backfill from property_details.listing_events for pre-trigger history.
Tax reassessment forecast TN · Resets to sale price
- Current annual tax
- $1,273 · $106/mo
- Projected year-2 tax
- $1,273 · $106/mo
- Expected delta
- $0/yr ($0/mo · 0.0%)
ⓘ Screening estimate from a state-policy table — verify with the county assessor before closing.
Climate risk First Street
- Flood 1/10 Low FEMA zone X (unshaded) · 0% chance over 30 yrs
- Wildfire 3/10 Moderate
- Heat 6/10 Major 7 d/yr ≥108°F today · 20 d/yr by 30 yrs out
- Wind 4/10 Moderate 12% chance of damaging wind over 30 yrs
- Air quality 1/10 Low 0 unhealthy d/yr today · 0 by 30 yrs out
Nearby sold comps map
Loading sold comps map…
Walkable amenities ~0.75 mi
Loading nearby amenities…
Taxation est. · year 1
- Rental income
- $16,453
- − Mortgage interest
- −$3,904
- − Property taxes
- −$1,273
- − Insurance
- −$348
- − Repairs & maintenance
- −$1,316
- − Management
- −$1,316
- − Depreciation
- −$2,028
- Taxable income
- $6,267
- Est. tax owed @ 24.0%
- −$1,504
- After-tax cash flow
- $5,486/yr
For passive investors: Depreciation is non-cash, so a rental often shows a tax loss while cash-flowing — sheltering income. Rental losses are passive: they offset passive income freely, and up to $25,000/yr can offset ordinary (W-2) income if you actively participate and your MAGI is under $100k (phasing out to $0 by $150k); unused losses carry forward. On sale, claimed depreciation is recaptured at up to 25%, and gains may owe capital-gains tax (a 1031 exchange can defer both). Figures are a year-1 estimate at your 24.0% rate — not tax advice; consult a CPA.
Schools (NCES district)
- District
- Trenton
- NCES district ID
- 4704100
- Math proficiency
- 24% ▼ -13.00%
- Reading proficiency
- 24% ▼ -2.00%
- Median HH income
- $33,930
- Composite
- 19.7/100
- National rank
- #8723
- State rank
- #99 of 139 in TN
Livability — Trenton
- Score
- 51/100
- State rank
- #408
- US rank
- #25391
Category grades
Schools grade is shown separately in the Schools card above.
Census & demographics
- Census place
- Trenton, TN
- Population (ZIP)
- 8,163
Population outlook (Gibson County) Hauer SSP2
- Today (2025)
- 48,793 people
- By 2030
- 48,221 · -1.2%
- By 2040
- 46,793 · -4.1%
- By 2050
- 44,909 · -8.0%
- By 2075
- 40,191 · -17.6%
- By 2100
- 33,574 · -31.2%
Race, ethnicity, and origin ACS 2023
- Neighborhood character
- Predominantly White (75%)
- Race & ethnicity
- White 75% Black 17% Two or more races 5% Hispanic / Latino 3%
- Common ancestry
- Italian 1% Portuguese 1% Slovak 1%
- Foreign-born
- 1% · Canada
- Languages at home
- 98% English-only · Spanish 1%
Political lean MEDSL · Gibson
- 2024 margin
- Solid R (+52.0) · D 23.6% · R 75.5%
- 2008→2024 swing
- -23.2pp toward R · 2008: -28.8pp · 2024: -52.0pp
- All cycles
- 2024: R+52.0 2020: R+47.0 2016: R+43.8 2012: R+32.1 2008: R+28.8
Not yet ingested
- Civics
- —
Market trends
- HPI YoY
- ▼ -30.72%
- Current HPI
- 188.1546
- Rent YoY
- —
- Metro
- —
- State GDP YoY
- ▲ 2.78%
- F500 in state
- 22
Industry mix (Fortune 500 HQ in TN)
| Industry | F500 HQs | Revenue |
|---|---|---|
| Healthcare | 3 | $91B |
|
||
| Retail | 3 | $72B |
|
||
| Transportation / Logistics | 1 | $88B |
|
||
| Paper / Packaging | 1 | $19B |
|
||
| Insurance | 1 | $13B |
|
||
| Energy | 1 | $12B |
|
||
Price history
-10.0% since first listed10 events — show timeline
- 2026-04-18 Price Changed $74,700 CWTAR
- 2026-02-13 Price Changed $79,700 CWTAR
- 2026-01-27 Price Changed $84,700 CWTAR
- 2025-12-05 Relisted — CWTAR
- 2025-11-29 Pending — CWTAR
- 2025-11-12 Price Changed $89,900 CWTAR
- 2025-10-15 Listed $99,000 CWTAR
- 2008-02-28 Sold (Public Records) $110,000 Public Records
- 2001-03-02 Sold (Public Records) $83,000 Public Records
- 2001-02-02 Sold (Public Records) $83,000 Public Records
Property tax history
+1.4%/yrLatest (2025): $1,273 · +56.2% YoY. Source: county tax records.
Cash-flow waterfall
monthlySold comps — $/sqft
last 12 mo · ≤1 miLoading sold comps…