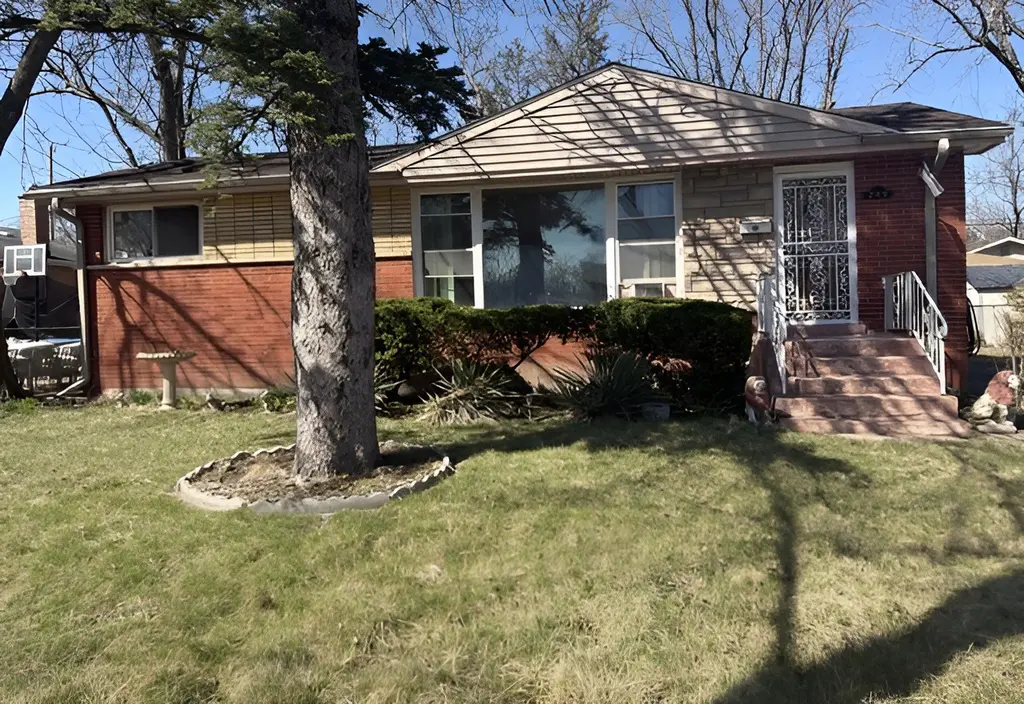
249 Eddy St · Chicago Heights, IL
Flood risk 1/10 · Minimal
- FEMA flood zone
- X (unshaded)
- Chance of flooding over 30 yrs
- 0.0%
- Est. flood insurance / yr
- $473 – $860
Fire risk 1/10 · Minimal
- Est. fire insurance / yr
- $804 – $1,492
Heat risk 3/10 · Minor
- Hot days now (above 101°F)
- 7 days/yr
- Hot days in 30 yrs
- 15 days/yr
Wind risk 2/10 · Minimal
- Chance of severe wind over 30 yrs
- —
Air-quality risk 2/10 · Minimal
- Unhealthy air days now
- 1 days/yr
- Unhealthy air days in 30 yrs
- 1 days/yr
Risk factors via First Street. Map © Google.
Why this score? — see what drove the B+ grade
The composite is a weighted blend of 9 inputs, each scored 0–100. Each bar is that input's sub-score; the figure is the points it added to the 100-point composite (weight × sub-score).
- Cash flow +30.0/30.0
- ARV discount +15.0/15.0
- 1% rule +10.0/10.0
- DSCR +10.0/10.0
- Rent growth +4.1/5.0
- Livability +3.6/5.0
- Condition / age +2.5/5.0
- Schools +2.4/10.0
- Appreciation +0.0/10.0
$114,000
🖨 Deal sheet 📄 Offer letter ✓ Due diligence
Listing remarks
This charming 3 bedroom, 1 bath home is ideal for Buyers looking to add their personal touch, as it does need a little TLC. With its brick exterior and functional layout, it is a great canvas to bring your vision to life. Do not miss this opportunity to transform this home into something truly special! The full, unfinished basement provides ample storage and an excellent opportunity to expand your living space. Sold As Is. Do not wait! Make your offer today!
Key facts
- Brick exterior
- Expand living space
- Ample storage
Tags
Property features AI
Finance
- HOA & community: No master association fee required
Exterior
- Parking: Detached owned garage (1 garage space, 1 total parking space)
- Utilities: Public water; Public sewer
- Home design: Detached single-family home; One-story
- Construction: Brick construction; Built before 1978 (age ~61–70 years)
- Exterior features: Lot dimensions approximately 66 x 94 x 71 x 90; Lot less than 0.25 acre
Interior
- Kitchen: Kitchen on the main level
- Bedrooms: 3 bedrooms (all on the main level); Master bedroom on the main level
- Bathrooms: 1 full bathroom
- Heating & cooling: Natural gas forced air heating
- Interior features: 6 total rooms; Full, unfinished daylight basement
- Laundry & utility: Laundry room
Neighborhood map
What this means for you Summary
Snapshot
- This is a 3-bed/1.0-bath single-family listed at $114k.
Deal economics
- At list price, monthly cash flow is $747 ($9k/yr) — positive.
- The deal already cash-flows at list — no discount required.
- Meets the 1% rule at list price ($2k rent vs $114k).
- Recommended offer: $107k (6.0% below list) — sets the bar for market timing.
- Cap rate 14.2% vs local median 6.4% in Chicago Heights — top-decile yield for the area; either an underpriced asset or a hidden risk that comps aren't pricing in. Stress-test before assuming the spread holds.
Location & tenants
- Location reads 71/100 on livability (#339 in IL) — a middle-class / working-renter tenant base. Strengths: commute A+, cost of living A+, housing A+; Watch: employment C-, crime F, amenities F.
- Homewood Flossmoor Chsd 233 (suburban): math 21% / reading 27% proficiency, ranked #272 of 620 in IL (top 44%) — low school quality limits family demand, transient renter base, plan for 1-2y turnover.
- Zoned schools: Homewood-Flossmoor High School (math 21% / reading 27%, grade F, #304 of 693 statewide, top 44%, 2,798 students, 0% FRL).
- Market conditions: Rents rising fast (+6.5%/yr); 222 active listings in the ZIP; 6,272 units permitted in Cook County in 2024 (4,658 in 5+ unit buildings).
- This rent runs 36% of the median local income ($62k/yr) — at the standard rent-burdened threshold; future hikes will face affordability resistance.
Forward outlook
- Local home prices are declining (-3.0%/yr); year-one equity from $788 of loan paydown is wiped out by about $3k of value loss. Plan a longer hold.
- At projected returns (-3.0% appreciation + 6.5% rent growth), your $32k cash investment doubles in ~4 years — after that, you're playing with house money.
Negotiation context
- It's been on market 69 days — a 6% lower offer ($107k) is reasonable based on typical stale-listing flexibility.
- 3 sale attempts; this cycle's ask has dropped $6k (5%) from the opening price — seller is motivated, your offer sets the floor, not the list.
- Current owner paid $44k; list at $114k implies a 159% gain — meaningful room to come down on a strong offer.
Questions for the listing agent
- It's been on market 69 days. Have you received any prior offers? Is the seller open to a 6% concession, seller financing, or rate buy-down credit?
- Built in 1960 — when were the roof, HVAC, electrical panel, plumbing, and water heater last replaced?
- Why hasn't it sold? Are there any deal-killer items the seller is aware of (foundation, flood, title, zoning, code violations)?
- Is there a deadline driving the sale (1031 exchange, divorce, estate, relocation)? That informs how much negotiation room exists.
- Schools are F-rated, which usually means shorter tenancies and higher turnover. Who's the typical renter profile here, and what's been the actual vacancy rate?
- Crime grade is F in this area — have there been break-ins, vandalism, or insurance claims at this property in the last 3 years? What carrier currently insures it and at what premium?
- What's the average days-on-market for RENTAL listings here right now (not sales)? A rising rental-DOM trend means longer vacancies and softer asking-rent achievability than the comps imply.
- What's the recent tenant-quality profile in this submarket — average credit score on applications, eviction rate, late-payment / NSF rate, and stable-employment percentage? A property-management company in the area should have these aggregated.
- How much new for-sale + rental construction is in the pipeline within 1–3 miles? Heavy new supply typically softens prices + rents 12–24 months out; constrained supply supports both.
Investment metrics
- 1% rule
- 1.64% ✓
- Cap rate
- 14.16%
- Cash-on-cash
- 28.08%
- DSCR
- 2.25
- GRM
- 5.1
CMA / ARV
- ARV (on-the-fly)
- $192,770
- Comps found
- 12
Show comp detail 12 sales within ~0.75 mi
| Address | Dist | Beds/Ba | Sqft | Sold | Price | $/sf | Match |
|---|---|---|---|---|---|---|---|
| 223 Lynn Ln | 0.08mi | 3/1.5 | 1,042 (0%) | 2mo | $119,000 | $114 | 92 |
| 273 Charles St | 0.09mi | 3/2.0 | 1,050 (+1%) | 1mo | $210,000 | $200 | 90 |
| 381 Iris Ln | 0.12mi | 4/2.0 (+1) | 1,042 (0%) | 9mo | $289,000 | $277 | 78 |
| 234 Tahoe Dr | 0.40mi | 3/1.0 | 1,084 (+4%) | 8mo | $200,000 | $185 | 68 |
| 87 E Craig Dr | 0.54mi | 3/2.0 | 1,065 (+2%) | 2mo | $175,000 | $164 | 66 |
| 150 Serena Dr | 0.52mi | 3/2.0 | 1,065 (+2%) | 10mo | $255,700 | $240 | 60 |
| 151 N Normandy Dr | 0.70mi | 3/2.0 | 1,070 (+3%) | 2mo | $217,999 | $204 | 57 |
| 154 S Pamela Dr | 0.74mi | 3/1.5 | 1,065 (+2%) | 4mo | $188,500 | $177 | 57 |
| 126 N Floyd Ln | 0.66mi | 3/1.5 | 1,070 (+3%) | 7mo | $210,000 | $196 | 56 |
| 283 W Elmwood Dr | 0.42mi | 3/1.5 | 1,148 (+10%) | 9mo | $210,000 | $183 | 54 |
| 145 Sherry Ln | 0.51mi | 3/1.0 | 1,148 (+10%) | 7mo | $130,750 | $114 | 53 |
| 110 Judith Ln | 0.60mi | 3/2.0 | 1,171 (+12%) | 7mo | $184,000 | $157 | 42 |
Match score weights: distance 35% · size 25% · config 20% · recency 20%. Top-matched comps best support the ARV.
Projected returns pro-forma
-3.0% appreciation · 6.48% rent growth · sell at horizon
- IRR
- 26.0%
- Equity multiple
- 2.12×
- Total profit
- $35,860
- Equity at exit
- $16,998
- IRR
- 35.7%
- Equity multiple
- 4.83×
- Total profit
- $122,280
- Equity at exit
- $9,857
Cash invested: $31,920 (down + closing). Projections, not guarantees.
Landlord ↔ Tenant lean methodology
- Overall (STATE)
- 43 Moderately Tenant-Leaning
- State Illinois
- 43 Moderately Tenant-Leaning · D+7
- County
- — inherits STATE
- City
- — inherits STATE
ZIP-level market 60411
- Home prices YoY
- -33.9%
- Rents YoY
- 6.5%
- Active inventory
- 222
- Price-to-rent
- 5.1×
Monthly cashflow live
- Estimated rent
- $1,867 medium interval (Pro) →
- Mortgage (P&I)
- −$598
- Tax from tax record
- −$83 /mo · $995/yr
- Insurance
- −$48
- HOA
- −$0
- Vacancy / Maint / Mgmt
- −$392
- Net cashflow
- $747
Break-even live
UW: 25.0% down · 7.5% · 30yr · 1.5% tax · 5.0% vac · 8.0% maint · 8.0% mgmt
Financing live
Cash to close
- Down payment
- $28,500
- Closing costs
- $3,420
- Reserves months
- —
- Total cash needed
- —
Loan-product check · same deal, 3 products live
Conventional
25% down · 7.5% · 30yr
- Down + closing
- —
- Monthly P&I
- —
- Monthly cashflow
- —
- DSCR
- —
- Eligible?
- —
Personal DTI + credit; lowest rate.
DSCR
20% down · 8.5% · 30yr
- Down + closing
- —
- Monthly P&I
- —
- Monthly cashflow
- —
- DSCR
- —
- Eligible?
- —
No personal income docs; deal must DSCR.
Hard money
10% down · 12.0% · 12mo
- Down + closing
- —
- Monthly P&I
- —
- Monthly cashflow
- —
- DSCR
- —
- Eligible?
- —
Short-term bridge; refi at stabilization.
Listing history 20 events
-
2026-06-18status $114,000 Pending 69 DOM
-
2026-06-18days on market $114,000 Active 69 DOM
-
2026-06-17days on market $114,000 Active 68 DOM
-
2026-06-16days on market $114,000 Active 67 DOM
-
2026-06-15days on market $114,000 Active 66 DOM
-
2026-06-13days on market $114,000 Active 64 DOM
-
2026-06-09days on market $114,000 Active 60 DOM
-
2026-06-08days on market $114,000 Active 59 DOM
-
2026-06-07days on market $114,000 Active 58 DOM
-
2026-06-04days on market $114,000 Active 55 DOM
-
2026-06-03days on market $114,000 Active 54 DOM
-
2026-06-02days on market $114,000 Active 53 DOM
-
2026-06-01days on market $114,000 Active 52 DOM
-
2026-05-31days on market $114,000 Active 51 DOM
-
2026-05-13status Active
-
2026-05-13status Pending
-
2026-04-23status Active
-
2026-04-21status Pending
-
2026-04-08$120,000 Active
-
1992-10-20soldstatus $44,000
ⓘ Source: listings_history table (triggers on properties + properties_extension) + one-shot
backfill from property_details.listing_events for pre-trigger history.
Tax reassessment forecast IL · Partial reset (capped growth)
- Current annual tax
- $995 · $83/mo
- Projected year-2 tax
- $1,791 · $149/mo
- Expected delta
- +$796/yr (+$66/mo · 80.0%)
ⓘ Screening estimate from a state-policy table — verify with the county assessor before closing.
Climate risk First Street
- Flood 1/10 Low FEMA zone X (unshaded) · 0% chance over 30 yrs
- Wildfire 1/10 Low
- Heat 3/10 Moderate 7 d/yr ≥101°F today · 15 d/yr by 30 yrs out
- Wind 2/10 Low
- Air quality 2/10 Low 1 unhealthy d/yr today · 1 by 30 yrs out
Nearby sold comps map
Loading sold comps map…
Walkable amenities ~0.75 mi
Loading nearby amenities…
Taxation est. · year 1
- Rental income
- $22,408
- − Mortgage interest
- −$6,386
- − Property taxes
- −$995
- − Insurance
- −$570
- − Repairs & maintenance
- −$1,793
- − Management
- −$1,793
- − Depreciation
- −$3,316
- Taxable income
- $7,556
- Est. tax owed @ 24.0%
- −$1,813
- After-tax cash flow
- $7,150/yr
For passive investors: Depreciation is non-cash, so a rental often shows a tax loss while cash-flowing — sheltering income. Rental losses are passive: they offset passive income freely, and up to $25,000/yr can offset ordinary (W-2) income if you actively participate and your MAGI is under $100k (phasing out to $0 by $150k); unused losses carry forward. On sale, claimed depreciation is recaptured at up to 25%, and gains may owe capital-gains tax (a 1031 exchange can defer both). Figures are a year-1 estimate at your 24.0% rate — not tax advice; consult a CPA.
Schools (NCES district)
- District
- Homewood Flossmoor Chsd 233
- NCES district ID
- 1719560
- Math proficiency
- 21% ▼ -15.00%
- Reading proficiency
- 27% ▼ -13.00%
- Median HH income
- $83,564
- Composite
- 24.42/100
- National rank
- #7681
- State rank
- #272 of 620 in IL
Livability — Chicago Heights
- Score
- 71/100
- State rank
- #339
- US rank
- #6836
Category grades
Schools grade is shown separately in the Schools card above.
Census & demographics
- Census place
- Chicago Heights, IL
- County
- Cook County · 4,486,803 people
- City population
- 52,175
- Metro
- Chicago-Naperville-Elgin, IL-IN-WI
- Population (ZIP)
- 52,175
- Household income
- $62,073
- Rent vs Own
- Severe rent burden
- 1714.0
Population outlook (Cook County) Hauer SSP2
- Today (2025)
- 5,347,519 people
- By 2030
- 5,357,703 · +0.2%
- By 2040
- 5,324,924 · -0.4%
- By 2050
- 5,230,762 · -2.2%
- By 2075
- 4,785,735 · -10.5%
- By 2100
- 4,188,836 · -21.7%
Race, ethnicity, and origin ACS 2023
- Neighborhood character
- Diverse neighborhood (Simpson 0.66)
- Race & ethnicity
- Black 49% Hispanic / Latino 26% White 19% Two or more races 11%
- Hispanic origin (detail)
- Mexican 22% Puerto Rican 2%
- Common ancestry
- Romanian 4% Portuguese 1% Lithuanian 1%
- Foreign-born
- 12% · Canada
- Languages at home
- 76% English-only · Spanish 21% Russian/Polish/Slavic 1% Other Indo-European 1%
Political lean MEDSL · Cook
- 2024 margin
- Solid D (+42.0) · D 70.4% · R 28.4% · Other 1.2%
- 2008→2024 swing
- -11.4pp toward R · 2008: 53.4pp · 2024: 42.0pp
- All cycles
- 2024: D+42.0 2020: D+50.3 2016: D+53.0 2012: D+49.4 2008: D+53.4
Not yet ingested
- Civics
- —
Market trends
- HPI YoY
- ▼ -108.75%
- Current HPI
- 212.4058
- Rent YoY
- ▲ 6.48%
- Metro
- Chicago-Naperville-Elgin, IL-IN-WI
- State GDP YoY
- ▲ 1.59%
- F500 in state
- 60
Industry mix (Fortune 500 HQ in IL)
| Industry | F500 HQs | Revenue |
|---|---|---|
| Insurance | 4 | $201B |
|
||
| Consumer Goods | 4 | $87B |
|
||
| Industrial Machinery | 3 | $64B |
|
||
| Healthcare | 2 | $55B |
|
||
| Retail / Pharmacy | 1 | $148B |
|
||
| Agriculture / Food | 1 | $86B |
|
||
Price history
+172.7% since first listed6 events — show timeline
- 2026-05-13 Relisted — MRED as Distributed by MLS Grid
- 2026-05-13 Pending — MRED as Distributed by MLS Grid
- 2026-04-23 Relisted — MRED as Distributed by MLS Grid
- 2026-04-21 Pending — MRED as Distributed by MLS Grid
- 2026-04-08 Listed $120,000 MRED as Distributed by MLS Grid
- 1992-10-20 Sold (Public Records) $44,000 Public Records
Property tax history
-6.0%/yrLatest (2023): $995 · -77.9% YoY. Source: county tax records.
Cash-flow waterfall
monthlySold comps — $/sqft
last 12 mo · ≤1 miLoading sold comps…