7805 Thor Dr · Corpus Christi, TX
Flood risk No data
- FEMA flood zone
- —
- Chance of flooding over 30 yrs
- —
- Est. flood insurance / yr
- —
Fire risk No data
- Est. fire insurance / yr
- —
Heat risk No data
- Hot days now (above threshold)
- —
- Hot days in 30 yrs
- —
Wind risk No data
- Chance of severe wind over 30 yrs
- —
Air-quality risk No data
- Unhealthy air days now
- —
- Unhealthy air days in 30 yrs
- —
Risk factors via First Street. Map © Google.
Why this score? — see what drove the D grade
The composite is a weighted blend of 9 inputs, each scored 0–100. Each bar is that input's sub-score; the figure is the points it added to the 100-point composite (weight × sub-score).
- Cash flow +14.2/30.0
- ARV discount +7.5/15.0
- DSCR +4.3/10.0
- 1% rule +4.0/10.0
- Livability +3.9/5.0
- Rent growth +3.0/5.0
- Schools +2.8/10.0
- Condition / age +2.5/5.0
- Appreciation +0.0/10.0
$234,999
🖨 Deal sheet 📄 Offer letter ✓ Due diligence
Listing remarks
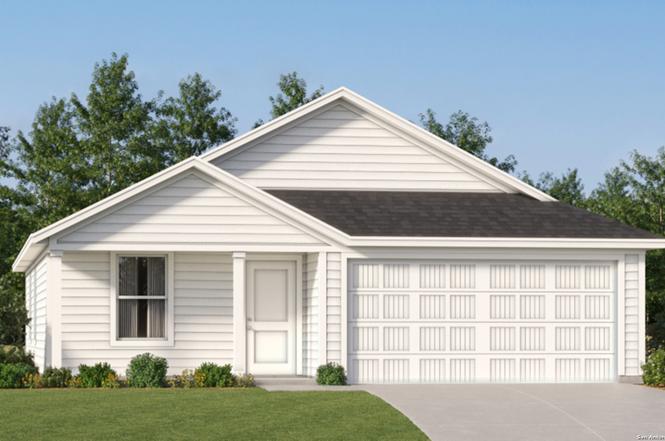
The Beckman- This new home is conveniently laid out on a single floor for maximum comfort and convenience. At its heart stands an open-concept layout connecting a spacious family room, a multi-functional kitchen and lovely dining area. The owner's suite is situated in a private corner and comes complete with an adjoining bathroom, while the two secondary bedrooms are located near the foyer. Estimated Completion April 2026. The completion date, prices and features may vary and are subject to change. Please verify with Lennar directly. Photos are for illustrative purposes only.
Key facts
- Adjoining bathroom
- Private corner
- Owner's suite
Tags
Neighborhood map
What this means for you Summary
Snapshot
- This is a 3-bed/2.0-bath land listed at $235k.
Deal economics
- At list price, monthly cash flow is $39 ($463/yr) — positive.
- The deal already cash-flows at list — no discount required.
- To meet the 1% rule (rent ≥ 1% of price), the offer needs to be $210k (10.4% below list).
- Recommended offer: $210k (10.4% below list) — sets the bar for 1% rule.
- Cap rate 6.5% vs local median 3.6% in Corpus Christi — top-decile yield for the area; either an underpriced asset or a hidden risk that comps aren't pricing in. Stress-test before assuming the spread holds.
Location & tenants
- Location reads 78/100 on livability (#66 in TX, #2,404 nationally) — a middle-class / working-renter tenant base. Strengths: commute A+, cost of living A+, housing A+; Watch: crime F.
- Corpus Christi ISD (urban): math 31% / reading 35% proficiency, ranked #562 of 826 in TX (top 68%) — families likely to look elsewhere, expect single-tenant / working-renter base with shorter leases; 63% free/reduced lunch — lower-income household profile, screen leases tightly.
- Market conditions: Rents rising (+1.9%/yr); 610 active listings in the ZIP; 12 comparable units currently listed for rent nearby; rentals lingering (median 44d on market — plan ~5-8 weeks vacancy on turnover, expect pricing pressure); 50% of comp listings sitting > 30 days — soft ceiling on asking rent; solid renter incomes; 1,397 units permitted in Nueces County in 2024 (47 in 5+ unit buildings).
Forward outlook
- Local home prices are declining (-3.0%/yr); year-one equity from $2k of loan paydown is wiped out by about $7k of value loss. Plan a longer hold.
- Nueces County population projected at +36% by 2050 — long-run rental-demand tailwind backs the buy-and-hold thesis.
Negotiation context
- It's been on market 83 days — a 6% lower offer ($221k) is reasonable based on typical stale-listing flexibility.
Questions for the listing agent
- It's been on market 83 days. Have you received any prior offers? Is the seller open to a 10% concession, seller financing, or rate buy-down credit?
- Why hasn't it sold? Are there any deal-killer items the seller is aware of (foundation, flood, title, zoning, code violations)?
- Is there a deadline driving the sale (1031 exchange, divorce, estate, relocation)? That informs how much negotiation room exists.
- Crime grade is F in this area — have there been break-ins, vandalism, or insurance claims at this property in the last 3 years? What carrier currently insures it and at what premium?
- The area grade is low — what's the realistic commute time and amenity access for the typical tenant pool here? Any planned neighborhood developments (good or bad) we should know about?
- What's the average days-on-market for RENTAL listings here right now (not sales)? A rising rental-DOM trend means longer vacancies and softer asking-rent achievability than the comps imply.
- What's the recent tenant-quality profile in this submarket — average credit score on applications, eviction rate, late-payment / NSF rate, and stable-employment percentage? A property-management company in the area should have these aggregated.
- How much new for-sale + rental construction is in the pipeline within 1–3 miles? Heavy new supply typically softens prices + rents 12–24 months out; constrained supply supports both.
Investment metrics
- 1% rule
- 0.90% ✗
- Cap rate
- 6.49%
- Cash-on-cash
- 0.70%
- DSCR
- 1.03
- GRM
- 9.3
CMA / ARV
No comps found within radius.
Projected returns pro-forma
-3.0% appreciation · 1.94% rent growth · sell at horizon
- IRR
- -16.4%
- Equity multiple
- 0.43×
- Total profit
- $-37,812
- Equity at exit
- $35,039
- IRR
- -10.1%
- Equity multiple
- 0.41×
- Total profit
- $-38,555
- Equity at exit
- $20,318
Cash invested: $65,800 (down + closing). Projections, not guarantees.
Landlord ↔ Tenant lean methodology
- Overall (STATE)
- 87 Strongly Landlord-Friendly
- State Texas
- 87 Strongly Landlord-Friendly · R+5
- County
- — inherits STATE
- City
- — inherits STATE
ZIP-level market 78414
- Home prices YoY
- -18.1%
- Rents YoY
- 1.9%
- Active inventory
- 610
- Price-to-rent
- 9.3×
Monthly cashflow live
- Estimated rent
- $2,105 high interval (Pro) →
- Mortgage (P&I)
- −$1,232
- Tax est. 1.5%
- −$294 /mo · $3,525/yr
- Insurance
- −$98
- HOA
- −$0
- Vacancy / Maint / Mgmt
- −$442
- Net cashflow
- $39
Break-even live
UW: 25.0% down · 7.5% · 30yr · 1.5% tax · 5.0% vac · 8.0% maint · 8.0% mgmt
Financing live
Cash to close
- Down payment
- $58,750
- Closing costs
- $7,050
- Reserves months
- —
- Total cash needed
- —
Loan-product check · same deal, 3 products live
Conventional
25% down · 7.5% · 30yr
- Down + closing
- —
- Monthly P&I
- —
- Monthly cashflow
- —
- DSCR
- —
- Eligible?
- —
Personal DTI + credit; lowest rate.
DSCR
20% down · 8.5% · 30yr
- Down + closing
- —
- Monthly P&I
- —
- Monthly cashflow
- —
- DSCR
- —
- Eligible?
- —
No personal income docs; deal must DSCR.
Hard money
10% down · 12.0% · 12mo
- Down + closing
- —
- Monthly P&I
- —
- Monthly cashflow
- —
- DSCR
- —
- Eligible?
- —
Short-term bridge; refi at stabilization.
Rent comps 12 comps
| Address | Beds | Baths | Sqft | Rent | $/sqft | DOM | Units | Dist |
|---|---|---|---|---|---|---|---|---|
| 7818 Doctor Strange Dr Corpus Christi, TX | 3.0 | 2.0 | 1214 | $2,000 | $1.65 | 43d | 1 | 0.12mi |
| 7705 Wonder Woman Dr Corpus Christi, TX | 3.0 | 2.0 | 1663 | $2,000 | $1.20 | 13d | 1 | 0.21mi |
| 7702 Spiderman Dr Corpus Christi, TX | 4.0 | 2.0 | 1639 | $2,400 | $1.46 | 21d | 1 | 0.27mi |
| 7713 Lariat Toss Dr Corpus Christi, TX | 3.0 | 2.0 | 1518 | $2,300 | $1.52 | 43d | 1 | 0.52mi |
| 7610 Rustler Ln Corpus Christi, TX | 3.0 | 2.0 | 1584 | $2,150 | $1.36 | 21d | 1 | 0.61mi |
| 7822 Fort Griffen Dr Corpus Christi, TX | 3.0 | 2.0 | 1618 | $2,100 | $1.30 | 13d | 1 | 0.71mi |
| 7230 Tristan Dr Corpus Christi, TX | 4.0 | 2.0 | 1838 | $2,395 | $1.30 | 43d | 1 | 0.73mi |
| 3810 Los Arroyos Dr Corpus Christi, TX | 3.0 | 2.0 | 1578 | $2,300 | $1.46 | 21d | 1 | 1.21mi |
| 3617 Garnet Ct Corpus Christi, TX | 4.0 | 2.0 | 1758 | $2,125 | $1.21 | 43d | 1 | 1.41mi |
| 8001 Rock Crest Dr Corpus Christi, TX | 3.0 | 2.0 | 1320 | $1,950 | $1.48 | 43d | 1 | 1.42mi |
| 8226 Excalibur Rd Corpus Christi, TX | 3.0 | 2.0 | 1792 | $2,250 | $1.26 | 13d | 1 | 1.46mi |
| 7001 Lipes Blvd Unit 1009 Corpus Christi, TX | 2.0 | 2.0 | 1040 | $1,000 | $0.96 | 43d | 1 | 1.49mi |
Listing history 12 events
-
2026-04-22status Pending
-
2026-04-17price $234,999
-
2026-04-14price $245,999
-
2026-04-11price $246,999
-
2026-04-09price $248,999
-
2026-04-03price $252,999
-
2026-03-25price $268,999
-
2026-03-24price $256,999
-
2026-03-18price $254,999
-
2026-03-12price $255,999
-
2026-02-24price $266,999
-
2026-01-29$271,999 New
ⓘ Source: listings_history table (triggers on properties + properties_extension) + one-shot
backfill from property_details.listing_events for pre-trigger history.
Nearby sold comps map
Loading sold comps map…
Walkable amenities ~0.75 mi
Loading nearby amenities…
Taxation est. · year 1
- Rental income
- $25,255
- − Mortgage interest
- −$13,164
- − Property taxes
- −$3,525
- − Insurance
- −$1,175
- − Repairs & maintenance
- −$2,020
- − Management
- −$2,020
- − Depreciation
- −$6,836
- Taxable loss
- −$3,486
- Est. tax savings @ 24.0%
- +$837
- After-tax cash flow
- $1,300/yr
For passive investors: Depreciation is non-cash, so a rental often shows a tax loss while cash-flowing — sheltering income. Rental losses are passive: they offset passive income freely, and up to $25,000/yr can offset ordinary (W-2) income if you actively participate and your MAGI is under $100k (phasing out to $0 by $150k); unused losses carry forward. On sale, claimed depreciation is recaptured at up to 25%, and gains may owe capital-gains tax (a 1031 exchange can defer both). Figures are a year-1 estimate at your 24.0% rate — not tax advice; consult a CPA.
Schools (NCES district)
- District
- Corpus Christi ISD
- NCES district ID
- 4815270
- Math proficiency
- 31% ▼ -18.00%
- Reading proficiency
- 35% ▼ -7.00%
- Median HH income
- $45,672
- Composite
- 28.27/100
- National rank
- #6793
- State rank
- #562 of 826 in TX
Livability — Corpus Christi
- Score
- 78/100
- State rank
- #66
- US rank
- #2404
Category grades
Schools grade is shown separately in the Schools card above.
Census & demographics
- Census place
- Corpus Christi, TX
- County
- Nueces County · 296,836 people
- City population
- 296,836
- Metro
- Corpus Christi, TX
- Population (ZIP)
- 54,263
- Household income
- $98,771
- Rent vs Own
- Severe rent burden
- 1167.0
Population outlook (Nueces County) Hauer SSP2
- Today (2025)
- 418,037 people
- By 2030
- 447,123 · +7.0%
- By 2040
- 505,911 · +21.0%
- By 2050
- 567,522 · +35.8%
- By 2075
- 729,686 · +74.6%
- By 2100
- 847,087 · +102.6%
Race, ethnicity, and origin ACS 2023
- Neighborhood character
- Diverse neighborhood (Simpson 0.60)
- Race & ethnicity
- Hispanic / Latino 52% White 35% Two or more races 33% Asian 6% Black 3%
- Hispanic origin (detail)
- Mexican 46% Puerto Rican 1%
- Common ancestry
- Lithuanian 1% Slovak 1% Romanian 1%
- Foreign-born
- 9% · Canada, China, South Korea
- Languages at home
- 70% English-only · Spanish 24% Other Indo-European 2% Chinese 1%
Political lean MEDSL · Nueces
- 2024 margin
- R (+11.5) · D 43.8% · R 55.3%
- 2008→2024 swing
- -7.1pp toward R · 2008: -4.4pp · 2024: -11.5pp
- All cycles
- 2024: R+11.5 2020: R+2.9 2016: R+1.5 2012: R+3.2 2008: R+4.4
Not yet ingested
- Civics
- —
Market trends
- HPI YoY
- ▼ -40.16%
- Current HPI
- 182.3229
- Rent YoY
- ▲ 1.94%
- Metro
- Corpus Christi, TX
- State GDP YoY
- ▲ 3.95%
- F500 in state
- 110
Industry mix (Fortune 500 HQ in TX)
| Industry | F500 HQs | Revenue |
|---|---|---|
| Energy | 16 | $1,198B |
|
||
| Technology | 5 | $198B |
|
||
| Engineering / Construction | 4 | $72B |
|
||
| Energy Services | 3 | $60B |
|
||
| Utilities | 3 | $41B |
|
||
| Healthcare | 2 | $330B |
|
||
Price history
-13.6% since first listed12 events — show timeline
- 2026-04-22 Pending — LERA
- 2026-04-17 Price Changed $234,999 LERA
- 2026-04-14 Price Changed $245,999 LERA
- 2026-04-11 Price Changed $246,999 LERA
- 2026-04-09 Price Changed $248,999 LERA
- 2026-04-03 Price Changed $252,999 LERA
- 2026-03-25 Price Changed $268,999 LERA
- 2026-03-24 Price Changed $256,999 LERA
- 2026-03-18 Price Changed $254,999 LERA
- 2026-03-12 Price Changed $255,999 LERA
- 2026-02-24 Price Changed $266,999 LERA
- 2026-01-29 Listed $271,999 LERA
Cash-flow waterfall
monthlySold comps — $/sqft
last 12 mo · ≤1 miLoading sold comps…